A lot of (virtual) ink has been spilled on this blog about automated testing (no, really). This post is another in a series of dives into different automated testing tools and how you can use them to deliver a better, higher-quality web application.
Here, we’re going to focus on tools and services specific to ‘visual regression testing‘ – specifically cross-browser visual testing of an application front end.
What?
By visual regression testing, we mean regression testing applied specifically to an app’s appearance may have changed across browsers or over time as opposed to functional behavior.
Why?
One of the most common starting points in testing a web app is to simply fire up a given browser, navigate to the app in your testing environment, and note any discrepancy in appearance (“oh look, the login button is upside down. Who committed this!?”).

A spicy take on how to enforce code quality – we won’t be going here.
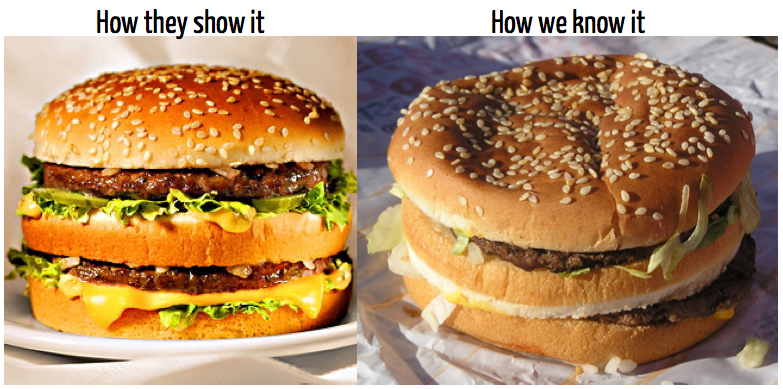
The strength of visual regression testing is that you’re testing the application against a very humanistic set of conditions (how does the application look to the end user versus how it should look). The drawback is that doing this is generally time consuming and tedious. But that’s what we have automation for!

How our burger renders in Chrome vs how it renders in IE 11…
How?
A wise person once said, ‘In software automation, there is no such thing as a method call for “if != ugly, return true”‘.
For the most part – this statement is true. There really isn’t a ‘silver bullet’ for the software automation problem of fully automating testing the appearance of your web application across a given browser support matrix. At least not with some caveats.
The methods and tools for doing so can run afoul of at least one of the following:
- They’re Expensive (in terms of time, money or both)
- They’re Fragile (tests emit false negatives, can be unreliable)
- They’re Limited (covers only a subset of supported browsers)

Sure, you can support delicate tools. Just keep in mind the total cost.
Tools
We’re going to show how you can quickly set up a set of tools using WebdriverIO, some simple JavaScript test code and the visual-regression-service module to create snapshots of your app front end and perform a test against its look and feel.
Setup
Assuming you already have a web app ready for testing in your choice of environment (hopefully not in production) and that you are familiar with NodeJS, let’s get down to writing our testing solution:

This meme is so old, I can’t even…
1. From the command line, create a new project directory and do the following in order:
- ‘npm init’ (follow the initialization prompts – feel free to use the defaults and update them later)
- ‘npm install –save-dev webdriverio’
- ‘npm install –save-dev wdio-visual-regression-service’
- ‘npm install –save-dev chai’
2. Once you’ve finished installing your modules, you’ll need to configure your instance of WebdriverIO. You can do this manually by creating the file ‘wdio.conf.js’ and placing it in your project root (refer to the WebdriverIO developers guide on what to include in your configuration file) or you can use the wdio automated configuration script.
3. To quickly configure your tools, kick off the automated configuration script by running ‘npm run wdio’ from your project root directory. During the configuration process, be sure to select the following (or include this in your wdio.conf.js file if you’re setting things up manually):
- Under frameworks, be sure to enable Mocha (we’ll use this to handle things like assertions)
- Under services be sure to enable the following:
- visual-regression
- Browserstack (we’ll leverage Browserstack to handle all our browser requests from WebdriverIO)
Note that in this case, we won’t install the selenium standalone service or any local testing binaries like Chromedriver. The purpose of this exercise is to quickly package together some tools with a very small footprint that can handle some high-level regression testing of any given web app front end.
Once you have completed the configuration script, you should have a wdio.conf.js file in your project configured to use WebdriverIO and the visual-regression service.
Next, we need to create a test.
Writing a Test
First, make a directory within your project’s main source called tests/. Within that directory, create a file called homepage.js.
Set the contents of the file to the following:
describe('home page', () => {
  beforeEach(function () {
  browser.url('/');
});

it('should look as expected', () => {
browser.checkElement('#header');
});
});
That’s it. Within the single test function, we are calling a method from the visual-regression service, ‘checkElement()’. In our code, we are providing the ID, ‘header’ as an argument but you should replace this argument with the ID or CSS selector of a container element on the page you wish to check.
When executed, WebdriverIO will open the root URL path it is provided for our web application then will execute its check element comparison operation. This will generate a series of reference screen shots of the application. The regression service will then generate screen shots of the app in each browser it is configured to test with and provide a delta between these screens and the reference image(s).
A More Complex Test:
You may have a need to articulate part of your web application before you wish to execute your visual regression test. You also may need to execute the checkElement() function multiple times with multiple arguments to fully vet your app front end’s look and feel in this manner.
Fortunately, since we are simply inheriting the visual regression service’s operations through WebdriverIO, we can combine WebriverIO-based method calls within our tests to manipulate and verify our application:
describe('home page', () => {
  beforeEach(function () {
  browser.url('/');
  });

  it('should look as expected', () => {
    browser.waitForVisible('#header');
    browser.checkElement('#header');
  });

  it('should look normal after I click the button, () => {
    browser.waitForVisible('.big_button');
    browser.click('.big_button');
    browser.waitForVisible('#main_content');
    browser.checkElement('#main_content');
  });

  it('should have a footer that looks normal too, () => {
    browser.scroll('#footer');
    browser.checkElement('#footer');
  });
});
Broad vs. Narrow Focus:
One of several factors that can add to the fragility of a visual test like this is attempting to account for minor changes in your visual elements. This can be a lot to bite off and chew at once.
Attempting to check the content of a large and heavily populated container (e.g. the body tag) is likely going to contain so many possible variations across browsers that your test will always throw an exception. Conversely, attempting to narrow your tests’ focus to something very marginal (e.g. selecting a single instance of a single button) may never be touched by code implemented by front end developers and thus, you may be missing crucial changes to your app UI.
This is waaay too much to test at once.
The visual-regression service’s magic is in that it allows you to target testing to specific areas of a given web page or path within your app – based on web selectors that can be parsed by Webdriver.

And this is too little…
Ideally, you should be choosing web selectors with a scope of content that is not too large nor too small but in between. A test that focuses on comparing content of a specific div tag that contains 3-4 widgets will likely deliver much more value than one that focuses on the selector of a single button or a div that contains 30 widgets or assorted web elements.
Alternately, some of your app front end may be generated by templating or scaffolding that never received updates and is siloed away from code that receives frequent changes from your team. In this case, marshalling tests around these aspects may result in a lot of misspent time.

But this is just about right!
Choose your area of focus accordingly.
Back to the Config at Hand:
Before we run our tests, let’s make a few updates to our config file to make sure we are ready to roll with our initial homepage verification script.
First, we will need to add some helper functions to facilitate screenshot management. At the very top of the config file, add the following code block:
var path = require('path');
var VisualRegressionCompare = require('wdio-visual-regression-service/compare');

function getScreenshotName(basePath) {
  return function(context) {
    var type = context.type;
    var testName = context.test.title;
    var browserVersion = parseInt(context.browser.version, 10);
    var browserName = context.browser.name;
    var browserViewport = context.meta.viewport;
    var browserWidth = browserViewport.width;
    var browserHeight = browserViewport.height;

    return path.join(basePath, `${testName}_${browserName}_v${browserVersion}_${browserWidth}x${browserHeight}.png`);
  };
}
This function will be utilized to build the paths for our various screen shots we will be taking during the test.
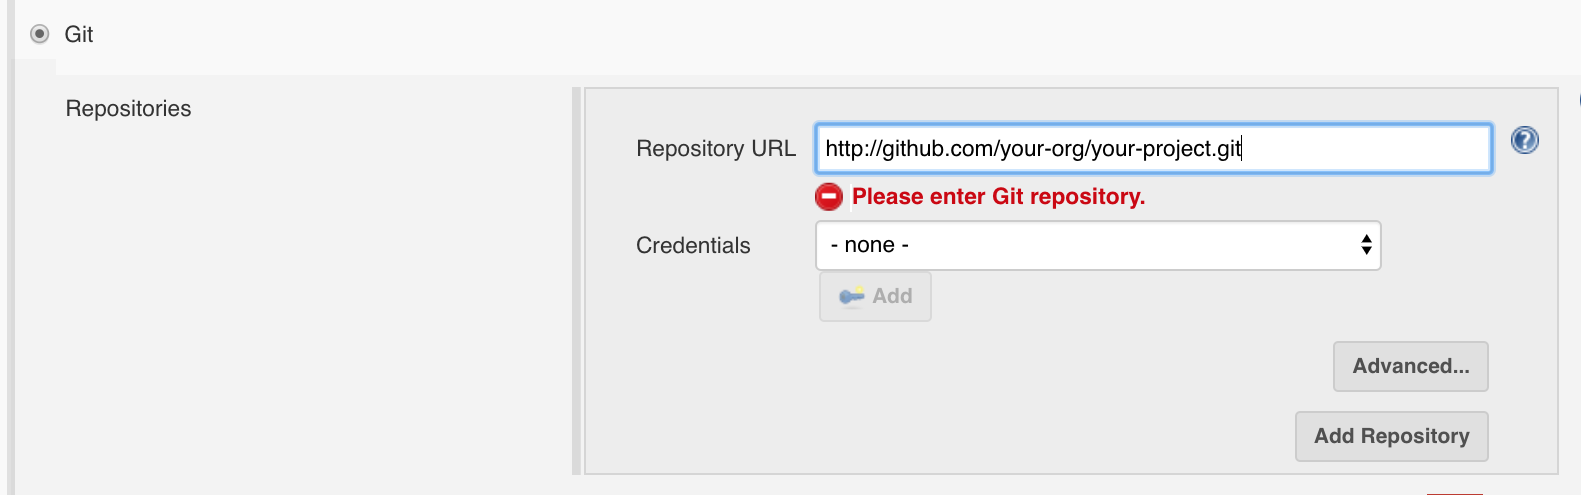
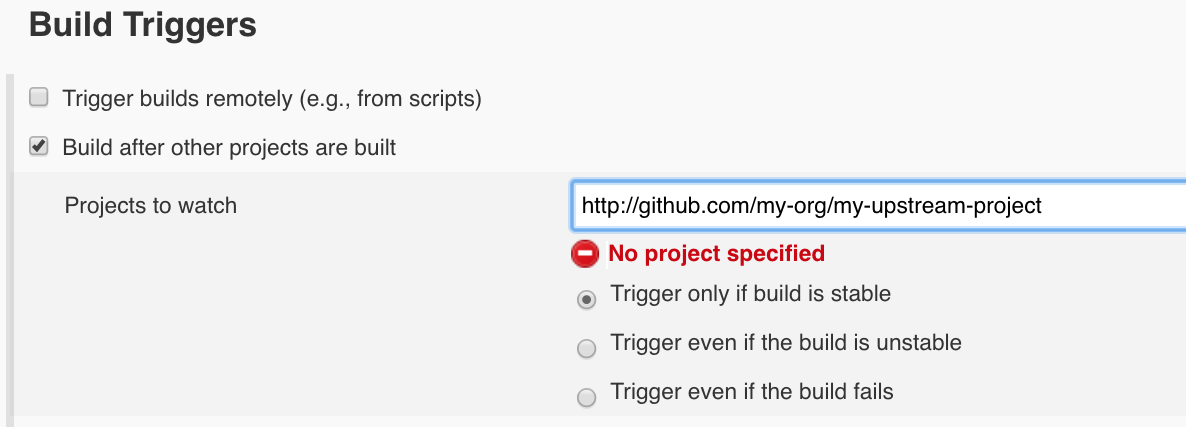
As stated previously, we are leveraging Browserstack with this example to minimize the amount of code we need to ship (given we would like to pull this project in as a resource in a Jenkins task) while allowing us greater flexibility in which browsers we can test with. To do this, we need to make sure a few changes in our config file are in place.
Note that if you are using a different browser provisioning services (SauceLabs, Webdriver’s grid implementation), see WebdriverIO’s online documentation for how to set you wdio configuration for your respective service here).
Open your wdio.conf.js file and make sure this block of code is present:
user: process.env.BSTACK_USERNAME,
key: process.env.BSTACK_KEY,
host: 'hub.browserstack.com',
port: 80,
This allows us to pass our browser stack authentication information into our wdio script via the command line.
Next, let’s set up which browsers we wish to test with. This is also done within our wdio config file under the ‘capabilities’ object. Here’s an example:
capabilities: [
{
  browserName: 'chrome',
  os: 'Windows',
  project: 'My Project - Chrome',
  'browserstack.local': false,
},
{
  browserName: 'firefox',
  os: 'Windows',
  project: 'My Project - Firefox',
  'browserstack.local': false,
},
{
  browserName: 'internet explorer',
  browser_version: 11,
  project: 'My Project - IE 11',
  'browserstack.local': false,
},
],
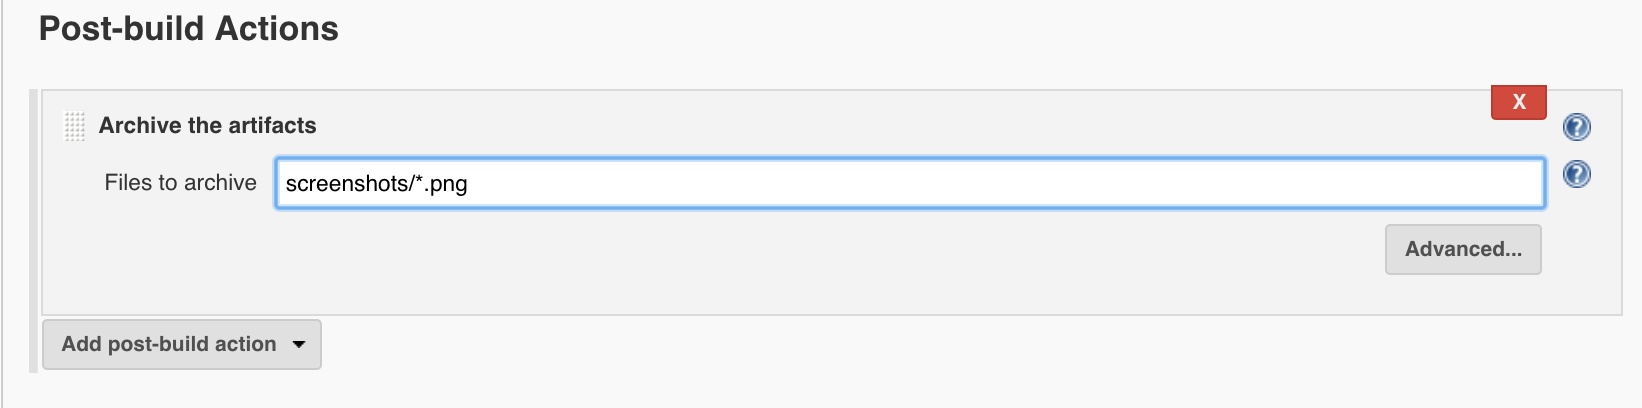
Where to Put the Screens:
While we are here, be sure you have set up your config file to specifically point to where you wish to have your screen shots copied to. The visual-regression service will want to know the paths to 4 types of screenshots it will generate and manage:

Yup… Too many screens
References: This directory will contain the reference images the visual-regression service will generate on its initial run. This will be what our subsequent screen shots will be compared against.
Screens: This directory will contain the screen shots generated per browser type/view by tests.
Errors: If a given test fails, an image will be captured of the app at the point of failure and stored here.
Diffs: If there is a given comparison performed by the visual-regression service between an element from a browser execution and the reference images which results in a discrepancy, a ‘heat-map’ image of the difference will be capture and stored here. Consider the content of this directory to be your test exceptions.
Things Get Fuzzy Here:

Fuzzy… Not Fozzy
Finally, before kicking off our tests, we need to enable our visual-regression service instance within our wdio.conf.js file. This is done by adding a block of code to our config file that instructs the service on how to behave. Here is an example of the code block taken from the WebdriverIO developer guide:
visualRegression: {
  compare: new VisualRegressionCompare.LocalCompare({
    referenceName: getScreenshotName(path.join(process.cwd(), 'screenshots/reference')),
    screenshotName: getScreenshotName(path.join(process.cwd(), 'screenshots/screen')),
    diffName: getScreenshotName(path.join(process.cwd(), 'screenshots/diff')),
    misMatchTolerance: 0.20,
  }),
  viewportChangePause: 300,
  viewports: [{ width: 320, height: 480 }, { width: 480, height: 320 }, { width: 1024, height: 768 }],
  orientations: ['portrait'],
},
Place this code block within the ‘services’ object in your file and edit it as needed. Pay attention to the following attributes and adjust them based on your testing needs:
‘viewports’: This is a JSON object that provides width/height pairs to test the application at. This is very handy if you have an app that has specific responsive design constraints. For each pair, the test will be executed per browser – resizing the browser for each set of dimensions.
‘orientations’: This allows you to configure the tests to execute using portrait and/or landscape view if you happen to be testing in a mobile browser (default orientation is portrait).
‘viewportChangePause’: This value pauses the test in milliseconds at each point the service is instructed to change viewport sizes. You may need to throttle this depending on app performance across browsers.
‘mismatchTolerance’: Arguably the most important setting there. This floating-point value defines the ‘fuzzy factor’ which the service will use to determine at what point a visual difference between references and screen shots should fail. The default value of 0.10 indicates that a diff will be generated if a given screen shot differs, per pixel from the reference by 10% or more. The greater the value the greater the tolerance.
Once you’ve finished modifying your config file, lets execute a test.
Running Your Tests:
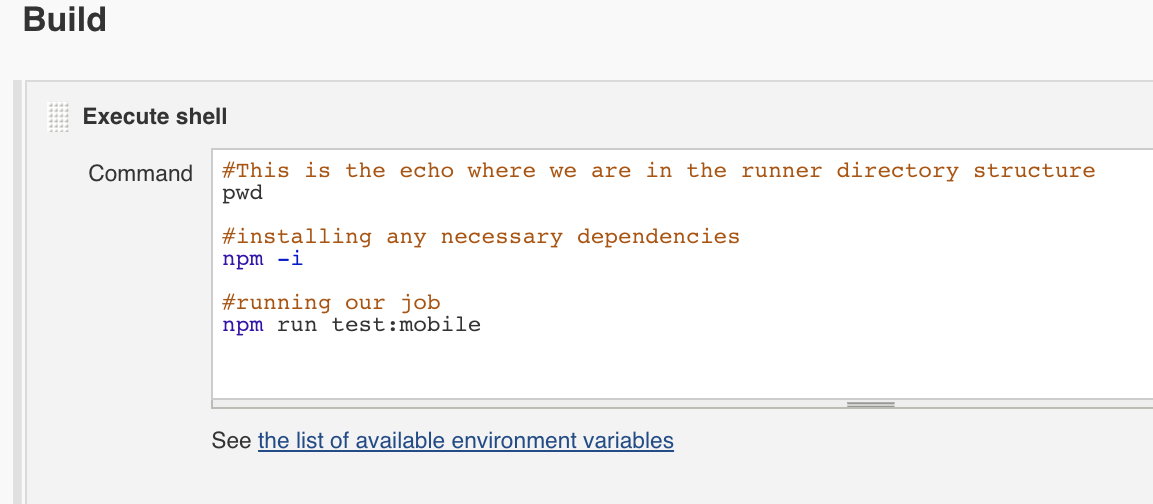
Provided your config file is set to point to the root of where your test files are located within the project, edit your package.json file and modify the ‘test’ descriptor in the scripts portion of the file.
Set it to the following:
‘./node_modules/.bin/wdio /wdio.desktop.conf.js’
To run your test, from the command line, do the following:
‘BSTACK_USERNAME= BSTACK_KEY= npm run test — –baseUrl=’
Now, just sit back and wait for the test results to roll in. If this is the first time you are executing these tests, the visual-regression service can fail while trying to capture initial references for various browsers via Browserstack. You may need to increase your test’s global timeout initially on the first run or simply re-run your tests in this case.
Reviewing Results:
If you’re used to your standard JUnit or Jest-style test execution output, you won’t necessarily similar test output here.
If there is a functional error present during a test (an object you are attempting to inspect isn’t available on screen) a standard Webdriver-based exception will be generated. However, outside of that, your tests will pass – even if a discrepancy is visually detected.
However, examine your screen shot folder structure we mentioned earlier. Note the number of files that have been generated. Open a few of them to view what has been capture through IE 11 vs. Chrome while testing through Browserstack.
Note that the files have names appended to them descriptive of the browser and viewport dimensions they correspond to.

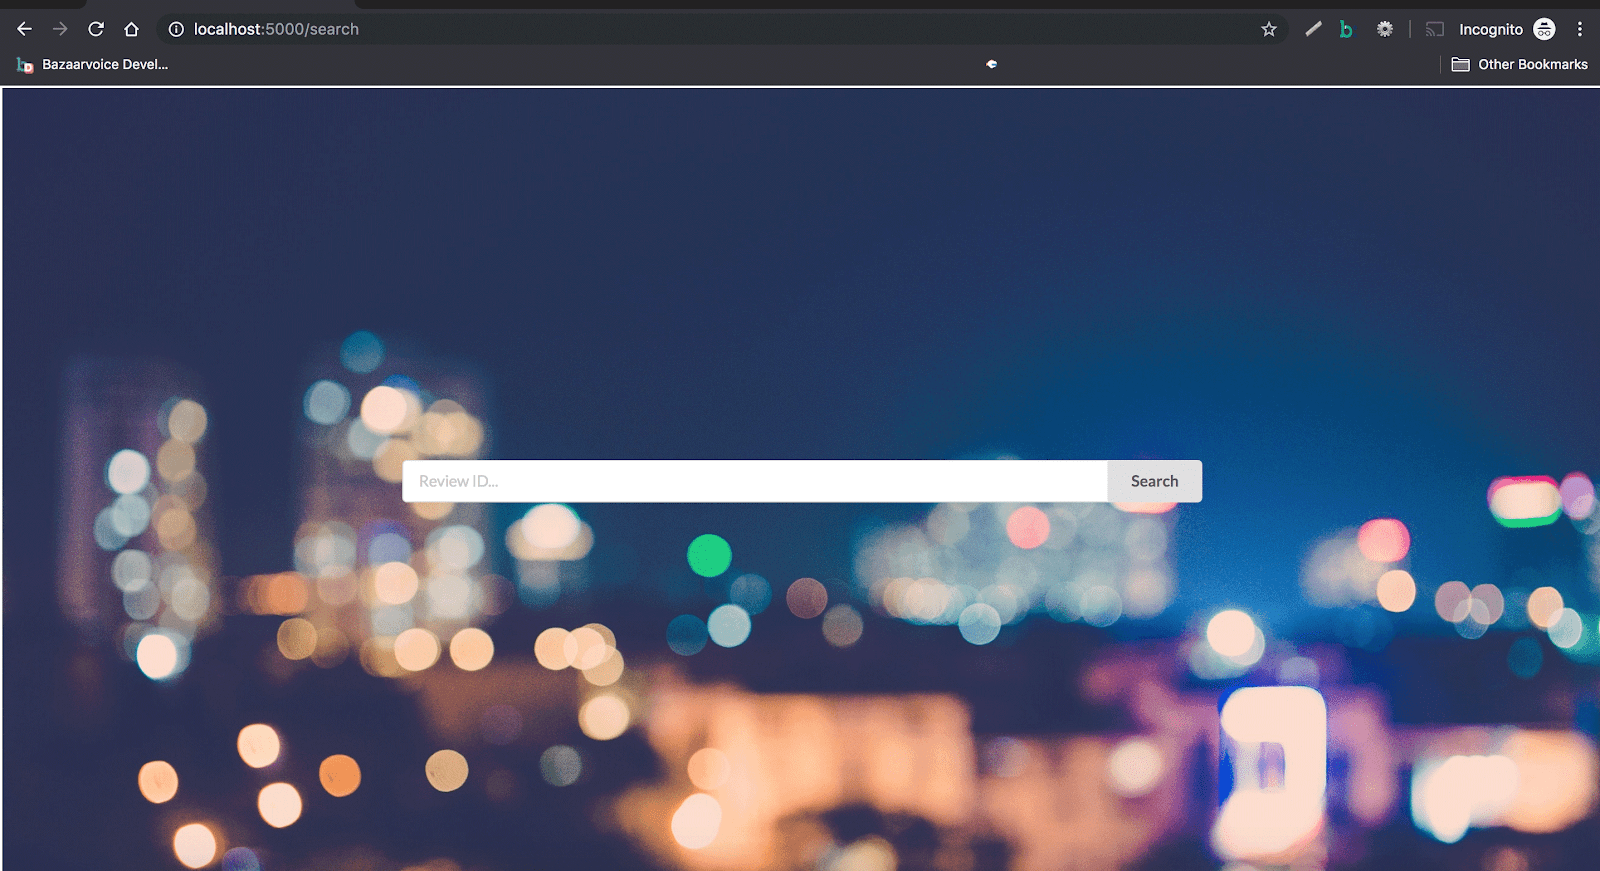
Example of a screen shot from a specific browser
Make note if the ‘Diff’ directory has been generated. If so, examine its contents. These are your test results – specifically, your test failures.

Example of a diff’ed image
There are plenty of other options to explore with this basic set of tooling we’ve set up here. However, we’re going to pause here and bask in the awesomeness of being able to perform this level of browser testing with just 5-10 lines of code.
Is there More?
This post really just scratches the surface of what you can do with a set of visual regression test tools. There are many more options to use these tools such as enabling mobile testing, improving error handling and mating this with your build tools and services.
We hope to cover these topics in a bit more depth in a later post. For now, if you’re looking for additional reading, feel free to check out a few other related posts on visual regression testing here, here and here.