Category Archives: Testing

How We Scale to 16+ Billion Calls

The holiday season brings a huge spike in traffic for many companies. While increased traffic is great for retail business, it also puts infrastructure reliability to the test. At times when every second of uptime is of elevated importance, how can engineering teams ensure zero downtime and performant applications? Here are some key strategies and considerations we employ at Bazaarvoice as we prepare our platform to handle over 16 Billion API calls during Cyber Week.

Key to approaching readiness for peak load events is defining the scope of testing. Identify which services need to be tested and be clear about success requirements.  A common trade off will be choosing between reliability and cost. When making this choice, reliability is always the top priority. ‘Customer is Key’ is a key value at Bazaarvoice, and drives our decisions and behavior.  Service Level Objectives (SLOs) drive clarity of reliability requirements through each of our services.

Reliability is always the top priority

When customer traffic is at its peak, reliability and uptime must take precedence over all other concerns. While cost efficiency is important, the customer experience is key during these critical traffic surges. Engineers should have the infrastructure resources they need to maintain stability and performance, even if it means higher costs in the short-term.

Thorough testing and validation well in advance is essential to surfacing any issues before the holidays. All critical customer-facing services undergo load and failover simulations to identify performance bottlenecks and points of failure. In a Serverless-first architecture, ensuring configuration like reserved concurrency and quota limits are sufficient for autoscaling requirements are valuable to validate.  Often these simulations will uncover problems you have not previously encountered. For example, in this year’s preparations our load simulations uncovered scale limitations in our redis cache which required fixes prior to Black Friday.

“It’s not only about testing the ability to handle peak load”

It’s important to note readiness is not only about testing the ability to handle peak load. Disaster recovery plans are validated through simulated scenarios. Runbooks are verified as up-to-date, to ensure efficient incident response in the event something goes wrong. Verifying instrumentation and infrastructure that supports operability are tested, ensuring our tooling works when we need it most.

Similarly ensuring the appropriate tooling and processes are in place to address security concerns is another key concern. Preventing DDoS attacks which could easily overwhelm the system if not identified and mitigated, preventing impact of service availability.

Predicting the future

Observability through actionable monitoring, logging, and metrics provides the essential visibility to detect and isolate emerging problems early. It also provides the historical context and growth of traffic data over time, which can help forecast capacity needs and establish performance baselines that align with real production usage. In addition to quantitative measures, proactively reaching out to clients means we are in step with client needs about expected traffic helping align testing to actual usage patterns.  This data is important to simulate real world traffic patterns based on what has gone before, and has enabled us to accurately predict Black Friday traffic trends. However it’s important our systems are architected to scale with demand, to handle unpredicted load if need be, key to this is observing and understanding how our systems behave in production.

Traffic Trends

What did it look like this year? Consumer shopping patterns remained quite consistent on an elevated scale. Black Friday continues to be the largest shopping day of the year, and consumers continue to shop online in increasing numbers. During Cyber Week alone, Bazaarvoice handled over 16 Billion API calls.

Solving common problems once

While individual engineering teams own service readiness, having a coordinated effort ensures all critical dependencies are covered. Sharing forecasts, requirements, and learnings across teams enables better preparation. Testing surprises on dependent teams should be avoided through clear communication.

Automating performance testing, failover drills, and monitoring checks as part of regular release cycles or scheduled pipelines reduces the overhead of peak traffic preparation. Following site reliability principles and instilling always-ready operational practices makes services far more resilient year-round. 

For example, we recently put in place a shared dev pattern for continuous performance testing.  This involves a quick setup of k6 performance script, an example github action pipeline and observability configured to monitor performance over time. We also use an in-house Tech Radar to converge on common tooling so a greater number of teams can learn and stand on the shoulders of teams who have already tried and tested tooling in their context.

Other examples include, adding automation to performance tests to replay production requests for a given load profile makes tests easier to maintain, and reflect more accurately production behavior. Additionally, make use of automated fault injection tooling, chaos engineering and automated runbooks.

Adding automation and ensuring these practices are part of your everyday way of working are key to reducing the overhead of preparing for the holidays.

Consistent, continuous training conditions us to always be ready

Moving to an always-ready posture ensures our infrastructure is scalable, reliable and robust all year round. Implementing continuous performance testing using frequent baseline tests provides frequent feedback on performance from release to release.  Automated operational readiness service checks ensure principles and expectations are in place for production services and are continuously checked.  For example, automated checking of expected monitors, alerts, runbooks and incident escalation policy requirements.

At Bazaarvoice our engineering teams align on shared System Standards which gives technical direction and guidance to engineers on commonly solved problems, continuously evolving our systems and increasing our innovation velocity.  To use a trail running analogy, System Standards define the preferred paths and combined with Tech Radar, provide recommendations to help you succeed.  For example, what trail running shoes should I choose, what energy refuelling strategy should I use, how should I monitor performance.  The same is true for building resilient reliable software, as teams solve these common problems, share the learnings for those teams which come after.

Looking Ahead

With a relentless focus on reliability, scalability, continuous testing, enhanced observability, and cross-team collaboration, engineering organizations can optimize performance and minimize downtime during critical traffic surges. 

Don’t forget after the peak has passed and we have descended from the summit, analyze the data.  What went well, what didn’t go well, and what opportunities are there to improve for the next peak.

Root Cause Analysis for Hadoop Applications

Parth Shah and Thai Bui

Overview

One of the reasons why Hadoop jobs are hard to operate is their inability to provide clear, actionable error diagnostic messages for users. This stems from the fact that Hadoop consists of many interrelated components. When a component fails or behaves poorly, the failure will be cascaded to its dependent components which causes a job to fail.

This blog post is an attempt to help to solve that problem by created a user-friendly, self-serving and actionable Hadoop diagnostic system.

Our Goals

Due to its complex nature, the project was split into multiple components. First, we prototyped a diagnostic tool to help debug Hadoop application failure by providing a clear root cause analysis and save engineering time. Second we purposely inflict failures on a cluster (via a method called chaos testing) and collected the data to understand how certain log messages map to errors. Finally, we examined regular expression as well as natural language processing (NLP) techniques to automatically provide root cause analysis in production.

To document this, we organized the blog in the following sections:

  • Error Message Analytics Portal
    • To provide a quick glance at the known root cause.
  • Datadog Dashboard
    • To calculate failure rates related to the unknown root cause and known root cause.
    • Separate infrastructure failure from a missing data failure (missing partition).
  • Data Access
    • All relevant logs messages from services like Yarn, Oozie, HDFS, hive server, etc. were collected and stored under an S3 bucket with an expiration policy.
  • Chaos Data Generation
    • Using chaos testing, we produced actual errors related to memory, network, etc. This was done to understand relationships between log messages and root cause errors.
    • A service was made to create an efficient and simple way to run chaos tests and collect its corresponding/related log data.
  • Diagnostic Message Classification
    • Due to the simple and repetitive nature of log messages (low in entropy), we built a natural language processing model that classified specific error types of an unknown failure.
    • Tested the model on the chaos data for the specific workload at Bazaarvoice

Error Message Analytics Portal

Bazaarvoice provides an internal portal tool for managing analytics applications by the end-users. The following screenshot demonstrates an example message of a “Job failures due to missing data”. This message is caught by using a simple regular expression of the stack trace. A regular expression works because there is only one way a job could fail due to missing data.


DataDog Dashboard

What is a partition?

Partitioning is a strategy of dividing a table into related parts based on date, components or other categories. Using a partition, it is easy and faster to query a portion of data. However, the partition a job is querying can sometimes not be available which causes a job to fail by our design. The dashboard below calculates metrics and keeps track of jobs that failed due to an unavailable partition.

The dashboard classifies failed jobs as either a partition failure (late/missing data) or an unknown failure (Hadoop application failure). Our diagnostic tool attempts to find the root cause of the unknown failures since a late or missing data is an easy problem to solve. 


Data Access

Since our clusters are powered by Apache Ambari, we leveraged and enhanced Ambari Logsearch Logfeeder to ship logs of relevant services directly to S3 and partitioned the data by as shown in the raw_log of the Directory Tree Diagram below. However, as the dataset got bigger, partitioning was not enough to efficiently query the data. To speed up read performance and to iterate faster, the data was later converted into ORC format.


Convert JSON logs to ORC logs

DROP TABLE IF EXISTS default.temp_table_orc;
CREATE EXTERNAL TABLE default.temp_table_orc (
cluster STRING,
file STRING,
thread_name STRING,
level STRING,
event_count INT,
ip STRING,
type STRING,
...
hour INT,
component STRING
) STORED AS ORC
LOCATION 's3a://<bucket_name>/orc-log/${workflowYear}/${workflowMonth}/${workflowDay}/${workflowHour}/';
INSERT INTO default.temp_table_orc SELECT * FROM bazaar_magpie_rook.rook_log
WHERE year=${workflowYear} AND month=${workflowMonth} AND day=${workflowDay} AND hour=${workflowHour};

Sample Queries for Root Cause Diagnosis

SELECT t1.log_message,
       t1.logtime,
       t1.level,
       t1.type,
       t2.Frequency
FROM
  (SELECT log_message,
          logtime,
          TYPE,
          LEVEL
   FROM
     ( SELECT log_message,
              logtime,
              TYPE,
              LEVEL,
              row_number() over (partition BY log_message
                                 ORDER BY logtime) AS r
      FROM bazaar_magpie_rook.rook_log
      WHERE cluster_name = 'cluster_name'
        AND DAY = 28
        AND MONTH=06
        AND LEVEL = 'ERROR' ) S
   WHERE S.r = 1 ) t1
LEFT JOIN
  (SELECT log_message,
          COUNT(log_message) AS Frequency
   FROM bazaar_magpie_rook.rook_log
   WHERE cluster_name = 'cluster_name'
     AND DAY = 28
     AND MONTH=06
     AND LEVEL = 'ERROR'
   GROUP BY log_message) t2 ON t1.log_message = t2.log_message
WHERE t1.logtime BETWEEN '2019-06-28 13:05:00' AND '2019-06-28 13:30:00'
ORDER BY t1.logtime
LIMIT 400;

SELECT log_message, logtime, type
FROM bazaar_magpie_rook.rook_log WHERE level = 'ERROR' AND type != 'logsearch_feeder' AND logtime BETWEEN '2019-06-24 09:05:00' AND '2019-06-24
12:30:10'
ORDER BY logtime
LIMIT 1000;

SELECT log_message, COUNT(log_message) AS Frequency
FROM  bazaar_magpie_rook.rook_log
WHERE cluster_name = 'dev-blue-3' AND level = 'ERROR' AND logtime BETWEEN '2019-06-27 13:50:00' AND '2019-06-29 14:30:00'
GROUP BY log_message
ORDER BY COUNT(log_message) DESC
LIMIT 10;

Chaos Data Generation

The chaos data generation process makes up a bulk of this project as well is the most important. It stems from the process of chaos testing to experiment on software and infrastructure in order to understand the systems ability to withstand unexpected or turbulent conditions. This concept of testing was first introduced by Netflix in 2011. The following pseudocode explains how it works.

Submit a normal job through an API on a specific cluster

Create a list of IP addresses for all the testable nodes in that cluster (such as the workers nodes).

Once we have all associated nodes, inject failures into them (stress test memory or network)

While the job is not done

    Let the job run

At this point, the job has either failed or succeeded

Stop all stress tests

Gather the job details such as start time, end time, status, and most importantly its associated stress test type (memory, packet_corruption, etc.). 

Store job details and its report in JSON format

Job Report Example

{
"duration":"45 Minutes",
"nominalTime":"2018-10-27 07:00:00",
"cost":0.7974499089253186,
"downloadLinks":[],
"errorMessage":"Error: Main class [org.apache.oozie.action.hadoop.Hive2Main], exit code [2]",
"startTime":"2019-07-25 18:45:37",
"stopTime":"2019-07-25 19:31:18","failedAction":"hive-action",
"chaos_error":"packet_corruption",
"workflowId":"0001998-190628043141230-oozie-oozi-W",
"status":"KILLED"
}

We followed the same process to generate chaos data on different types of injected failures such as:

  • High Memory Utilization on the Host
  • Packet Corruption
  • Packet Loss
  • High Memory Util on a Container

While there are certainly more errors the model is capable of learning and classifying, for the purpose of prototyping we kept the type of failures to 2-3 categories.

Diagnostic Message Classification

In this section, we explore 2 types of error classification methods, a simple regex and supervised learning.

Short Term Solution with Regex

There are many ways to analyze text for different patterns. One of these ways is called Regular Expression Matching (regex). Regex is “special strings representing a pattern to be matched in search operation”. One use of regex is finding a keyword like “partition”. When a job fails due to missing partitions its error message usually looks something like this “Not all partitions are available even after 16 attempts“. The regex for this specific case would look like \W*((?i)partition(?-i))\W* .

A regex log parser could easily be able to identify this error and do what is necessary to fix the problem. However, the power of regex is very limiting when it comes to analyzing complex log messages and stack traces. When we find a new error, we would have to manually hardcode a new regular expression to pattern match the new error type which is very error-prone and tedious in the long run.

Since the Hadoop eco-system includes many components, there are many combinations of log messages that can be produced; a simple regex parser would be difficult to work here because it can not process general similarities between different sentences. This is where natural language processing helps.

Long Term Solution with Supervised Learning

The idea behind this solution is to use natural language processing to process log messages and supervised learning to learn and classify errors. This model should work well with log data vs. normal language due since machine logs are more structured and low in entropy. You can think of entropy as a measure of how unstructured or random a set of data is. The English language tends to have high entropy relative to machine logs due to its sometimes illogical sentence structure. On the other hand, machine-generated log data is very repetitive which makes it easier to model and classify.

Our model required pre-processing of logs which are called tokenization. Tokenization is the process of taking a set of text and breaking it up into its individual words or tokens. Next, the set of tokens were used to model their relationship in high dimensional space using Word2Vec. Word2Vec is a widely popular model used for learning vector representation of words called, “word embeddings” (word2vec). Finally, we use the vector representation to train a simple logistic regression classifier using the chaos data generated earlier. The diagram below shows a similar training processing from Experience Report: Log Mining using Natural Language Processing and Application to Anomaly Detection by Christophe Bertero, Matthieu Roy, Carla Sauvanaud and Gilles Tredan.


In contrast to the diagram above, since we only trained the classifier on error logs, it was not possible to classify a normal system as it should produce no error logs. Instead, we trained the data on different types of stressed systems. Using the dataset generated by chaos testing, we were able to identify the root cause for each of the error message for each failed job. This allowed us to make our training dataset as shown below. We split our dataset into a simple 70% training and 30% for testing.

Subsequently, each log message was tokenized to create a word vector. All the tokens were inputted into a pre-trained word2vec model which mapped out each word in a vector space, creating a word embedding. Each line was represented as a list of vectors and an average of all the vectors in a log message represents the feature vector in high dimensional space. We then inputted each feature vector and its labels into a classification algorithm such as logistic regression or random forest to create a model that could predict the root cause error from a logline. However, since failure often contains multiple error log messages, it would not be logical to simply reach a root cause conclusion from just a single line of the log from a long error log. A simple way to tackle this problem would be to window the log and input the individual lines from the window into the model and output the final error as the most common error outputted by all the lines in a window. This is a very naive way of breaking apart long error log so more research would have to be done to process error logs without losing the valuable insight of their dependent messages.

Below are a few examples of error log messages and their tokenized version.

Example Raw Log

java.lang.RuntimeException: org.apache.thrift.transport.TSaslTransportException: No data or no sasl data in the stream at org.apache.thrift.transport.TSaslServerTransport$Factory.getTransport(TSaslServerTransport.java:219)
    at org.apache.thrift.server.TThreadPoolServer$WorkerProcess.run(TThreadPoolServer.java:269)
    at java.util.concurrent.ThreadPoolExecutor.runWorker(ThreadPoolExecutor.java:1149)
    at java.util.concurrent.ThreadPoolExecutor$Worker.run(ThreadPoolExecutor.java:624)
    at java.lang.Thread.run(Thread.java:748) [?:1.8.0_191] Caused by: org.apache.thrift.transport.TSaslTransportException: No data or no sasl data in the stream at org.apache.thrift.transport.TSaslTransport.open(TSaslTransport.java:328)
    at org.apache.thrift.transport.TSaslServerTransport.open(TSaslServerTransport.java:41) ~[hive-exec-3.1.0.3.1.0.0-78.jar:3.1.0-SNAPSHOT] at org.apache.thrift.transport.TSaslServerTransport$Factory.getTransport(TSaslServerTransport.java:216)

Tokenized Raw Log

[java,lang,RuntimeException,org,apache,thrift,transport,TSaslTransportException,No,data,no,sasl,data,stream,org,apache,thrift,transport,TSaslServerTransport,Factory,getTransport,TSaslServerTransport,java219]
[org,apache,thrift,server,TThreadPoolExecutor,WorkerProcess,run,TThreadPoolServer,java,269]
...

Results

The model accurately predicted the root cause of failed job with 99.3% accuracy in our test dataset. At an initial glance, the metrics calculated on the test data look very promising. However, we still need to evaluate its efficiency in production to get a more accurate picture. The initial success in this proof of concept warrants further experimentation, testing, and investigation for using NLP to classify errors. 

Training Data 70% (Top 20 Rows)

Test Data Results 30% (Top 20 Rows)

Conclusion

In order to implement this tool in production, data engineers will have to automate certain aspects of the data aggregation and model building pipeline

Self Reporting Errors

A machine learning model is only as good as its data. For this tool to be robust and accurate, any time engineers encounter a new error or an error that the model does not know about, they should report their belief of the root cause so the corresponding errors logs get tagged with the specific root cause error. For instance, when a job fails for a similar reason, the model will be able to diagnose and classify its error type. This can be done through a simple API, form, Hive query that takes in the job id and its assumed root_cause. The idea behind is this that by creating a form, we could manual label log messages and errors in case the classifier fails to correctly diagnose the true problem. 

The self-reported error should take the form of the chaos error to ensure the existing pipeline will work.

Automating Chaos Data Generation

The chaos tests should run on a regular basis in order to keep the model up to date. This could be done by creating a Jenkins job that automatically runs on a regular cadence. Often times, running a stress test will make certain nodes to be unhealthy. It causes our automation to be unable to SSH into the nodes again to stop the stress test such as when the stress test is interfering with connectivity to the node (see the error below). This can be solved by creating a time limit for the stress test, so the script does not have to ssh again once the job has finished. In the long run, as the self-reported errors grow, the model should rely on chaos test generated test less. Chaos tests produce logs for very extreme situations which could be not typical for a normal production environment. 

java.lang.RuntimeException: Unable to setup local port forwarding to 10.8.100.144:22
    at com.bazaarvoice.rook.infra.util.remote.Gateway.connect(Gateway.java:103)
    at com.bazaarvoice.rook.infra.regress.yarn.RootCauseTest.kill_memory_stress_test(RootCauseTest.java:174)

Still Looking Good While Testing: Automated Testing With a Visual Regression Service Part II

If you’ve followed our blog regularly, you’ve probably read our post on using visual regression testing tools and services to better test your applications’ front end look and feel.  If not, take a few minutes to read through our previous post on this topic.

Now that you’re up to speed, let’s take what we did in our previous post to the next level.

In this post, we’re going to show how you can alter your test configuration and code to test mobile browsers through a given testing service (browserstack) as well as get better reporting out of our tests natively and through options available to us in Jenkins.

Adjusting the Fuzz Factor:

If you run your test multiple times across several browsers with the visual regression service  using default settings, you may notice a handful of exception images cropping up in the diff directory which look nearly identical.

browser-fight

Browser fight!!!


If you happen to be testing across several browsers (using Browserstack or a similar service) which potentially have these browsers hosted in real or virtual environments with widely differing screen resolutions, this may impact how the visual-regression service performs its image diff comparison.

To alleviate this, either ensure your various browser hosts are able to display the browser in the same resolution or add a slight increase in your test’s mismatch tolerance.

As mentioned in our previous post, you can do this by editing the values under the ‘visual regression service’ object in your project’s wdio.conf file.  For example:

visualRegression: {
  compare: new VisualRegressionCompare.LocalCompare({
    referenceName: getScreenshotName(path.join(process.cwd(), 'screenshots/reference')),
    screenshotName: getScreenshotName(path.join(process.cwd(), 'screenshots/screen')),
    diffName: getScreenshotName(path.join(process.cwd(), 'screenshots/diff')),
    misMatchTolerance: 0.25,
  }),

Setting the mismatch tolerance value to 0.25 in the above snipped would allow the regression service a 25% margin of error when checking screen shots against any reference images it has captured.

Better Test Results:

Also mentioned in the previous post, one of the drawbacks to given examples of using the visual-regression service in our tests is that there is little feedback being returned other than the output of our image comparison.

head-in-sand

Having fun with that lack of feedback?


However, with a bit of extra code, we can make usable assertion statements in our test executions once a screen comparison event is generated.

The key is the checkElement() method which is really a WebdriverIO method that is enhanced by the visual-regression service.  This method returns an object that contains some meta data about the check being requested for the provided argument.

We can assign the method call to a new variable, which, once we ‘deserialize’ the object into something readable (e.g. a JSON string) we can then leverage Chai or some other framework to use assertions to make our tests more descriptive.

Here’s an example:

it('should test some things visually', () => {
  ...
  let returnedContents = JSON.stringify(browser.checkElement('<my web element>');
  console.log(returnedContents);
  assert.includes('<deserialized text to assert for', returnedContents);
});

In the above code snippet, near the end of the test, we are calling ‘checkElement()’ to do a visual comparison of the contents of the given web element selector, then converting the object returned by ‘checkElement()’ to a string.  Afterward, we are asserting there is some text/string content within the stringified object our comparison returned.

In the case of the text assertion, we would want to assert a successful match message is contained within the returned object.  This is because the ‘checkElement()’ method, while it may return data that indicates a test failure, on its own will not trigger an exception that would appropriately fail our test should an image comparison mismatch occur.

Adding Mobile

going-mobile

Oooh – someone downloaded the pancake app!


Combining WebdriverIO’s framework along with the visual-regression service and a browser test service like Browserstack, we can create tests that run against real browsers.  To do this, we will need to make some changes to our WebdriverIO config.  Try the following:

  1. Make a copy of your wdio.conf.js
  2. Name the copy wdio.mobile.conf.js
  3. Edit your package.json file
  4. Copy the ‘test’ key/value pair under ‘scripts’ and past it to a new line, rename it ‘test:mobile’
  5. Point the test:mobile script to the wdio.mobile.conf.js config file and save your changes

Next, we need to edit the contents of the wdio.mobile.conf.js script to run tests only against mobile devices.  The reason for adding a whole, new test config and script declaration is that due to the way mobile devices behave, there are some settings to declare for mobile browser testing with WebdriverIO and Browserstack which are incompatible with running tests against desktop browsers.

Edit the code block at the top of the mobile config file, changing it to the following:

var path = require('path');
var VisualRegressionCompare = require('wdio-visual-regression-service/compare');
function getScreenshotName(basePath) {
  return function(context) {
    var type = context.type;
    var testName = context.test.title;
    var browserVersion = parseInt(context.browser.version, 10);
    var browserName = context.browser.name;
    var browserOrientation = context.meta.orientation;
    return path.join(basePath,
    `${testName}_${browserName}_v${browserVersion}_${browserOrientation}_mobile.png`);
  };
}

Note that we’ve removed the declarations for height and width dimensions.  As Browserstack allows us to test on actual mobile devices, defining viewport constraints are not only unnecessary, but it will result in our tests failing to execute (the height and width dimension object can’t be passed to webdriver as part of a configuration for a real, mobile device).

Next, update the visual-regression service’s orientation configuration near the bottom of the mobile config files to the following:

orientations: ['portrait', 'landscape'],

Since applications using responsive design can sometime break when moving from one orientation to another on mobile devices, we’ll want to run out tests in both orientation modes.

Stating this behavior in our configuration above will trigger our tests to automatically switch orientations and retest.

Finally, we’ll need to update our browser capability settings in this config file:

capabilities: [
{
  device: 'iPhone 8',
  'browserstack.local': false,
  'realMobile': true,
  project: 'My project - iPhone 8',
},
{
  device: 'iPad 6th',
  'browserstack.local': false,
  'realMobile': true,
  project: 'My project - iPad',
},
{
  device: 'Samsung Galaxy S9',
  'browserstack.local': false,
  'realMobile': true,
  project: 'My project - Galaxy S9',
},
{
  device: 'Samsung Galaxy Note 8',
  'browserstack.local': false,
  'realMobile': true,
  project: 'My project - Note 8',
},
]

In the code above, the ‘realMobile’ descriptor is necessary to run tests against modern mobile devices through Browserstack.  For more information on this, see Browserstack’s documentation.

Once your change is saved, try running your tests on mobile by doing:

npm run test:mobile

Examine the image outputs of your tests and compare them to the results from your desktop test run.  Now you should be able to run tests for your app’s UI across a wide range of browsers (mobile and desktop).

Taking Things to Jenkins

You could include the project we’ve put together so far into the codebase of your app (just copy the dev dependencies from your package.json your specs and configs into the existing project).

Another option is to use this as a standalone testing tool to apply some base screen-shot based verification of your app.

In the following example, we’ll go through the steps you can to set up a project like this as a resource to use in Jenkins to test a given application and send the results to members of your team.

Consider the value of being able to generate a series of targeted screen shots of elements of your app per build and send them to team members like a product manager or UX designer.  This isn’t necessarily ‘heavy lifting’ from a dev ops standpoint but automating any sort of feedback for your app will trend toward delivering a better app, faster.

Assuming you have your project hosted in Github, you have administrative access to Jenkins and that your app is hosted in an environment Jenkins can access (your organization’s Amazon S3 bucket, hosted from a Docker image, etc.):

I. Create a new Jenkins job

jenkins-proj-name


* Create a new Jenkins task within the same space the job that builds and ships your web app (should one exist).  Assign it a name.

II. Configure the job to pull from your image testing app from Github

jenkins-set-repo


* Go to the source control configuration portion of the job.  Enter the info for your repository for the test app you’ve built.

III. Set the project to build periodically

jenkins-set-trigger


* Within the build settings of the job, choose the build periodically option and configure your job’s frequency.

Ideally, you would set this job to trigger once the task that builds and ‘ships’ your app completes successfully (thus, executing your tests every time a new version of the app is published).

Alternatively, to run periodically based on a given time, then enter something like ‘* 23 * * *’ into Jenkins’ cron configuration field to set your job to run once every day (in this case, at 11 PM, relative to your server’s configuration).

IV. Build your shell execution script

jenkins-shell-script


* Create a build step and for your task and choose the shell script option.  You can embed your npm test script execution here.

V. Collect your artifacts

From the list of post build options, choose the ‘archive artifacts’ option.  In the available text field, enter the path to the generated screen shots you wish to capture.  Note that this path may differ depending on how your Jenkins server is configured.  If you’re having trouble pinpointing the exact path to your artifacts, echo the ‘pwd’ command in your shell script step to have the job list your working directory in the job’s console output then work from there.

jenkins-archive

VI. Sending email notifications

jenkins-email-config


* Lastly, choose from the post build options menu the advanced email notification option.

Enter an email or list of email addresses you wish to contact once this job completes.  Fill out your email settings (subject line, body, etc.) and be sure to enter the path to the screen resources you will wish to attach to a given email.

Save your changes and you are ready to go!

This job will run on a regular basis, execute a given set of UI specific tests and send screen capture information to inquiring team members who would want to know.

You can create more nuanced runs but using Jenkins’ clone feature to copy this job, altering to run your mobile-specific tests, diversifying your test runs.

Further Reading

If you’re looking to dive further into visual regression testing, there are several code examples online worth reviewing.

Additionally, there are other visual regression testing services worth investigating such as Percy.IO, Screener.IO and Fluxguard.

Looking Good While Testing: Automated Testing With a Visual Regression Service

A lot of (virtual) ink has been spilled on this blog about automated testing (no, really). This post is another in a series of dives into different automated testing tools and how you can use them to deliver a better, higher-quality web application.

Here, we’re going to focus on tools and services specific to ‘visual regression testing‘ – specifically cross-browser visual testing of an application front end.

What?

By visual regression testing, we mean regression testing applied specifically to an app’s appearance may have changed across browsers or over time as opposed to functional behavior.

Why?

One of the most common starting points in testing a web app is to simply fire up a given browser, navigate to the app in your testing environment, and note any discrepancy in appearance (“oh look, the login button is upside down. Who committed this!?”).

american_psycho

A spicy take on how to enforce code quality – we won’t be going here.


The strength of visual regression testing is that you’re testing the application against a very humanistic set of conditions (how does the application look to the end user versus how it should look). The drawback is that doing this is generally time consuming and tedious.  But that’s what we have automation for!

hamburger_ad_vs_reality

How our burger renders in Chrome vs how it renders in IE 11…

How?

A wise person once said, ‘In software automation, there is no such thing as a method call for “if != ugly, return true”‘.

For the most part – this statement is true. There really isn’t a ‘silver bullet’ for the software automation problem of fully automating testing the appearance of your web application across a given browser support matrix.  At least not with some caveats.

The methods and tools for doing so can run afoul of at least one of the following:

  • They’re Expensive (in terms of time, money or both)
  • They’re Fragile (tests emit false negatives, can be unreliable)
  • They’re Limited (covers only a subset of supported browsers)

faberge_egg

Sure, you can support delicate tools. Just keep in mind the total cost.


Tools

We’re going to show how you can quickly set up a set of tools using WebdriverIO, some simple JavaScript test code and the visual-regression-service module to create snapshots of your app front end and perform a test against its look and feel.

Setup

Assuming you already have a web app ready for testing in your choice of environment (hopefully not in production) and that you are familiar with NodeJS, let’s get down to writing our testing solution:

interesting_man_tests_code

This meme is so old, I can’t even…


1. From the command line, create a new project directory and do the following in order:

  • ‘npm init’ (follow the initialization prompts – feel free to use the defaults and update them later)
  • ‘npm install –save-dev webdriverio’
  • ‘npm install –save-dev wdio-visual-regression-service’
  • ‘npm install –save-dev chai’

2. Once you’ve finished installing your modules, you’ll need to configure your instance of WebdriverIO. You can do this manually by creating the file ‘wdio.conf.js’ and placing it in your project root (refer to the WebdriverIO developers guide on what to include in your configuration file) or you can use the wdio automated configuration script.

3. To quickly configure your tools, kick off the automated configuration script by running ‘npm run wdio’ from your project root directory.  During the configuration process, be sure to select the following (or include this in your wdio.conf.js file if you’re setting things up manually):

  • Under frameworks, be sure to enable Mocha (we’ll use this to handle things like assertions)
  • Under services be sure to enable the following:
    • visual-regression
    • Browserstack (we’ll leverage Browserstack to handle all our browser requests from WebdriverIO)

Note that in this case, we won’t install the selenium standalone service or any local testing binaries like Chromedriver. The purpose of this exercise is to quickly package together some tools with a very small footprint that can handle some high-level regression testing of any given web app front end.

Once you have completed the configuration script, you should have a wdio.conf.js file in your project configured to use WebdriverIO and the visual-regression service.

Next, we need to create a test.

Writing a Test

First, make a directory within your project’s main source called tests/. Within that directory, create a file called homepage.js.

Set the contents of the file to the following:

describe('home page', () => {
  beforeEach(function () {
  browser.url('/');
});

it('should look as expected', () => {
browser.checkElement('#header');
});
});

That’s it. Within the single test function, we are calling a method from the visual-regression service, ‘checkElement()’. In our code, we are providing the ID, ‘header’ as an argument but you should replace this argument with the ID or CSS selector of a container element on the page you wish to check.

When executed, WebdriverIO will open the root URL path it is provided for our web application then will execute its check element comparison operation. This will generate a series of reference screen shots of the application. The regression service will then generate screen shots of the app in each browser it is configured to test with and provide a delta between these screens and the reference image(s).

A More Complex Test:

You may have a need to articulate part of your web application before you wish to execute your visual regression test. You also may need to execute the checkElement() function multiple times with multiple arguments to fully vet your app front end’s look and feel in this manner.

Fortunately, since we are simply inheriting the visual regression service’s operations through WebdriverIO, we can combine WebriverIO-based method calls within our tests to manipulate and verify our application:

describe('home page', () => {
  beforeEach(function () {
  browser.url('/');
  });

  it('should look as expected', () => {
    browser.waitForVisible('#header');
    browser.checkElement('#header');
  });

  it('should look normal after I click the button, () => {
    browser.waitForVisible('.big_button');
    browser.click('.big_button');
    browser.waitForVisible('#main_content');
    browser.checkElement('#main_content');
  });

  it('should have a footer that looks normal too, () => {
    browser.scroll('#footer');
    browser.checkElement('#footer');
  });
});

Broad vs. Narrow Focus:

One of several factors that can add to the fragility of a visual test like this is attempting to account for minor changes in your visual elements. This can be a lot to bite off and chew at once.

Attempting to check the content of a large and heavily populated container (e.g. the body tag) is likely going to contain so many possible variations across browsers that your test will always throw an exception. Conversely, attempting to narrow your tests’ focus to something very marginal (e.g. selecting a single instance of a single button) may never be touched by code implemented by front end developers and thus, you may be missing crucial changes to your app UI.

flight_search_results

This is waaay too much to test at once.


The visual-regression service’s magic is in that it allows you to target testing to specific areas of a given web page or path within your app – based on web selectors that can be parsed by Webdriver.

price_link

And this is too little…


Ideally, you should be choosing web selectors with a scope of content that is not too large nor too small but in between. A test that focuses on comparing content of a specific div tag that contains 3-4 widgets will likely deliver much more value than one that focuses on the selector of a single button or a div that contains 30 widgets or assorted web elements.

Alternately, some of your app front end may be generated by templating or scaffolding that never received updates and is siloed away from code that receives frequent changes from your team. In this case, marshalling tests around these aspects may result in a lot of misspent time.

menu_bar

But this is just about right!


Choose your area of focus accordingly.

Back to the Config at Hand:

Before we run our tests, let’s make a few updates to our config file to make sure we are ready to roll with our initial homepage verification script.

First, we will need to add some helper functions to facilitate screenshot management. At the very top of the config file, add the following code block:

var path = require('path');
var VisualRegressionCompare = require('wdio-visual-regression-service/compare');

function getScreenshotName(basePath) {
  return function(context) {
    var type = context.type;
    var testName = context.test.title;
    var browserVersion = parseInt(context.browser.version, 10);
    var browserName = context.browser.name;
    var browserViewport = context.meta.viewport;
    var browserWidth = browserViewport.width;
    var browserHeight = browserViewport.height;
 
    return path.join(basePath, `${testName}_${browserName}_v${browserVersion}_${browserWidth}x${browserHeight}.png`);
  };
}

This function will be utilized to build the paths for our various screen shots we will be taking during the test.

As stated previously, we are leveraging Browserstack with this example to minimize the amount of code we need to ship (given we would like to pull this project in as a resource in a Jenkins task) while allowing us greater flexibility in which browsers we can test with. To do this, we need to make sure a few changes in our config file are in place.

Note that if you are using a different browser provisioning services (SauceLabs, Webdriver’s grid implementation), see WebdriverIO’s online documentation for how to set you wdio configuration for your respective service here).

Open your wdio.conf.js file and make sure this block of code is present:

user: process.env.BSTACK_USERNAME,
key: process.env.BSTACK_KEY,
host: 'hub.browserstack.com',
port: 80,

This allows us to pass our browser stack authentication information into our wdio script via the command line.

Next, let’s set up which browsers we wish to test with. This is also done within our wdio config file under the ‘capabilities’ object. Here’s an example:

capabilities: [
{
  browserName: 'chrome',
  os: 'Windows',
  project: 'My Project - Chrome',
  'browserstack.local': false,
},
{
  browserName: 'firefox',
  os: 'Windows',
  project: 'My Project - Firefox',
  'browserstack.local': false,
},
{
  browserName: 'internet explorer',
  browser_version: 11,
  project: 'My Project - IE 11',
  'browserstack.local': false,
},
],

Where to Put the Screens:

While we are here, be sure you have set up your config file to specifically point to where you wish to have your screen shots copied to. The visual-regression service will want to know the paths to 4 types of screenshots it will generate and manage:

lots_a_screens

Yup… Too many screens


References: This directory will contain the reference images the visual-regression service will generate on its initial run. This will be what our subsequent screen shots will be compared against.

Screens: This directory will contain the screen shots generated per browser type/view by tests.

Errors: If a given test fails, an image will be captured of the app at the point of failure and stored here.

Diffs: If there is a given comparison performed by the visual-regression service between an element from a browser execution and the reference images which results in a discrepancy, a ‘heat-map’ image of the difference will be capture and stored here. Consider the content of this directory to be your test exceptions.

Things Get Fuzzy Here:

fozzy

Fuzzy… Not Fozzy


Finally, before kicking off our tests, we need to enable our visual-regression service instance within our wdio.conf.js file. This is done by adding a block of code to our config file that instructs the service on how to behave. Here is an example of the code block taken from the WebdriverIO developer guide:

visualRegression: {
  compare: new VisualRegressionCompare.LocalCompare({
    referenceName: getScreenshotName(path.join(process.cwd(), 'screenshots/reference')),
    screenshotName: getScreenshotName(path.join(process.cwd(), 'screenshots/screen')),
    diffName: getScreenshotName(path.join(process.cwd(), 'screenshots/diff')),
    misMatchTolerance: 0.20,
  }),
  viewportChangePause: 300,
  viewports: [{ width: 320, height: 480 }, { width: 480, height: 320 }, { width: 1024, height: 768 }],
  orientations: ['portrait'],
},

Place this code block within the ‘services’ object in your file and edit it as needed. Pay attention to the following attributes and adjust them based on your testing needs:

‘viewports’:
This is a JSON object that provides width/height pairs to test the application at. This is very handy if you have an app that has specific responsive design constraints. For each pair, the test will be executed per browser – resizing the browser for each set of dimensions.

‘orientations’: This allows you to configure the tests to execute using portrait and/or landscape view if you happen to be testing in a mobile browser (default orientation is portrait).

‘viewportChangePause’: This value pauses the test in milliseconds at each point the service is instructed to change viewport sizes. You may need to throttle this depending on app performance across browsers.

‘mismatchTolerance’: Arguably the most important setting there. This floating-point value defines the ‘fuzzy factor’ which the service will use to determine at what point a visual difference between references and screen shots should fail. The default value of 0.10 indicates that a diff will be generated if a given screen shot differs, per pixel from the reference by 10% or more. The greater the value the greater the tolerance.

Once you’ve finished modifying your config file, lets execute a test.

Running Your Tests:

Provided your config file is set to point to the root of where your test files are located within the project, edit your package.json file and modify the ‘test’ descriptor in the scripts portion of the file.

Set it to the following:

‘./node_modules/.bin/wdio /wdio.desktop.conf.js’

To run your test, from the command line, do the following:

‘BSTACK_USERNAME= BSTACK_KEY= npm run test — –baseUrl=’

Now, just sit back and wait for the test results to roll in. If this is the first time you are executing these tests, the visual-regression service can fail while trying to capture initial references for various browsers via Browserstack. You may need to increase your test’s global timeout initially on the first run or simply re-run your tests in this case.

Reviewing Results:

If you’re used to your standard JUnit or Jest-style test execution output, you won’t necessarily similar test output here.

If there is a functional error present during a test (an object you are attempting to inspect isn’t available on screen) a standard Webdriver-based exception will be generated. However, outside of that, your tests will pass – even if a discrepancy is visually detected.

However, examine your screen shot folder structure we mentioned earlier. Note the number of files that have been generated. Open a few of them to view what has been capture through IE 11 vs. Chrome while testing through Browserstack.

Note that the files have names appended to them descriptive of the browser and viewport dimensions they correspond to.

example1

Example of a screen shot from a specific browser


Make note if the ‘Diff’ directory has been generated. If so, examine its contents. These are your test results – specifically, your test failures.

example2

Example of a diff’ed image


There are plenty of other options to explore with this basic set of tooling we’ve set up here. However, we’re going to pause here and bask in the awesomeness of being able to perform this level of browser testing with just 5-10 lines of code.

Is there More?

This post really just scratches the surface of what you can do with a set of visual regression test tools.  There are many more options to use these tools such as enabling mobile testing, improving error handling and mating this with your build tools and services.

We hope to cover these topics in a bit more depth in a later post.   For now, if you’re looking for additional reading, feel free to check out a few other related posts on visual regression testing here, here and here.

Auditing your Web App for Accessibility with Lighthouse

If you’ve followed our blog for some time, you’ve likely encountered posts detailing how to engage in various kinds of software testing, from performance to data-driven to security and more.

This post continues that trend with a focus on testing your site for accessibility.

What is Accessibility?

All Access Badge


If you are unfamiliar with the concept, accessibility, within the realm of web applications is a term that covers a wide range of concerns. The primary focus is codifying and helping to reinforce design standards that ensure the web is accessible to all – regardless of people’s ability to consume and interact with it.

This is a very large topic and its definition is beyond the scope of this blog post’s intent. If you’re looking for a starting point however, our friends at W3C.org can help you with that: https://www.w3.org/standards/webdesign/accessibility

If you want to cut to the chase, there are two major accessibility standards you should be aware of (and are generally considered the path toward compliance). Both of these are supported and covered by the W3C as international standards and can be reviewed in full here:

You can also visit this link for some related coding examples.

Why Accessibility?

Why should everyone be concerned with accessibility design issues?  The short answer can be found from this quite from Sir Tim Berners-Lee, via the W3C:

“The power of the Web is in its universality.
Access by everyone regardless of disability is an essential aspect.”

A more complex answer is that, as the web reaches more and more global ubiquity, we as software creators need to take into account the range of needs to access the web from all users. This is simply fair play as web technology has matured and become evermore essential to our daily lives. There are also legal ramifications for not taking accessibility into account. Here are some examples:

How Accessible is my Site?

If you’ve closely followed the design principles of WCAG 2.0, then your web application front end should be compliant with most modern accessibility software such as screen readers. However it’s difficult to verify your app’s end-user experience in this regard without actually sitting down with a browser, your app, some third-party tools and applying some old-fashioned manual testing.

The challenge with this – you’re likely already thinking – is that this is time consuming and labor intensive. If you are on a small software team or have a very tight deadline (or both), this level of manual testing might be a hard (but necessary) pill for your product team to swallow.

There are 3rd party services that can perform this level of testing for you. A quick google search can get you started down this path. However, if hiring a 3rd party is either logistically or financially out of reach, there are plenty of software tools that can help take the sting out of accessibility verification.

Chrome is your Friend (Really)?

As of this blog post, Google’s Chrome browser currently accounts for about 1/2 of all worldwide browser usage on the web. Chrome however is not only popular, it also has a lot of helpful tools under the hood to aid in web development.

In fact, you can use your basic, desktop version of Chrome to perform an accessibility audit of a given site you happen to have open in your browser. To try this trick out, simply do the following:

  • Open your browser to a given site you wish to audit
  • Open the Chrome developer tools console
  • Under the developer console tabs, (e.g. Network, Elements, Console, etc.) search for and click on the Audits tab.
  • Click the Perform Audit option, select Accessibility and click Run Audit to begin.

chrome a11y audit screenshot

Look what we found under the hood!


The audit tool in this case will scan the contents of the site at the current URL you have open for markup patterns that support accessibility standards (e.g. proper element naming conventions, css settings, etc.) and flag patterns within the markup on the page that violate these standards. These of course are based on the WCAG and AIRA conventions mentioned at the beginning of this post.

This is a powerful but very easy to access and run set of tools for web developers (you can perform several kinds of audits, not just ones for accessibility). So easy in fact, you might be thinking that there must be a way to program these tools (and you would be right).

Illuminating Accessibility with Lighthouse!

Once you started the audit within Chrome, you might have noticed a message stating that something called Lighthouse was starting up, prior to the audit being executed.

Lighthouse in fact, is the engine that performs the audit. It’s also available as a library dependency or even its own stand-alone project.

Lighthouse can be incorporated into your project front end or build cycle in several ways. One of those is to use the Lighthouse as a standalone analyzation tool which you can use to verify the front end of your web app post deployment (think of this as another set of functional tests with a different, specific kind of output – in this case, an accessibility report.

You can get Lighthouse running locally via command line quickly by doing the following (assuming you have NodeJS installed):

1. Open a new terminal and do, npm install -g lighthouse
2. Once the latest version of lighthouse is installed, do, lighthouse "url of choice" -GA —output html —output-path ./report.html

Once the above command executes and finishes, you can open your Lighthouse report.html locally in your web browser:

Lighthouse Report

Lighthouse Report


Drill down into the different segments of the report to see what best practices you are following for accessibilityy (or performance, SEO or other web standards) and where you should target to improve your app.

Jenkins Configuration

Jenkins configuration for Lighthouse


To include this report within your CI build process, just add the above Node command line statements to a shell script attached to your job of choice and make sure to archive the results (if configuring this in a Jenkins task, your job config will probably look something like this:)

Accessibility Linting?

By default, the report Lighthouse provides is expansive and may take a while to read through.

Fortunately, there are several options to move this form of testing further upstream. In this case, we are going to look at a small, open source project called Lightcrawler.

Lightcrawler allows you to call specific audit aspects of Lighthouse from within your NodeJS project. The benefit of doing this is that you can more specifically target what you are auditing and perform said audits before you ship your project through to the rest of your CI process.

You can install Lightcrawler into your project by simply doing npm install —save-dev lightcrawler.

Next, given your Node app is configured with a script that will generate and run the app locally, simply add this to your “scripts” portion of your app’s package.json file:

”audit:a11y”: "./node_modules/.bin/lightcrawler --url=http://localhost:8080 --config lighthouse-config.json",

With Lightcrawler you can configure an accessibility audit in a variety of ways that can meet your project needs. For the purpose of this post, we will configure Lightcrawler to run only tests classified within an accessibility audit, and to run all tests of that type currently available. Here is our configuration file:

{
  "extends": "lighthouse:default",
  "settings": {
    "crawler": {
      "maxDepth": 1,
      "maxChromeInstances": 5
    },
    "onlyCategories": [
      "Accessibility"
    ],
    "onlyAudits": [
      "accesskeys",
      "aria-allowed-attr",
      "aria-required-attr",
      "aria-required-parent",
      "aria-required-childres",
      "aria-roles",
      "aria-valid-attr-value",
      "audio-caption",
      "button-name",
      "bypass",
      "color-contrast",
      "definition-list",
      "dlitem",
      "document-title",
      "duplicate-id",
      "frame-title",
      "html-has-lang",
      "html-lang-valid",
      "image-alt",
      "input-image-alt",
      "lable",
      "layout-table",
      "link-name",
      "list",
      "list-item",
      "meta-refresh",
      "meta-viewport",
      "object-alt",
      "tabindex",
      "td-headers-attr",
      "th-has-data-cells",
      "valid-lang",
      "video-caption",
      "video-description"
    ]
  }
}

You can copy the JSON above and save it as lightcrawler.conf.js within your project directory and direct your script to the config file’s path.

Test out your newly added audit script but running npm run audit:a11y. If everything is in working order, you should receive a command line output detailing the number of audits executed by Lightcrawler and error output for any given audit tests that may have failed (and more importantly, why).

Lightcrawler Console Output

Lightcrawler Console Output


This may look similar to linting report output from something like Prettier or ESLint.  Similar to the way Prettier or ESLint are used in pre-commit hooks within your project, you could add a Lightcrawler script to your pre-commit hook in order to better safeguard your application code from possible accessibility violations.

Beyond Auditing and Linting!

This should give you some ideas as to how you can reduce the overall effort required to deliver your apps’ web front end while still maintaining accessibility.  By no means are the handful of tips presented here deep enough to fully cover everything under the accessibility umbrella.  That task will require significant time and effort but, in keeping with the web’s initial intent of inclusivity and connectivity, one we as software developers should strive toward.

Getting Started with Dependency Security and NodeJS

Internet security is a topic that receives more attention every day.  If you’re reading this article in early 2018, issues like Meltdown, Specter and the Equifax breach are no doubt fresh in your mind.

Cybersecurity is a massive concern and can seem overwhelming.  Where do you start?  Where do you go?  What do you do if you’re a small application team with limited resources?  How can you better engineer your projects with security in mind?

Tackling the full gestalt of this topic, including OWASP and more is beyond the scope of this article. However, if you’re involved in a small front end team, and if you leverage services like AWS, have gone through the OWASP checklist and are wondering, ‘what now?’, this article is for you (especially if you are developing in NodeJS, which we’ll focus on in this article).

Let’s Talk About Co(de) Dependency:

A tiger and her baby pigs

We’re talking about claiming dependents right?


One way we can quickly impact the security of our applications is through better dependency management.  Whether you develop in Python, JavaScript, Ruby or even compiled languages like Java and C#, library packages and modules are part of your workflow.

Sure, it’s 3rd party code but that doesn’t mean it can’t have a major impact on your project (everyone should remember the Leftpad ordeal from just a few years ago).

As it turns out, your app’s dependencies can be your app’s greatest vulnerability.

Managing Code you Didn’t Write:

Below, we’ll outline some steps you can take to tackle at least one facet of secure development – dependency management.  In this article, we’ll cover how you can implement a handful of useful tools into a standard NodeJS project to protect, remediate and warn against potential security issues you may introduced into your application via its dependency stack.

Your code has issues

We’ve all had to deal with other people’s problematic code at one time or another


Using Dependency-Check:

Even if you’re not using NodeJS, if you are building any project that inherits one or more libraries, you should have some form of dependency checking in place for that project.

For NodeJS apps, Dependency-Check is the easiest, lowest-hanging fruit you can likely reach for to better secure your development process.

Dependency-Check is a command-line tool that can scan your project and warn you of any modules being included in your app’s manifest but not actually being utilized in any functioning code (e.g. modules listed in your package.json file but never ‘required’ in any class within your app).  After all, why import code that you do not require?

Installation is a snap.  From your project directory you can:

Npm install –g dependency-check

dependency-check package.json –unused

If you have any unused packages, Dependency-Check will warn you via a notice such as:

Fail! Modules in package.json not used in code: chai, chai-http, mocha

Armed with a list of any unused packages in hand, you can prune your application before pushing it to production.  This tool can be triggered within your CI process per commit to master or even incorporated into your project’s pre-commit hooks to scan your applications further upstream.

RetireJS:

‘What you require, you must retire’ as the saying goes – at least as it does when it comes to RetireJS.  Retire is a suite of tools that can be used for a variety of application types to help identify dependencies your app has incorporated that have known security vulnerabilities.

Retire is suited for JavaScript based projects in general, not just the NodeJS framework.

For the purpose of this article, and since we are dealing primarily with the command line, we’ll be working with the CLI portion of Retire.

npm install -g retire

then from the root of your project just do:

retire 

If you are scanning a NodeJS project’s dependencies only, you can narrow the scan by using the following arguments:

retire  —nopdepath 

By default, the tool will return something like the following, provided you have vulnerabilities RetireJS can identify:

ICanHandlebarz/test/jquery-1.4.4.min.js 
↳ jquery 1.4.4.min has known vulnerabilities: 
http://web.nvd.nist.gov/view/vuln/detail?vulnId=CVE-2011-4969 
http://research.insecurelabs.org/jquery/test/ 
&lt;a href="http://bugs.jquery.com/ticket/11290"&gt;
http://bugs.jquery.com/ticket/11290</a>

Retire scans your app and compares packages used within it with an updated online database of packages/package versions that have been identified by the security world as having exploitable code.

Note the scan output above identified that the version of jquery we have imported via the ICanHandlebarz module has a bug that is exploitable by hackers (note the link to CVE-2011-4969 – the exploit in question).

Armed with this list, we can identify any unnecessary dependencies within our app, as well as any exploits that could be utilized given the code we are currently importing and using.

NSP:

There are a multitude of package scanning utilities for NodeJS apps out on the web. Among them, NSP (Node Security Platform) is arguably the most popular.

Where the previously covered Retire is a dependency scanner suited for JavaScript projects in general, NSP, as the name implies, is specifically designed for Node applications.

The premise is identical: this command line tool can scan your project’s package manifest and identify any commonly known web exploits that can be leveraged given the 3rd party packages you have included in your app.

Utilizing NSP and Retire may sound redundant but, much like a diagnosing a serious condition via medical professional, it’s often worth seeking a second opinion.  It’s also equally easy to get up and running with NSP:

npm install -g nsp

nsp check —reporter &lt;Report type (e.g. HTML)&gt;

Running the above within the root of your node application will generate a report in your chosen output format

Again, wiring this up into a CI job should be straightforward.  You can even perform back-to-back scans using both Retire and NSP.

Snyk:

Yes, this is yet another dependency scanner – and like NSP, another one that specifically NodeJS oriented but with an added twist: Snyk.

Snyk home page

Snyk home page


With Retire and NSP, we can quickly and freely generate a list of vulnerabilities our app is capable of having leveraged against it.  However, what of remediation?  What if you have a massive Node project that you may not be able to patch or collate dependency issues on quickly?  This is where Snyk comes in handy.

Snyk can generate detailed and presentable reports (perfect for team members who may not be elbow deep in your project’s code).  The service also provides other features such as automated email notifications and monitoring for your app’s dependency issues.

Typical Snyk report

Typical Snyk report


Cost: Now, these features sound great (they also sound expensive).  Snyk is a free service, depending on your app’s size.  For small projects or open source apps, Snyk is essentially free.  For teams with larger needs, you will want to consult their current pricing.

To install and get running with Snyk, first visit https://snyk.io and register for a user account (if you have a private or open source project in github or bitbucket, you’ll want to register your Snyk account with your code management tool’s account.

Next, from your project root in the command line console:

npm install -g snyk

snyk –auth

Read through the console prompt.  Once you receive a success message, your project is now ready to report to your Snyk account.  Next:

Snyk test

Once Snyk is finished you will be presented with a URL will direct you to a report containing all vulnerable dependency information Snyk was able to find regarding your project.

The report is handy in that it not only identifies vulnerabilities and the packages they’re associated with but also steps for remediation (e.g. – update a given package to a specific version, remove it, etc.).

Snyk has a few more tricks up its sleeve as well.  If you wish to dive headlong into securing your application. Simply run:

Snyk wizard

This will rescan your application in an interactive wizard mode that will walk you through each vulnerable package and prompt you for actions to take for each vulnerable package.

Note, it is not recommended to use Snyk’s wizard mode when dealing with large scale applications due to it being very time consuming.

It will look like this:

Snyk monitor output

Snyk monitor output


Additionally, you can utilize Snyk’s monitoring feature which, in addition to scanning your application, will send email notifications to you or your team when there are updates to vulnerable packages associated with your project.

Putting it all together in CI:

Of course we’re going to arrange these tools into some form a CI instance.  And why not?  Given we have a series of easy-to-implement command line tools, adding these to part of our project’s build process should be straight forward.

Below is an example of a shell script we added as a build step in a Jenkins job to install and run each of these scan tools as well as output some of their responses to artifacts our job can archive:

#Installs our tools
npm install -g snyk
npm install -g dependency-check
npm install -g retire

#Runs dependency-check and outputs results to a text file
dependency-check ./package.json >> depcheck_results.txt

#Runs retire and outputs results to a text file
retire --nodepath node_modules >> retire_results.txt

#Authenticates use with Snyk
snyk auth $SNYK_TOKEN 

#Runs Snyk's monitor task and outputs results to a test file 
snyk monitor >> snyk_raw_monitor.txt

#Uses printf, grep and cut CLI tools to retrieve the Snyk report URL
#and saves that URL to a text file
printf http: >> snykurl.txt
grep https snyk_raw_monitor.txt | cut -d ":" -f 2 >> snykurl.txt
cat snykurl.txt

#Don't forget the set your post-job task in your CI service to save the above .txt
#files as artifacts for our security check run.

Note – depending on how you stage your application’s build lifecycle in your CI service, you may want to break the above script up into separate scripts within the job or separate jobs entirely. For example, you may want to scan your app using Dependency-Check for every commit but save your scan of your application using NSP or Snyk for only when the application is built nightly or deployed to your staging environment.  In which case, you can divide this script accordingly.

Note on Snyk:

In order to use Snyk in your CI instance, you will need to reference your Snyk authentication key when executing this tool (see the API key reference in the script).

This key can be passed as a static string to the job.  Your auth key for Snyk can be obtained by logging in at Snyk.io and retrieving your API key from the account settings page after clicking on the My Account link from Snyk’s main menu.

Next Steps:

This is only the tip of the iceberg when it comes to security and web application development.  Hopefully, this article has given you some ideas and hits of where to start in writing more secure software.  For more info on how to secure your Node-based apps, here’s some additional reading to check out:

Testing for Application Front End Performance with Web Page Test

taco-meter

‘Taco-meter’ – a device used to measure how quickly you can obtain tacos from your current location

If you’ve followed Bazaarvoice’s R&D blog, you’ve probably read some of our posts on web application performance testing with tools like Jmeter here and here.

In this post, we’ll continue our dive into web app performance, this time, focusing on testing front end applications.

API Response Time vs App Usability:

Application UI testing in general can be challenging as the cost of doing so (in terms of both time, labor and money) can become quite expensive.

In our previous posts highlighted above, we touched on testing RESTful APIs – which revolves around sending a set of requests to a target, measuring their response times and checking for errors.

For front-end testing, you could do the same – automate requesting the application’s front-end resources and then measuring their collective response times.  However, there are additional considerations for front end testing that we must account for – such as cross-browser issues, line speed constraints (i.e. broadband vs. a mobile 3G) as well as client side loading and execution (especially important for JavaScript).

Tools like Jmeter can address some of these concerns, though you may be limited in what can be measured.  Plugins for Jmeter that allow Webdriver API access exist but can be difficult to configure, especially in a CI environment (read through these threads from Stack Overflow on getting headless Webdriver to work in Jenkins for example).

There are 3rd party services available that are specialized for UI-focused load tests (e.g. Blazemeter) but these options can sometimes be expensive.  This may be too much for some teams in terms of time and money – especially if you’re looking for a solution for introductory, exploratory testing as opposed to something larger in scale.

Webpagetest.org:

Webpagetest.org is an open source project backed by multiple partners such as Google, Akamai and Fastly, among others.  You can check out the project’s github page here.

Webpagetest.org is a publicly available service.  Its main goal is to provide performance information for web applications, allowing designers and engineers to measure and improve application speed.

Let’s check out Webpagetest.org’s public facing page – note the URL form field.  We can try out the service’s basic reporting features by pasting the URL of a website or application into the field and submitting the form.  In this case, let’s test the performance of Bazaarvoice’s home page.

Before submitting the form however, note some of the additional options made available to us:

  • Browser type
  • Location
  • Number of tests
  • Connection

webpagetest.org form

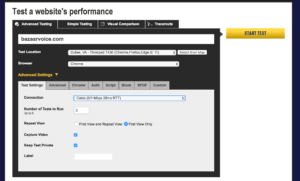
Webpagetest.org’s initial submission form

This service allows us to configure our tests to simulate user requests from a slow, mobile, 3G device in the US to a desktop client with a fiber optic connection in Singapore (just to name a few).

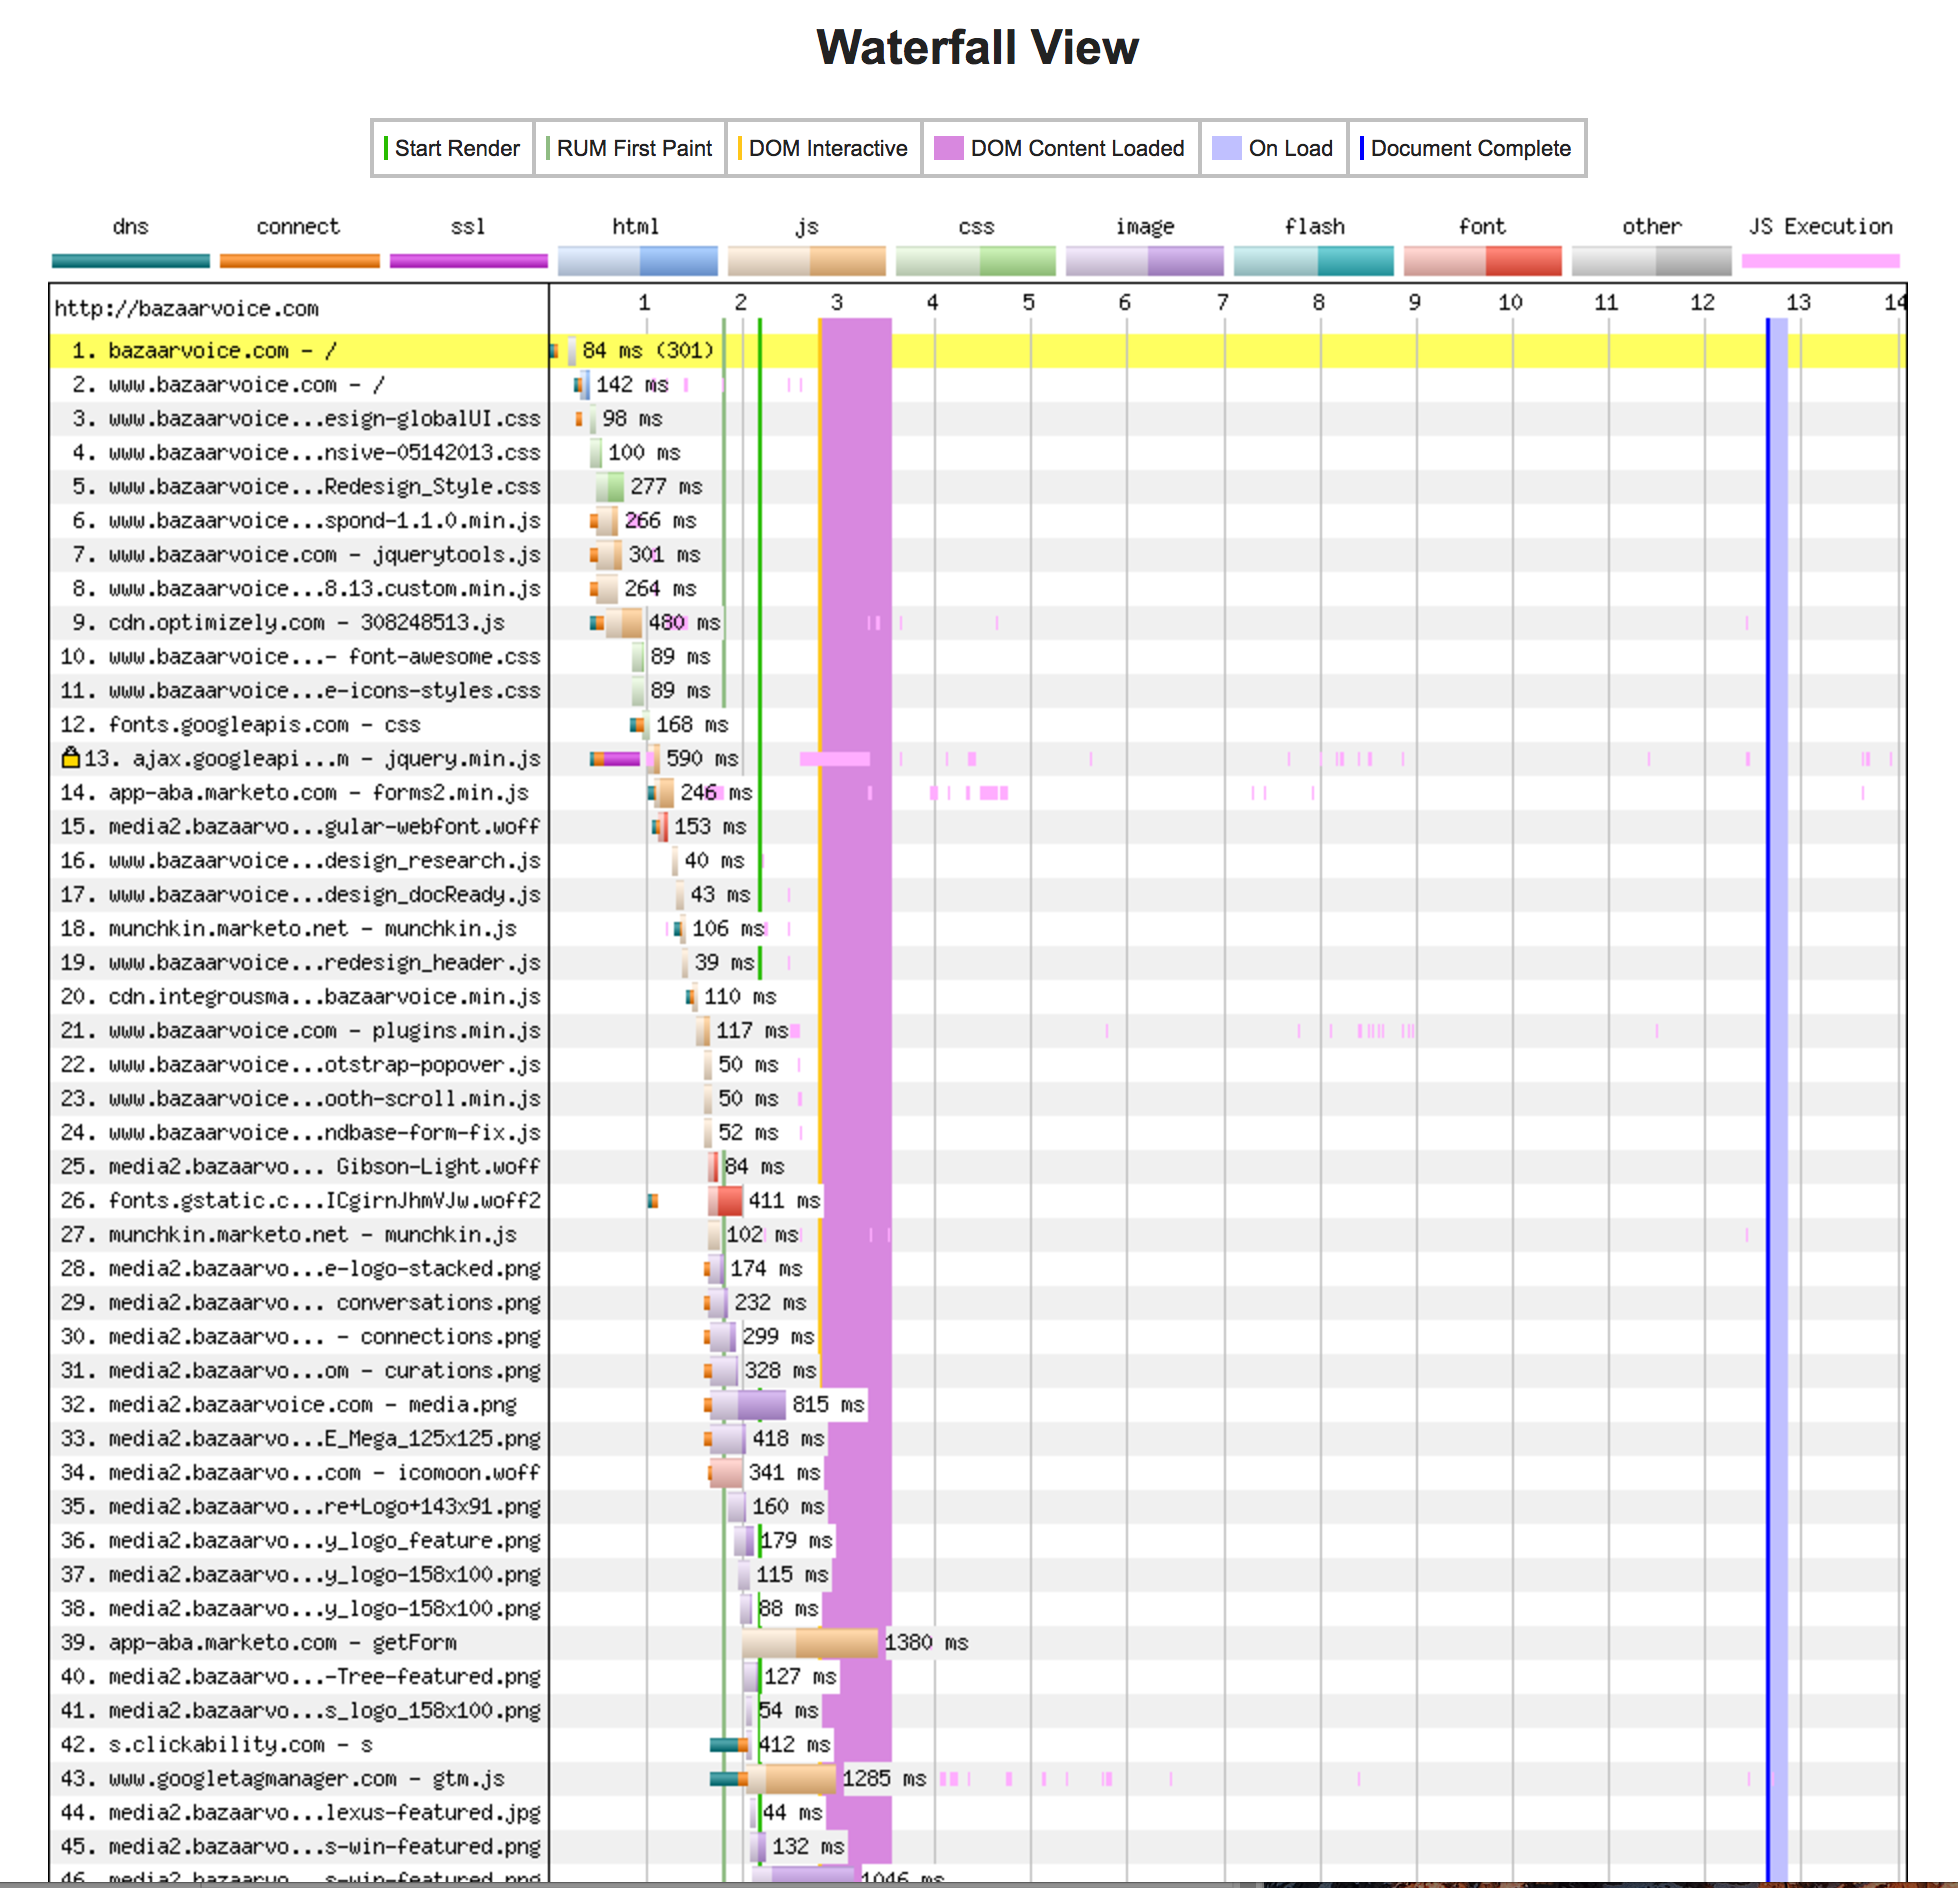
Go ahead and submit the test form.  Once the test resolves, you’ll first notice the waterfall snapshot Webpagetest.org returns.  This is a reading of the application’s resources (images, JavaScript execution, external API calls, the works).  It should look very familiar if you have debugged a web site using a browser’s developer tools console.

webpagetest waterfall

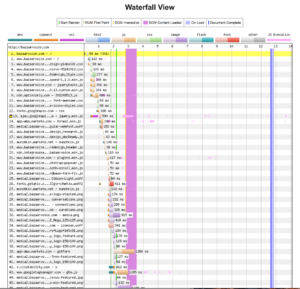
Webpagetest.org’s waterfall report

This waterfall readout gives us a visual timeline of all the assets our web page must load for it to be active for the end user, in the order they are loaded, while recording the time taken to load and/or execute each element.

From here, we can determine which resources which have the longest load times, the largest physical foot prints and give us a clue as to how we might better optimize the application or web page.

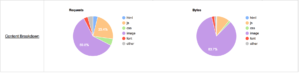
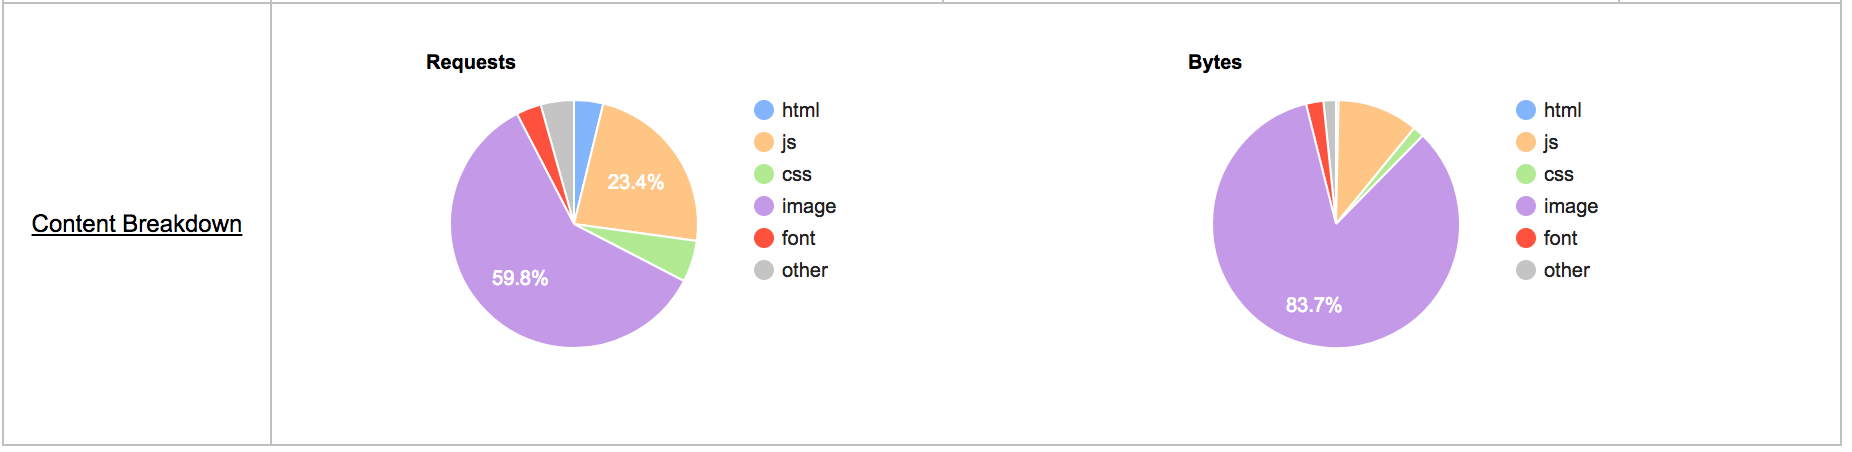
Webpagetest.org’s content breakdown chart

In addition to our waterfall chart, our test results can provide any more data points, including but not limited to:

  • Content breakdown by asset type
  • CPU utilization
  • Bandwidth utilization
  • Screen shots and video capture of page load

Armed with this information from our test execution, you can begin to see where we might decide to make adjustment to our site to increase client-side performance.

Getting Programmatic:

Webpagetest.org’s web UI provides some great, easy-to-use features.  However, we can automated these tests using Webpagetest.org’s API.

In our next couple of steps, we’ll demonstrate how to do just that using Jenkins, some command line tools and Webpagetest.org’s public API, which you can read more about here.

Before Going Forward:

There are a few limitations or considerations regarding using Webpagetest.org and its API:

  • All test results are publicly viewable
  • API usage requires you to submit an email address to generate an API key
  • API requests are limited to 200 test runs per day
  • The maximum number of concurrent test runs allowed is 9

If test result confidentiality or scalability is a major concern, you may want to skip to the end of this article where we discuss using private instances of Webpagetest.org’s service.

Requirements:

 As mentioned above, we need an API key from Webpagetest.org. Just visit https://www.webpagetest.org/getkey.php and submit the form made available there.  You’ll then receive an email containing your API key.

Once you have your API key – lets set up a test using as CI service.  For this, like in our other test tutorials, we’ll be using Jenkins.

For this walkthrough, we’ll use the following:

  • Webpagetest’s public API
  • Jenkins
  • NodeJS (be sure your Jenkins instance has at least 1 server capable of using NodeJS 6 or above)
  • Webpagetest (a node module that provides a command-line wrapper for their API)
  • Jq-cli (a node module that provides JQ – a JSON query tool)
  • Wget-improved (a node implementation of the wget CLI tool – skip this if your Jenkins servers already have this binary installed).

Setting Up the Initial Job:

First, let’s get the Jenkins job up and running and make sure we can use it to reach our primary testing tool.

Do the following:

  • Log into Jenkins
  • Navigate to a project folder you wish your job to reside in
  • Click New Item
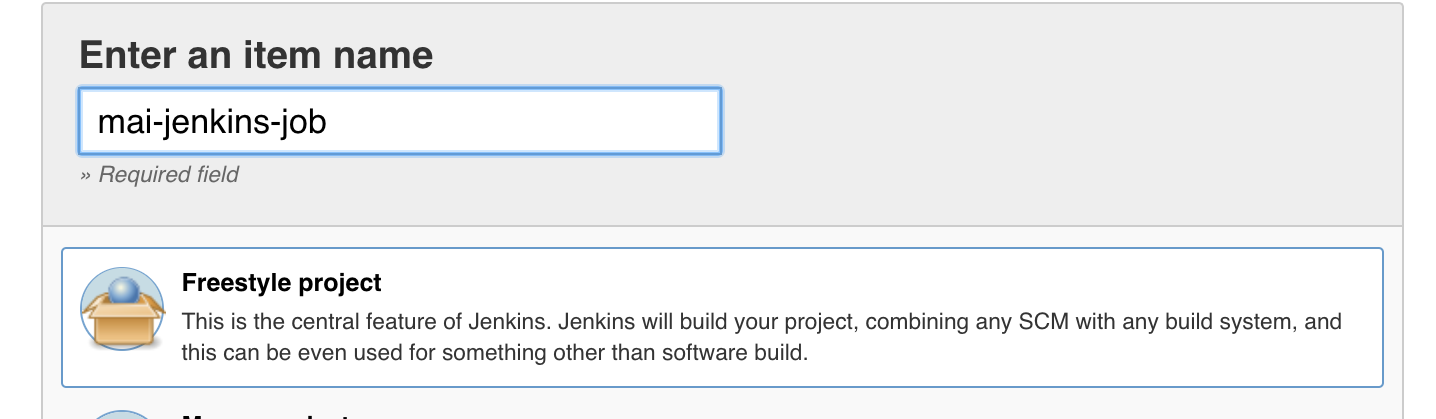
  • Give the job a name, select Freestyle Project from the menu and click OK

Now that the job is created, let’s set a few basic parameters:

  • Check ‘Discard old builds’
  • Set the Max # of Builds value to 100
  • Check the ‘Provide Node & npm bin/ folder to PATH’ option then choose your desired Node version (if this option is unavailable, see your system administrator).

jenkins-node

Specifying a NodeJs version for Jenkins to use

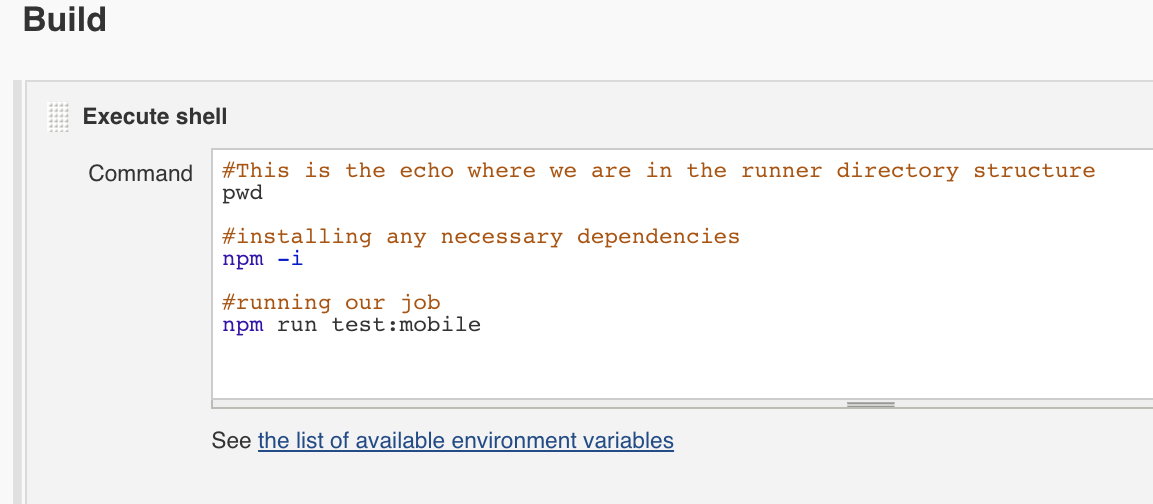
Next, let’s create a temporary build step to verify our job can reach Webpagetest.org

  • Click the ‘Add Build Step’ menu button
  • Select ‘Execute shell’
  • In the text box that appears, past in the following Curl command:
    •  curl http://webpagetest.org -s –f 
  • Save changes to your job and click the build option on the main job settings screen

Once the job has executed, click on the build icon and select the console output option.  Review the console output captured by Jenkins.  If you see HTML output captured at the end of the job, congratulations, your Jenkins instance can talk to Webpagetest.org (and its API).

Now we are ready to configure our actual job.

The Task at Hand:  

 The next steps will walk you through creating a test script.  The purpose of this script is as follows:

  • Install a few command line tools in our Jenkins instance when executed
  • Use these tools to execute a test using Webpagetest.org’s API
  • Determine when our test execution is complete
  • Collect and preserve our results in the following manner:
    • HAR (HTTP Archive)The entire test result data in JSON format
    • A PNG of our application’s waterfall
  • Filter our results for a specific element’s statistic we wish to know about

Adding Tools:

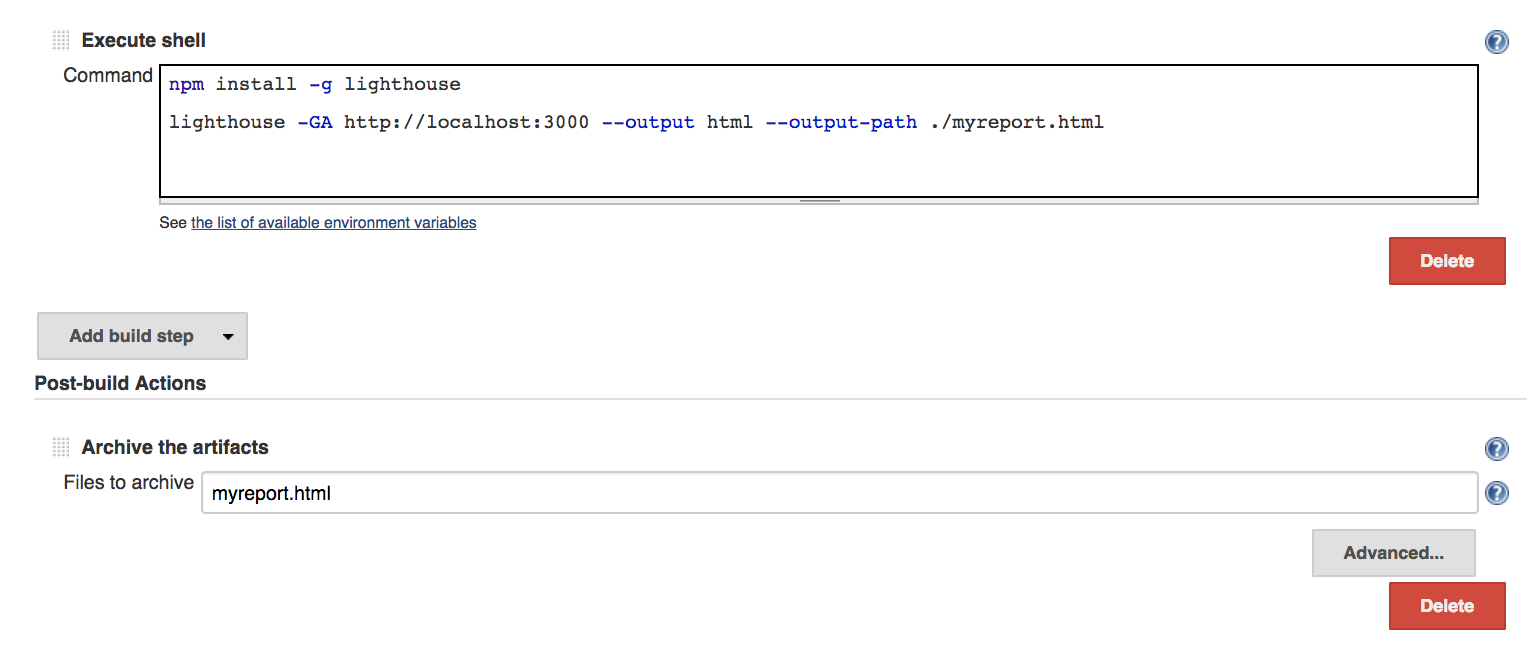
Click on the configure link for your job and scroll to the shell execution window.  Remove your curl command and copy the following into the window:

npm install -g webpagetest
npm install -g jq-cli-wrapper
npm install -g wget-improved

If you know that your Jenkins environments comes deployed with wget already installed, you can skip the last npm install command above.

Once this portion of the script executes, we’ll now have a command line tool to execute tests against Webpagetest’s API.  This wrapper makes it somewhat easier to work with the API, reducing the amount of syntax we’ll need for this script.

Next in our script, we can declare this command that will kick off our test:

webpagetest test $SITE -k $APIKEY -r $RUNS &gt; test_exec.json
&lt;span style="font-size: 1rem;"&gt;testId=$(cat test_exec.json | jq .data.testId)
&lt;/span&gt;testId="${testId%\"}"
testId="${testId#\"}"
echo $testId

This script block calls the API, passing it some variables (which we’ll get to in a minute) then saves the results to a JSON file.

Next, we use the command line tools cat and jq to sort our response file, assigning the testId key value from that file to a shell variable.  We then use some string manipulation to get rid of a few extraneous quotation marks in our variable.

Finally, we print the testId variable’s contents to the Jenkins console log.  The testId variable in this case should now be set to a unique string ID assigned to our test case by the API.  All future API requests for this test will require this ID.

Adding Parameters:

Before we go further, let’s address the 3 variables we mentioned above.  Using shell variables in the confines of the Jenkins task will give us a bit more flexibility in how we can execute our tests.  To finish setting this part up, do the following:

  • In the job configuration screen, scroll to and check the ‘This build is parameterized’ option.
  • From the dropdown menu, select String Parameter
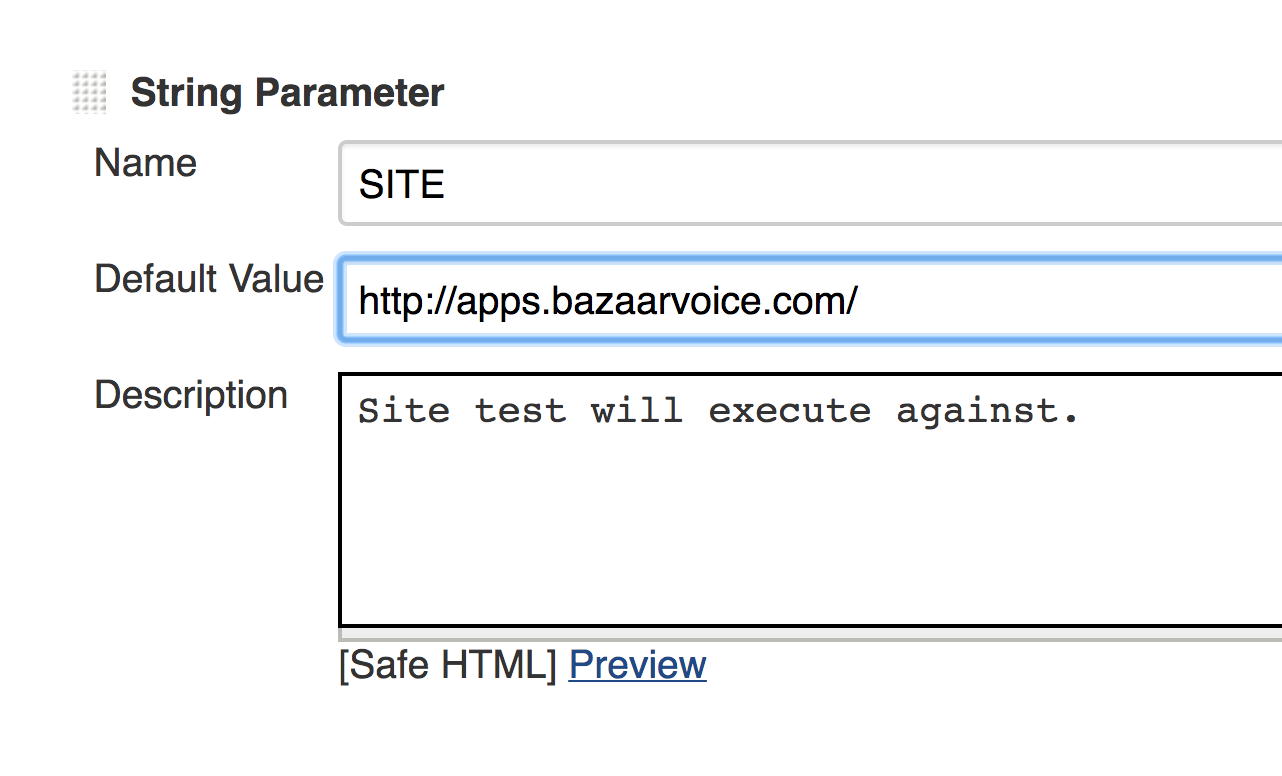
  • In the name field, enter SITE
  • For the default field, enter a URL you wish to test (e.g. http://www.bazaarvoice.com)
  • Repeat this process for the APIKEY and RUNS variables
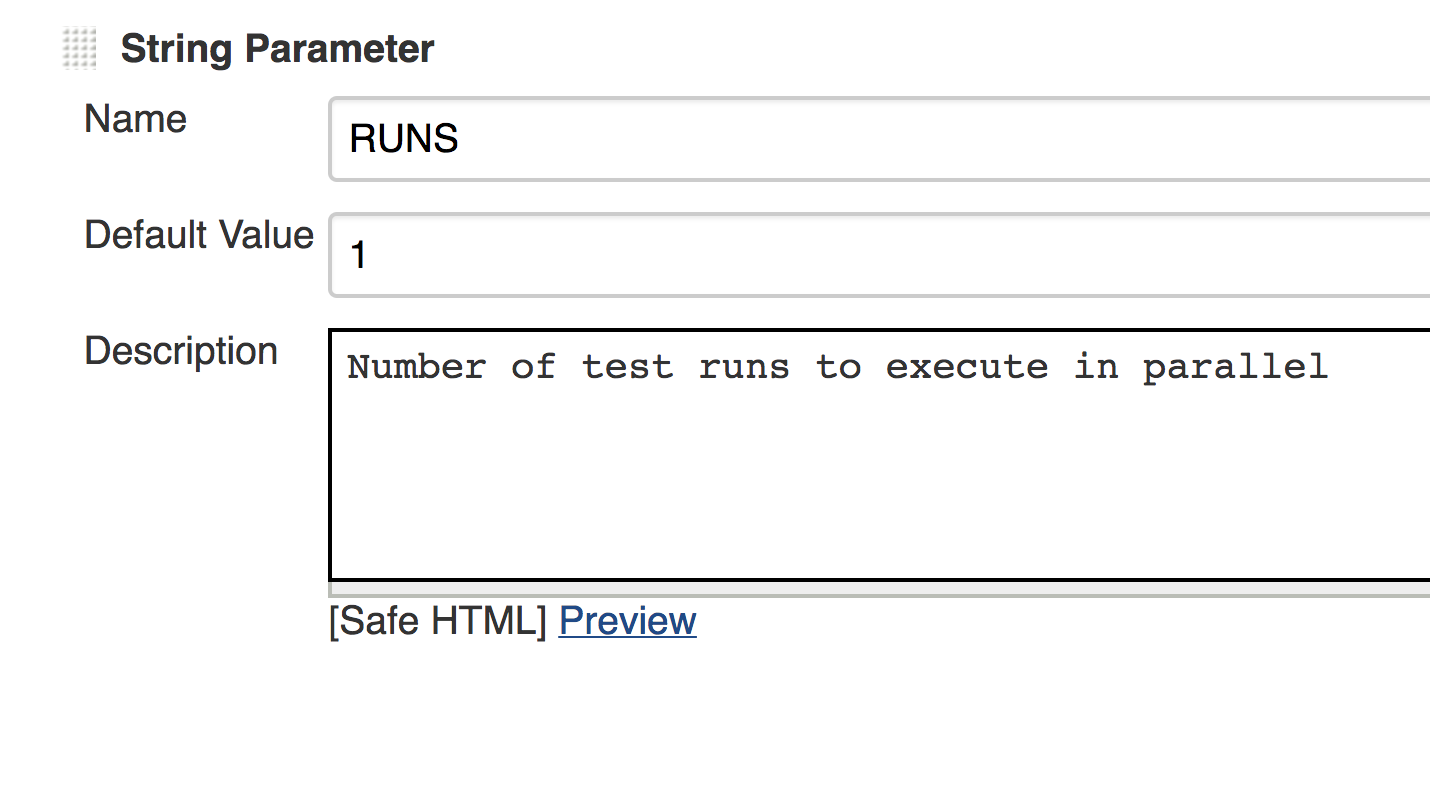
  • Set the RUNS parameter to a value of 1
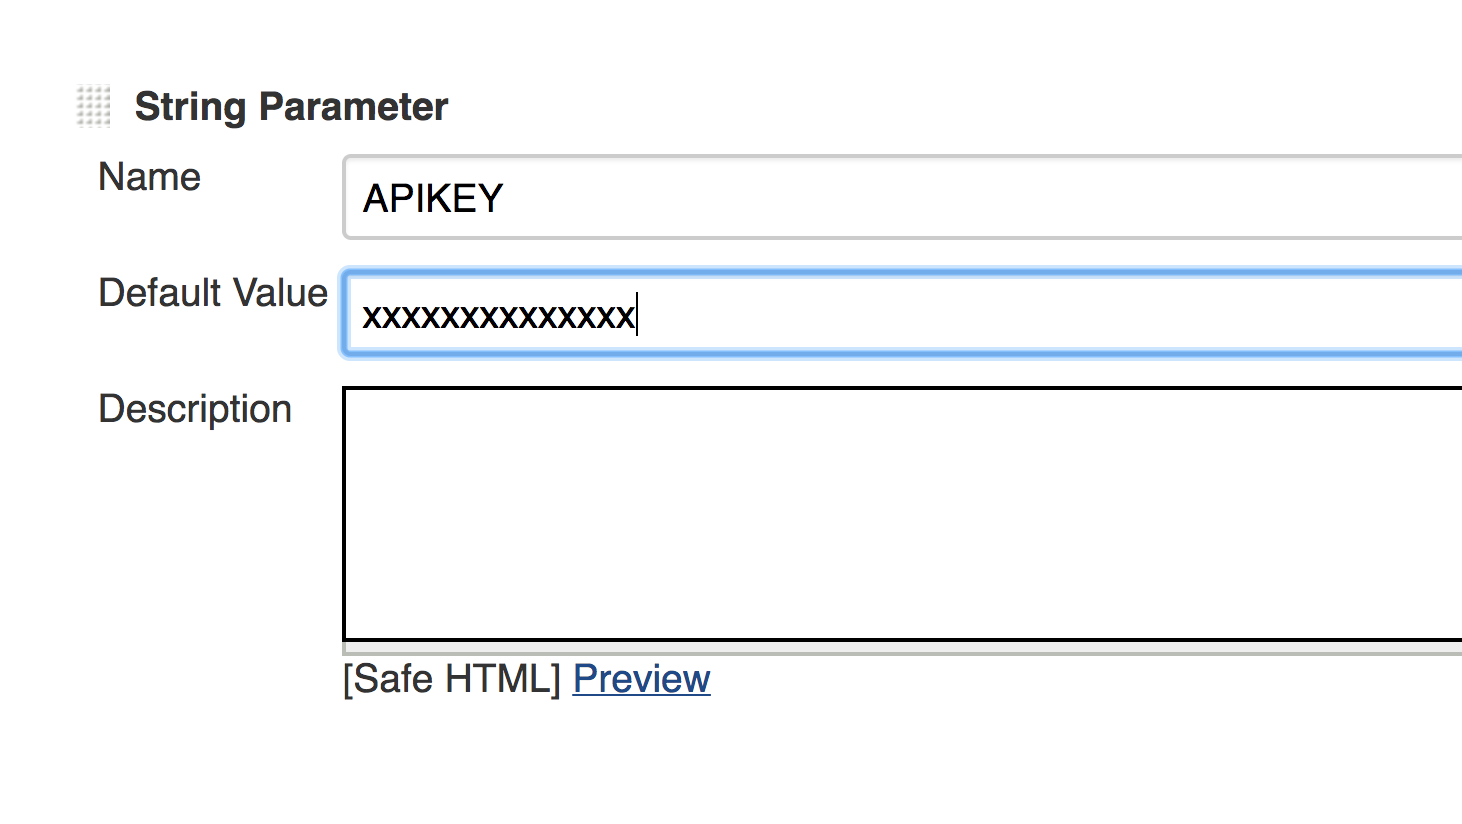
  • Set the default value for the APIKEY parameter to your Webpagetest.org API key.

Save changes to your job and try running it.  See if it passes.  If you view the console output form the run, there’s probably not much you’ll find useful.  We have more work to do.

site-parameter

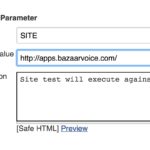
Your site parameter should look like this

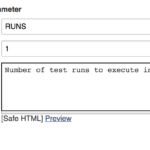
Your runs parameter should look like this

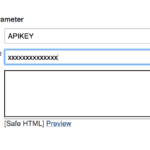
And your key parameter should looks like this

Waiting in Line:

The next portion of our script is probably the trickiest part of this exercise.  When executing a test with the Webpagetest.org web form, you probably noticed that as your test run executes, your test is placed into a queue.

waiting

Cue the Jeopardy! theme…

Depending current API usage, we won’t be able to tell how long we may be waiting in line for our test execution to finish.  Nor will we know exactly how long a given test will take.

To account for that, next we’ll have to modify our script to poll the API for our test’s status until our test is complete.  Luckily, Webpagetest.org’s API provides a ‘status’ endpoint we can utilize for this.

Add this to your script:

webpagetest status $testId -o status.json
testStatus=$(cat status.json | jq .data.testsCompleted)

Using our API wrapper for webpage test and jq, we’re posting a request to the API’s status endpoint, with our test ID variable passed as an argument.  The response then is saved to the file, status.json.

Next, we use cat and jq to filter the content of status.json, returning the contents of the ‘testsCompleted’ (which is a child of the ‘data’ node) within that file.  This gets assigned to a new variable – testStatus.

Still Waiting in Line:


long line

Just like going to the DMV

The response returned when polling the status endpoint contains a key called ‘status’ with possible values set to ‘In progress’ or ‘Completed’.  This seems like the perfect argument we would want to check to monitor our test status.However, in practice, this key-value pair can be set prematurely – returning a value of ‘Completed’ when not necessarily every run within our test set has finished.  This can result in our script attempting to retrieve an unfinished test result – which would be partial or empty.

After some trial and error, it turns out that reading the ‘testsCompleted’ key from the status response is a more accurate read as to the status of our tests.  This key contains an integer value equal to the number of test runs you specified that have completed execution.

Add this to your script:

while [ "$testStatus" != "$RUNS" ]
do
sleep 10
webpagetest status $testId -o status.json
testStatus=$(cat status.json | jq .data.testsCompleted)
done

This loop compares the number of tests completed with the number of runs we specified via our Jenkins string variable, $RUNS.

While those two variables are not equal, we request our test’s status, overwrite the status.json file with our new response, filter that file again with jq and assign our updated ‘testsCompleted’ value to our shell variable.

Note that the 10 second sleep command within the loop is optional.  We added that as to not overload the API with requests every second for our test’s status.

Once the condition is met, we know that the number of tests runs we requested should be the same number completed. We can now move on.

Getting The Big Report:

Once we have passed our while loop, we can assume that our test has completed.  Now we simply need to retrieve our results:

webpagetest har $testId -o results.har

webpagetest results $testId -o results.json

Webpagetest’s API provides multiple options to retrieve result information for any given test.  In this case, we are asking the API to give us the test results via HAR format.

Note – if you wish to deliver your test results in HAR format, you will need a 3rd party application or service to view .har files.  There are several options available including stand-alone applications such as Charles Proxy and Har Viewer.

Additionally, we are going to retrieve the test results from our run using the API’s results endpoint and assign this to a JSON file – results.json.

Now would be a great time to save the changes we’ve made to your test.

Getting the Big Picture:

Next, we want to retrieve the web application’s waterfall image – similar to what was returned when executing our test via the Webpagetest.org web UI.

To do so, add this to your script:

waterfallImage=$(cat results.json | jq '.data.runs."1".firstView'.images.waterfall)
waterfallImage="${waterfallImage%\"}"
waterfallImage="${waterfallImage#\"}"
nwget $waterfallImage -O waterfall.png

Since we’ve already retrieved our test results and saved them to the results.json file, we simply need to filter this file for a key-value pair that contains the URL for where our waterfall snapshot resides online.

In the results.json file, the main parent that contains all test run information is the ‘data’ node.  Within that node, our results are divided up amongst each test run.  Here we will further filter our results.json object based on the 1st test run.

Within that test run’s ‘firstView’ node, we have an images node that contains our waterfall image.

We then assign the value of that node to another shell variable (and then use some string manipulation to trim off some unnecessary leading and ending quotation characters).

Finally, as we installed the nwget module at the beginning of this script, we invoke it, passing the URL of our waterfall image as an argument and the option to output the result to a PNG file.
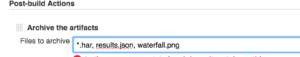
Archiving Results:

Upon each execution, we wish to save our results files so that we can build a collection of historical data as we continue to build and test our application.  Doing this within Jenkins is easy

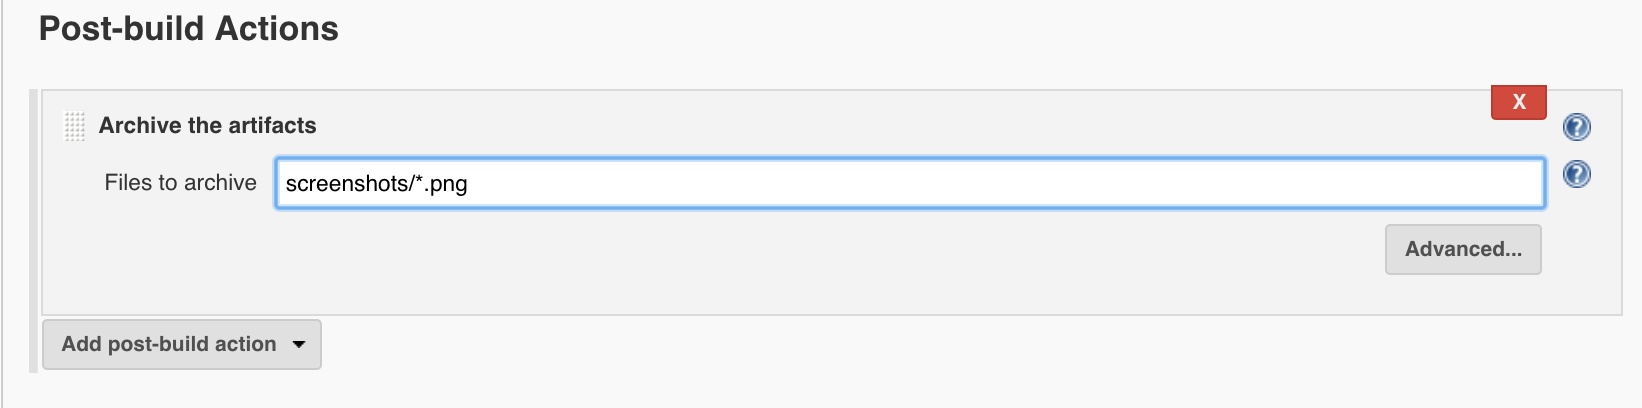
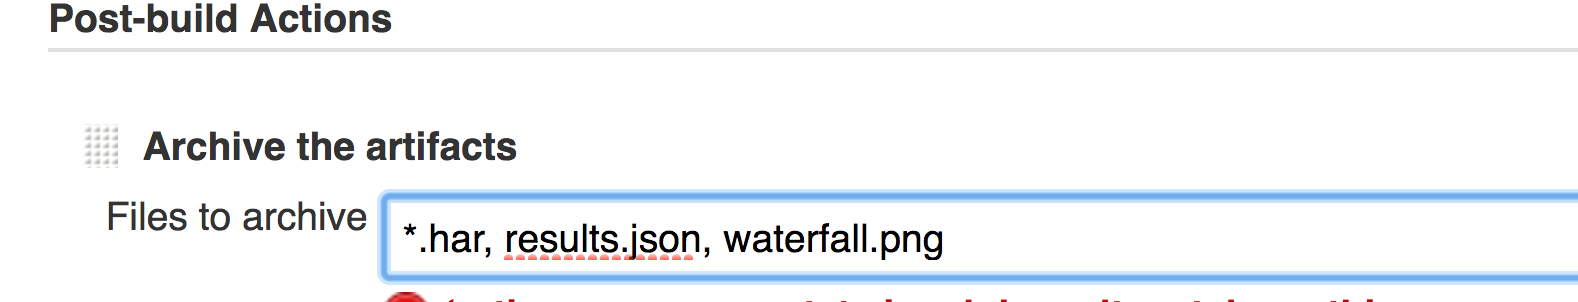
Just click on the ‘Add Post Build Action’ button within the Jenkins job configuration menu and select ‘Archive the artifacts’ from the menu.

In the text field provided for this new step, enter ‘*.har, results.json, waterfall.png’ and click save.

Now, when you run your test job – once the script succeeds, it will save each instance of our retrieved HAR, waterfall image and results.json file to each respective Jenkins run.

Once you save your job configuration, click the ‘Build with Parameters’ button and try running it.  Your artifacts should be appended to each job run once it completes.

results

Collecting your results in Jenkins

Like a Key-Value Pair in a JSON Haystack:

Next, we’re going to talk about result filtering.  The results.json provided initially by the API is exhaustive in size.  Go ahead and scroll through that file saved from your last successful test run (you will probably be scrolling for a while).  There’s a mountain of data there but let’s see if we can fish some information out of the pile.

The next JSON-relative trick we’re going to show you is how you can filter the results.json from Webpagetest.org down to a specific object you wish to measure statistics for.

The structure of the results.json lists every web element (from .js libraries to images, to .css files) called during the test and enumerates some statistics about it (e.g. time to load, size, etc.).  What if your goal is to monitor and measure statistics about a very specific element within your application (say, a custom .js library you ship with your app)?

needle-in-a-haystack

That’s one way of finding it…

For that purpose, we’ll use cat and js again to filter our results down to one, specific file/element’s results.  Try adding something like this to your script:

cat results.json | jq '.data.runs."1".firstView.requests[] | select(.url | contains(" <a unique identifying string for your web element> "))' > stats.json

This is similar to how we filtered our results to obtain our waterfall image above.  In this case, each test result from Webpagetest.org contains a JSON array called ‘requests’.  Each item in the array is delineated by the URL for each relative web element.

Our script command above parses the contests of results.json, pulling the ‘results’ array out of the initial test run, then filtering that array based on the ‘url’ key, provided that key matches the string we provided to jq’s ‘contains’ method.

These filtered results are then output to the stats.json file.  This file will contain the specific test result statistics for your specific web element.

Add stats.json to the list of artifacts you wish to archive per test run.  Now save and run your test again.  Note, you may need to experiment with the arguments passed to JQ’s contains method to filter your results based on your specific needs.

Next Steps:

At this point, we should have a Jenkins job that contains a script that will allow us to execute tests against Webpagetest.org’s public API and retrieve and archive test results in a set of files and formats.

This can be handy in of itself but what if you have team or organization members who need access to some or all of this data but do not have access to Jenkins (for security purposes or otherwise)?

Some options to expose this data to other teams could be:

  • Sync your archived elements to a publicly available bucket in Amazon S3
  • Have a 3rd party monitoring service (Datadog, Sumo Logic, etc.) read and report test findings
  • Send out email notifications if some filtered stat within our results exceeds some threshold

There’s quite a few ideas to expand upon for this kind of testing and reporting.  We’ll cover some of these in a future blog post so stay tuned for that.

Private or Testing and Wrap-Up:

If you find this method of performance testing useful but are feeling a bit limited by Webpagetest.org’s restrictions on their public API (or the fact that all test results are made public), it is worth mentioning that if you’re needing something more robust or confidential, you can host your own, private instance of the free, open-source API (see Webpagetest.org’s github project for documentation).

Additionally, Webpagetest.org also has pre-built versions of their app available as Amazon EC2 AMIs for use by anyone with AWS access.  You can find more information on their free AMIs here.

Additionally, here’s the script we’ve put together through this post in its entirety:


npm install -g webpagetest
npm install -g jq-cli-wrapper
npm install -g wget-improved

webpagetest test $SITE -k $APIKEY -r $RUNS &gt; test_exec.json
&lt;span style="font-size: 1rem;"&gt;testId=$(cat test_exec.json | jq .data.testId)
&lt;/span&gt;testId="${testId%\"}"
testId="${testId#\"}"
echo $testId

webpagetest status $testId -o status.json
testStatus=$(cat status.json | jq .data.testsCompleted)

while [ "$testStatus" != "$RUNS" ]
do
sleep 10
webpagetest status $testId -o status.json
testStatus=$(cat status.json | jq .data.testsCompleted)
done

waterfallImage=$(cat results.json | jq '.data.runs."1".firstView'.images.waterfall)
waterfallImage="${waterfallImage%\"}"
waterfallImage="${waterfallImage#\"}"
nwget $waterfallImage -O waterfall.png

cat results.json | jq '.data.runs."1".firstView.requests[] | select(.url | contains(" <a unique identifying string for your web element> "))' > stats.json

We hope this article has been helpful in demonstrating how some free tools and services can be used to quickly stand up performance testing for your web applications.  Please check back with our R&D blog soon for future articles on this and other performance related topics.


Maintaining Test Data with the “someObject” Test Structure

Language: Scala
TestTool: Scalatest

How did we get here?

When systems become reasonably complex, tests must manage cumbersome amounts of data. A test case that may test a small bit of functionality may start to require large amounts of domain knowledge about the system being tested. This is often done through the mock data used to set up the test. Maintenance of this data becomes cumbersome, monotonous and can feel Sisyphean. To solve these problems we created “someObject”, a modular system that allows us to maintain data in only one location while providing the flexibility to create specific data for our tests.

Let’s Do A Code Time!

To start this post, we’re going to build a system without the “someObject” test structure to provide context for its use. (To skip to the “someObject” structure, jump to here!). Suppose we are building a service that reports on advertising campaigns. We may create a class that describes an advertising campaign and call it `Campaign`.

case class Campaign(id: String,
    name: String,
    client: String,
    startDate: UTCDate,
    endDate:UTCDate,
    deleted: Boolean)

Now we are going to store this campaign in a database, and we need to write some integration tests to make sure this operation is performed properly. A test that confirms a campaign is stored properly might look like this:

it should "properly store a single campaign" in {
    Given("we have a proper campaign")
    val campaignToStore = Campaign(
        id = "someId",
        name = "someName",
        client = "someClient",
        startDate = UTCDate(1955, 10, 6),
        endDate = UTCDate(1956, 10, 6),
        deleted = false)

    And("we store this campaign in the database")
    database.storeCampaign()

    When("we fetch the given campaign")
    val fetchedCampaign:Campaign = database.fetchCampaign()

    Then("All the campaign values were stored properly")
    fetchedCampaign.id shouldBe campaignToStore.id
    fetchedCampaign.name shouldBe campaignToStore.name
    fetchedCampaign.client shouldBe campaignToStore.client
    fetchedCampaign.startDate shouldBe campaignToStore.startDate
    fetchedCampaign.endDate shouldBe campaignToStore.endDate
    fetchedCampaign.deleted shouldBe campaignToStore.deleted
}

BlogIntro.scala

Add some functionality:

Now we add the ability to update some values for this campaign in the database, and we need to test this new piece of functionality. That test might look something like this:

it should "properly update a single campaign" in {
    Given("we have a proper campaign")
    val campaignToStore = Campaign(
        id = "someId",
        name = "someName",
        client = "someClient",
        startDate = UTCDate(1955, 10, 6),
        endDate = UTCDate(1956, 10, 6),
        deleted = false)

    And("some update parameters for our campaign")
    val updateParameters = UpdateParameters(name = Some("someNewName"))

    And("we store this campaign in the database")
    database.storeCampaign(campaignToStore)

    When("we update this campaign")
    database.updateCampaign("someId", updateParameters)

    val fetchedCampaign:Campaign = database.fetchCampaign("someId")

    Then("All the campaign values were stored properly")
    //Unchanged values
    fetchedCampaign.id shouldBe campaignToStore.id
    fetchedCampaign.client shouldBe campaignToStore.client
    fetchedCampaign.startDate shouldBe campaignToStore.startDate
    fetchedCampaign.endDate shouldBe campaignToStore.endDate
    fetchedCampaign.deleted shouldBe campaignToStore.deleted
    //Changed values
    fetchedCampaign.name shouldBe updateParameters.name
}

BlogUpdateFunction.scala

But here we see the duplication of test boilerplate code in `campaignToStore`. We don’t want to have to copy over `campaignToStore` into every test, so we might want to abstract that out to be used all over the suite.

object MyCampaignTestObjects {
    val campaignToStore = Campaign(
        id = "someId",
        name = "someName",
        client = "someClient",
        startDate = UTCDate(1955, 10, 6),
        endDate = UTCDate(1956, 10, 6),
        deleted = false)
}

BlogAbstractToSuite.scala

Now we can use the same data in every test!

Add a Test that requires unique data:

Suppose we now write a function to fetch all the campaigns that are stored in the database. We might need a test that involves uniqueness in the data we store, such as the following example:

it should "properly fetch all stored campaigns" in {
    Given("we store several unique campaigns")
    val anotherCampaignToStore = Campaign(
        id = "someSecondId",
        name = "someSecondName",
        client = "someSecondClient",
        startDate = UTCDate(1955, 10, 6),
        endDate = UTCDate(1956, 10, 6),
        deleted = false)
    database.storeCampaign(campaignToStore)
    database.storeCampaign(anotherCampaignToStore)

    When("we fetch all campaigns")
    val allCampaigns = database.fetchAllCampaigns()

    Then("all campaigns are returned")
    allCampaigns shouldBe List(campaignToStore, anotherCampaignToStore)
}

BlogTestWithUniqueTestData.scala

In the example, we re-used the campaign we abstracted out earlier for conciseness, but this makes this test unclear that `anotherCampaignToStore` is unique. What if someone else comes in and changes `campaignToStore` and it happens to match data from `anotherCampaignToStore`? This test would then become flakey and nobody likes flakey tests. We might decide to just make all data used in this test local to this test, but then we will need to maintain the test data in both this test, and `MyCampaignTestObjects`.

Add Some Arbitrary Data Constraints:

Suppose now that there is a new design constraint on how campaigns can be stored in the database. Now all client names must be lowercased in all campaigns:

object MyCampaignTestObjects {
    val campaignToStore = Campaign(
    id = "someId",
    name = "someName",
    //We change the client name to match our new requirement
    client = "some_client",
    startDate = UTCDate(1955, 10, 6),
    endDate = UTCDate(1956, 10, 6),
    deleted = false)
}

BlogNewConstraint.scala

Now we start to see the issue with maintaining test data across the whole suite that we’ve been constructing. We need to find every mock campaign that is used in our suite and ensure that its client field data is lowercased. Realistically, many of our tests, (specifically in this example, the `fetchAllCampaigns` test) don’t care about the client field of their campaign, and so we shouldn’t need to care about the client field value while setting up our mock test data. Because this example is small, it’s not cumbersome to directly update the value to satisfy the new constraint. Now let us Imagine a large set of suites, each containing hundreds of unique test cases. Suddenly this single suite requires a large amount of work to refactor one field across each test case. Nobody wants to do that monotonous maintenance. To address this, our team adopted the “someObject” structure to minimize this data maintenance within our tests.

someObject Test Structure:

When designing this test structure, we wanted to make our test data extendable for use anywhere it is needed. We used Scala’s `trait` to mix in necessary functions to provide test objects to the objects inside our tests, such as the `MyCampaignTestObjects` object above:

trait CampaignTestObjects {
    def someCampaign(id: String = "someId",
                     name: String = "someName",
                     client: String = "some_client",
                     startDate: UTCDate = UTCDate(1955, 10, 6),
                     endDate: UTCDate = UTCDate(1956, 10, 6),
                     deleted: Boolean = false): Campaign =
        Campaign(
            id = id,
            name = name,
            client = client,
            startDate = startDate,
            endDate = endDate,
            deleted = deleted)
}
 object MyCampaignTestObjects extends CampaignTestObjects {
    //Any other setup methods for test data
}

Now we can revisit our `fetchAllCampaigns` test example.

it should "properly fetch all stored campaigns" in {
    Given("we store several unique campaigns")
    val campaignToStore = someCampaign(id = "someId")
    val anotherCampaignToStore = someCampaign(id = "someNewId")
    database.storeCampaign(campaignToStore)
    database.storeCampaign(anotherCampaignToStore)

    When("we fetch all campaigns")
    val allCampaigns = database.fetchAllCampaigns()

    Then("all campaigns are returned")
    allCampaigns shouldBe List(campaignToStore, anotherCampaignToStore)
}

BlogBasicSomeObject.scala

Inside this test, we’ve set up two unique campaigns, by calling the `someCampaign` method from our test data trait. This populates the returned campaign with dummy data that we don’t care about. All we need out of this method is “some campaign” with “some data”. Now, instead of obscuring the intent of the test case by setting up cumbersome, overly-expressive mock data, we can simply override the implicitly available mock objects with only the necessary data. For the unique campaigns needed in the `fetchAllCampaigns` test, we only only really care about each campaign’s identifier. We don’t update the name, client, startDate, etc. because this test doesn’t care about any of that data. We only need to care that the campaigns are unique for our database. Under this test structure, when we receive the design change about the client names being lowercased, we don’t need to update our `fetchAllCampaigns`.

Another Example:

Let’s provide another example that our team encountered. Campaigns inside our database now need to also store the amount of money spent on each ad campaign. We’re adding a new column to our database, and changing the database schema.

case class Campaign(id: String,
    name: String,
    client: String,
    totalAdSpend: Int,
    startDate: UTCDate,
    endDate: UTCDate,
    deleted: Boolean)

Now, every test that has a campaign involved needs to be updated to include a new field; but under the “someObject” structure we only need to add two lines and all existing tests should be working fine again:

trait CampaignTestObjects {

    def someCampaign(id: String = "someId",
                     name: String = "someName",
                     client: String = "some_client",
                     totalAdSpend: Int = 123456,
                     startDate: UTCDate = UTCDate(1955, 10, 6),
                     endDate: UTCDate = UTCDate(1956, 10, 6),
                     deleted: Boolean = false): Campaign =
        Campaign(
            id = id,
            name = name,
            client = client,
            totalAdSpend = totalAdSpend,
            startDate = startDate,
            endDate = endDate,
            deleted = deleted)
}

BlogPostSchemaChange.scala


Behavior Driven Tests:

The purpose of the “someObject” structure is to minimize data maintenance within tests. We want to ensure that we’re disciplined about only setting data that the tests need to care about. There are cases where data might seem necessary for what we are testing, but we can abstract that data away to de-couple the test’s reliance on hard coded values. For example, suppose we have a function that returns the sum of all the `totalAdSpend` across our database.

def sumAllSpend(campaignsToSum: List[Campaign]):Int = 
    campaignsToSum.reduce(_.totalAdSpend + _.totalAdSpend)

To test this function, we might write a test like this:

it should "properly sum all totalAdSpend" in {
    Given("we store several unique campaigns")
    val campaignToStore = someCampaign(id = "someId", totalAdSpend = 123)
    val anotherCampaignToStore = someCampaign(id = "someNewId", totalAdSpend = 456)
    database.storeCampaign(campaignToStore)
    database.storeCampaign(anotherCampaignToStore)

    When("we sum all ad spend")
    val totalTotalAdSpend = sumAllSpend(database.fetchAllCampaigns())

    Then("the result is the sum of all ad spend")
    totalTotalAdSpend shouldBe 975
}

BlogPostNonBehaviorTest.scala

While this test does work, and it utilizes this “someObject” structure, it still forces data management at the test level.

`sumAllSpend` doesn’t really care about any one campaign’s `totalAdSpend` value. It only cares that we add all of the `totalAdSpend` values up correctly. We could instead write our test to assert on this behavior instead of doing the math ourselves and taking on the responsibility of managing more data.

it should "properly sum all totalAdSpend" in {
   Given("we store several unique campaigns")
   val campaignToStore = someCampaign(id = "someId")
   val anotherCampaignToStore = someCampaign(id = "someNewId")

   val allCampaignsToStore = List(campaignToStore,anotherCampaignToStore)
   allCampaignsToStore.foreach(campaign =&amp;gt; database.storeCampaign(campaign))

   When("we sum all ad spend")
   val totalTotalAdSpend = sumAllSpend(database.fetchAllCampaigns())

   Then("the result is the sum of all ad spend")
   totalTotalAdSpend shouldBe allCampaignsToStore.reduce(_.totalAdSpend + _.totalAdSpend)
}

BlogPostBehaviorTest.scala

With this test, we don’t care what campaigns sales were, we don’t care how many campaigns are stored, and we don’t care about any constant value. This test will return the sum of all campaign’s `totalAdSpend` value that we store in the database.

Conclusion:

In this introductory blog post, we explored the someObject testing structure in scala, but this concept is not intended to be language specific. Scala makes this concept easy to implement through the use of Default Parameter Values but in a future post I’ll show how it can be implemented through the Builder Pattern in a language like Java. Another unexplored “someObject” concept is the granularity of control in setting default data. This post introduces the “global” and test specific setting of default data, but doesn’t explore how to set test suite level data for our test objects, and the cases in which that might be useful. I’ll discuss that the future post as well.

Code snippets:

BlogIntro.scala
BlogUpdateFunction.scala
BlogAbstractToSuite.scala
BlogTestWithUniqueTestData.scala
BlogNewConstraint.scala
BlogBasicSomeObject.scala
BlogPostSchemaChange.scala
BlogPostNonBehaviorTest.scala
BlogPostBehaviorTest.scala

Database Migration

MalcolmInTheMiddleGif

(Always One More Thing…)

Who Are We?

The Ad Management team here at Bazaarvoice grew out of an incubator team. The goal of our incubator is to quickly iterate on ideas, producing prototypes and “proof of concept” projects to be iterated on if they validate a customer need. The project of interest here generates reports based on aggregations of event data gathered from several other teams at the company. As our project gained traction, it grew in size and scope, eventually leading to the need to revisit some of the design decisions made in the prototyping phase. Specifically, we found the original database system we chose, EmoDB, to not meet our needs as our requirements evolved.

Why Migrate?

When this project was started, it began as a prototype designed to get the project rolling as quickly and easily as possible. The initial team chose EmoDB since they were familiar with the in-house technology from their other projects and it fit our initial needs. As the project gained traction, and we had more data to operate against, we encountered scalability issues, initially resolved with caching and some refactoring. We found that we were querying EmoDB as if it were a typical relational database, when it’s not actually designed for that use case. (Emodb is an eventually consistent json blob store with a change notification databus that spans multiple AWS AZs and Regions. EmoDB powers many of our solutions at Bazaarvoice and is now open-source and available at:
https://github.com/bazaarvoice/emodb

We chose to switch to MySql to leverage the Relational Data Model for rolling up aggregations of data we collect and calculate. We ran into problems previously when we retrieved whole documents to perform aggregations on our data, leading us to decide that a technology that is optimized for relational models would suit the project much better.

How to Migrate?

Since our project already had trained users by the time we wanted to migrate database systems, we needed to design our migration with a no-down-time approach; “seamlessly” changing out the back-end implementation for our users. We also made these transitions configurable, such that we wouldn’t need to make one large switch to master from the new system, but we could choose which services were ready to be cut over to the new data back-end.
The following image is our design document that describes how we planned our migration. On the left is our origin code base named “legacy”. On the right was the proposed design for our new service stack for the migration. Inserted into the middle is the “Service Facade” where we intended to run our quality assurance against live data between the legacy technology stack and our new technology stack.

Copy of ad-management migration to MySql based stack - Page 1

How to Maintain Data Consistency?

Depending on the size of the data that is being diffed and migrated between databases, it can be expensive to run the necessary migrations. Our solution was both writing specific tasks that backfilled data or directly migrating data sets to the new data source. This allowed us to smoke test that our services are working, without expending large amounts of time or money finding bugs along the way. As our confidence grew in our custom tooling and services, we would backfill and migrate larger chunks of data, until we had migrated everything necessary to master from our new service.

What is a Service Facade?

The service facade layer is responsible for executing the respective operations out of the legacy and new stacks. This is where we placed our diffing logic to compare the results returned from Emo and Mysql for the same operation. The facade returns data from the pre-defined configured stack. This meant that certain areas of the application could be sourcing from Mysql, while other areas, that we weren’t confident in, continued to source from Emo. For example, our CampaignRoiReportBuilderServiceFacade written in Scala looked something like this:


class CampaignRoiReportBuilderServiceFacade @Inject()(
private val campaignRoiReportBuilderServiceLegacy:CampaignRoiReportBuilderServiceLegacy,
private val campaignRoiReportService:CampaignRoiReportService,
private val campaignConfig: CampaignConfiguration,
private val facadeDiffTool: FacadeDiffTool) {
...
  def buildReport(...): Future[Option[CampaignRoiReport]] = {
    val roiReportFromEmoDbFuture: Future[Option[CampaignRoiReport]] = campaignRoiReportBuilderServiceLegacy.buildReport(...)
    val roiReportFromMySqlFuture: Future[Option[CampaignRoiReport]] = campaignRoiReportService.buildReport(...)

    // Extract data from scala futures
    for {
      roiReportFromEmoDbMaybe &lt;- roiReportFromEmoDbFuture
      roiReportFromMySqlMaybe &lt;- roiReportFromMySqlFuture } { // Pattern Matching to extract values from scala Option (roiReportFromEmoDbMaybe, roiReportFromMySqlMaybe) match { case (None, None) =&gt; //this is an impossible case, but listed to avoid compilation warning
        case (Some(_), None) =&gt; LOG.warn("/*Report missing/mismatched data*/")
        case (None, Some(_)) =&gt; LOG.warn("/*Report missing/mismatched data*/")
        case (Some(roiReportFromEmo),Some(roiReportFromMySql)) =&gt;
          val mismatches = facadeDiffTool.campaignROIReportLegacyDiff(roiReportFromEmo,roiReportFromMySql)
          if(mismatches.nonEmpty)
            LOG.warn("/*Report missing/mismatched data*/")
      }
    }

//This is how we configure what source we return to the resource.
    campaignConfig.masteringFrom match {
      case EmoDb =&gt;
        roiReportFromMySqlFuture.onFailure{
          case e:Throwable =&gt; LOG.warn("Failed to build an ROI report on the MySql side", e)
        }
        roiReportFromEmoDbFuture
      case MySql =&gt;
        roiReportFromEmoDbFuture.onFailure{
          case e:Throwable =&gt; LOG.warn("Failed to build an ROI report on the EmoDb side", e)
        }
        roiReportFromMySqlFuture
    }
  }
}

The original resource classes will be modified to call from the new facade layer, but no other functionality should change. If constructed properly, the facade layer will act in the same way as the original service because the facade mimics the public functions available in the original service class. These duplicated functions will call to the methods from the legacy service class as well as the new service. With the responses from both the legacy and new services, the facade layer can make an assessment on the differences between the two service stacks. To report our differences such that we could be notified during API usage, we would log them out to our log management and monitoring system.

How Did We Capture Mismatches?

Logging was a large concern of ours. We knew that there would be many differences per call while we were debugging our new service stack. As an example, on one call, we reported 2000+ differences. We wanted to compose all differences into one log per call in a meaningful way. For this, we wrote custom diff tooling that would return differences in the data as sets of MismatchedField classes.


case class MismatchedField[T](name: String,
                              legacyValue: T,
                              newValue: T)


This templated class will hold the values returned from both the legacy service (legacyValue), and the new stack’s service (newValue), as well as some meaningful tag with which to identify where this mismatch came from (name). We would then compose all mismatches for any given call into a single log through our custom diff tool. Every function within our custom diff tool returns Set[MismatchedField[Any]]. We can then compose each set into a single set of differences such that we can use only one log call to write out the whole set of differences in one log entry.

An Interesting Finding:

One of the most interesting findings we had through this migration weren’t bugs that came in constructing our new service stack for the new database, but that we found bugs in our original database stack. One take-away from this was to make sure to investigate any mismatches found down to the source data. We found during the code migration process that some of our legacy functionality was written incorrectly. As an example, in our legacy code we were storing some aggregated data in sets, unintentionally masking duplicate data. When re-implementing these same aggregations for our new service stack, they were correctly implemented as a list, producing a mismatch in the data. Through our investigation, instead of simply matching the data to how our legacy service worked, we went back to our origin data, and ran the calculations manually through the Scala REPL. In doing so, we found that the new service was correct, where our legacy code was wrong. Fortunately, the bug within our legacy code was a simple fix. We implemented the fix within the legacy code and our mismatch disappeared.

Other Take-aways:

An important team take-away was to be very upfront and declarative about the work that the migration would require. Our investigation into the migration not only involved setting up a new technology stack for MySql, but also changing our build tool from Maven to SBT, introducing a Flyway + Jooq plugin to enforce type safety throughout the migration, designing a new data model (which was ultimately the driving factor for doing the migration in the first place), as well as upgrading our code up to the newest scala version to leverage all of the previous changes. Ultimately, we severely underestimated, and under-ticketed the work necessary to start our migration.

It is also important to keep in mind that every team is different and has different needs. When having conversations about database migrations, take the time to do a proper risk assessment for the work ahead. Keep these conversations going during the migration as well. As a team, we ended up prioritizing new feature requests and non-migration related bugs because the migration felt orthogonal to our production environment.

A further takeaway is that we could have saved ourselves a lot of time if we had more realistically assessed our users. In retrospect, the users of these reports were internal and would have been more lenient with smaller service outages, which would have allowed us to leverage our configurable services to migrate much sooner. At the expense of stability, we believe that we could have had a quicker migration by forcing ourselves to fix problems forward, instead of maintaining our legacy code for as long as we did. Still, most scenarios don’t have this luxury and we hope the façade based approach is of help to you.

Cross-Platform Mobile SDK Testing

This Bazaarvoice blog entry is co-authored by Tanvir Pathan as part of a Bazaarvoice internship project on the Bazaarvoice Mobile Team.

Automated testing of native mobile applications has long been a pain point in the world of mobile app development. If you are creating and distributing apps or open source SDKs across two or more major platforms (Android and iOS in our case), you can easily find yourself duplicating efforts to test the same source and business logic across different technology stacks. For example, if you have experienced developers and testers using Xcode for iOS apps, they may tend to automate testing with Instruments Automation, where Android developers and testers may automate with Espresso or UIAutomator. This becomes an expensive proposition for development and maintenance of unit tests, which can be costly as your test coverage increases.

Test strategy can also vary depending on the type of mobile app development your shop pursues: native, hybrid, cross-compile, mobile web. Hence, the selection of test tools will vary depending on how you build and deploy apps.

In this blog post, we’ll detail a novel solution to cross-platform testing of our native SDKs, along with some background of other mobile tool offerings. Our solution focuses on cross-platform open source mobile SDK testing utilizing Cordova to wrap our SDKs in a generic JavaScript interface, and Calabash to drive our cross-platform behavioral tests.

If you want to check out the full solution, the Cordova plugin and description on how to execute Calabash can be found in our Github repository.

How to View Mobile Application Development

Non-mobile app developers typically don’t actually know the difference between a web app, native, or hybrid app. If you work in any business that supports some kind of mobile solution (and you probably wouldn’t be reading this if you didn’t) it’s really important to understand some fundamental differences. It’s very easy to just throw out the word “mobile” in conversation and not realize there’s multiple parts to this elephant!

blindmen

The table below presents four general categories of mobile application development. Keep these categories in mind when talking about “mobile” in general and don’t fall in the trap of the blind men and the elephant.

Mobile Development Types & Tools

Type
Description
Tools
Native Application Development Developers creating purely native apps will write in the language supported by their target platform. For iOS apps, developers can write in Swift and/or Objective-C, while Android developers can write in Java (and C/C++ for lower level execution)
Cross-compilation Developers can also write apps for multiple platforms in a single language, such as Java Script. Cross-compilation tools will take a common language and actually convert it to the target language of the native platform. In this case, while developers aren’t writing in the native language, the tools create real native apps. Some of the most common tools are: Appcelerator (JavaScript), Xamarin (C#), React Native (Java Script)
Hybrid Applications Hybrid apps utilize Web Views to display content, typically written with common web development technologies such as Java Script, HTML, and CSS. Hybrid apps will typically have a “bridge” that allows javascript code to communicate with the native libraries to do things like access the camera, location services, or contacts. Cordova (aka PhoneGap) as the application container. Developers choose their favorite UI layer to work with Corodva: ionic, Sencha Touch, jQuery Mobile, Onsen, Framework 7.
Web Applications / Mobile Web A web application isn’t as much an application as it is a mobile optimized web site. Hence, you won’t find a Web Application in the App or Google Play Store, you just fire up your favorite mobile web browser and load the site.

Cross Platform Mobile UI Testing Tools

When developing for native mobile, developers will typically write unit tests to check individual pieces of functionality and business logic, perhaps even employ certain mocking techniques to test networking and user interface capabilities without the need for a full application. However, when it comes to full system testing of full applications and SDKs, making the right selection can be a tough process. However, if cross-platform testing is your objective and you want to write all your tests in one common scripting language, the options narrow quickly.

While there are platform-specific UI automation frameworks for Android (Robotium, UiAutomation) and iOS (Instruments Automation, Keep It Functional, EarlGrey), there currently only two (that we are aware of) that allow us to test cross-platform with a common script.

Tool
Summary
Appium Appium lets developers write tests for applications without having to add any additional code the applications. It works with native, hybrid, and mobile web applications.
Calabash Calabash is owned and maintained by Xamarin, and provides cross-platform testing for native or hybrid apps. Unit tests can be written in Ruby with Cucumber.

2 Birds, One Stone

kill2birds3

Making the decision to use Cordova and Calabash was fairly easy. First we already distribute our BBVSD via frameworks and libraries for iOS and Android. Second we know some of our customers are creating hybrid applications with Corodva. So we immediately thought: what if we could create a test environment that not only tests our SDK deliverables, but also provides our clients with an easy avenue to integrate Bazaarvoice services into their own Cordova app. Win! Win! As well, because we already use Cucumber extensively at Bazaarvoice, we decided to leverage our already strong in-house expertise and utilize an automation framework that is internally familiar.

Calabash Unit Tests

Another great thing about using Calabash at Bazaarvoice is that we already have an internal framework developed on top of Cucumber. Because Calabash layers on top of Cucumber, the paradigm and philosophy of writing human readable test cases still applies. The test cases utilize Behavior Driven Development  modeling tools to add meaning to your mobile app testing.

Let’s say you are creating the same app for multiple platforms. Typically, you would have to write completely different sets of code to run similar tests. With Calabash, this is not the case. You write one set of code tests and make slight adjustments depending on the platforms in question and you are done!  Best of all, in addition to Calabash being free, the test cases are super easy to write as a developer and even easier to read for others who may be interested in checking out the health of the project.

Needless to say, Calabash provides a lot of benefits for cross platform testing. Lets take a look at an example test case from the BVSDK Cordova Plugin project. Let’s go through a simple scenario based on the following app screens shots from the iOS simulator.

bvsdk_build_simulator bvsdk_running_simulator

Say you wanted to count the number of products that were recommended by our Product Recommendations API. If you were doing it manually you would go through the following steps:

  1. Wait for the app to launch
  2. Make sure you receive a success alert and press ok
  3. Click the Recommendations tab
  4. Then count how many products there are and compare them to what you were expecting

Now how would we code this? Calabash has two essential components: one feature file and one ruby file. The feature file is where you write out the tests and the ruby file is used primarily to make custom functions if needed (although most of what you need comes right out of the box). So returning to our problem, writing out the test case, you simply write down those exact steps in the feature file:

Feature File
Feature: BVSDK Demo App
@recommendations_test
  Scenario: As a user, I want to get new recommendations
    Given the app has launched
    Then I should see "BVSDK has been built successfully."
    Then I press the OK button
    Then I press Recommendations tab
    Then I check number of products

mindblown

That’s really all there is to it. Of course, tests can be also written to be more platform specific when needed.

Entering the Matrix – Travis CI

We use Travis CI for all our public repos at Bazaarvoice. It’s awesome. But, we have to support multiple build tools on different virtual machines. Configuring all these build machines with custom tools sounds and build scripts really scary! Freak out!

matrix

The really slick thing about Travis CI is that you can test multiple configuration, variations, permutations, salutations, etc, etc, etc, by building a matrix in Travis’ Config file (.travis.yml). For our testing, since XCode only runs on OS X and it’s the only way to build for iOS, we must have an OS X image. For the Android Studio and Gradle build tools, we build against Linux. In addition there’s some common tooling we can install for each build machine. The result is that we can use two different VMs for testing each platform, with just one set of tests. Note in the test result below, the build jobs are defined by the environment variables defined in the Travis config file.

travis_matrix

The .travis.yml script looks like this, where we build a matrix with environment variables and platforms:

matrix:
  include:
    - language: android
      env: TO_TEST=ANDROID
      jdk: oraclejdk8
    - os: osx
      osx_image: xcode8
      env: TO_TEST=IOS
  fast_finish: true
android:
  components:
    - platform-tools
    - tools
    - android-23
    - build-tools-23.0.3
    - extra-android-m2repository
    - extra-google-m2repository
    - sys-img-armeabi-v7a-android-19
install:
  - rvm install 2.2.0
  - if [ "$TO_TEST" = "ANDROID" ]; then gem install calabash-android; fi
  - if [ "$TO_TEST" = "IOS" ]; then gem install calabash-cucumber; fi
before_script:
  - if [ "$TO_TEST" = "ANDROID" ]; then chmod 755 createEmulator.sh; fi
  - if [ "$TO_TEST" = "ANDROID" ]; then ./createEmulator.sh; fi
script:
  - if [ "$TO_TEST" = "ANDROID" ]; then chmod 755 androidTest.sh; fi
  - if [ "$TO_TEST" = "ANDROID" ]; then ./androidTest.sh; fi
  - if [ "$TO_TEST" = "IOS" ]; then chmod 755 iosTest.sh; fi
  - if [ "$TO_TEST" = "IOS" ]; then ./iosTest.sh; fi

BVSDK Cordova Plugin Features

So what if I want to try out the BVSDK Cordova plugin? If you want more info or checkout the source code for the plugin and unit tests, just head over to our Cordova Github repo. There’s plenty of info in the README for running the examples and unit tests.

Open Source Contributions

If you are building a Cordova-based application and want to see other things added just let us know, or better yet submit a pull request and we’ll be happy to review it!