Author Archives: Gary Spillman

Still Looking Good While Testing: Automated Testing With a Visual Regression Service Part II

If you’ve followed our blog regularly, you’ve probably read our post on using visual regression testing tools and services to better test your applications’ front end look and feel.  If not, take a few minutes to read through our previous post on this topic.

Now that you’re up to speed, let’s take what we did in our previous post to the next level.

In this post, we’re going to show how you can alter your test configuration and code to test mobile browsers through a given testing service (browserstack) as well as get better reporting out of our tests natively and through options available to us in Jenkins.

Adjusting the Fuzz Factor:

If you run your test multiple times across several browsers with the visual regression service  using default settings, you may notice a handful of exception images cropping up in the diff directory which look nearly identical.

browser-fight

Browser fight!!!


If you happen to be testing across several browsers (using Browserstack or a similar service) which potentially have these browsers hosted in real or virtual environments with widely differing screen resolutions, this may impact how the visual-regression service performs its image diff comparison.

To alleviate this, either ensure your various browser hosts are able to display the browser in the same resolution or add a slight increase in your test’s mismatch tolerance.

As mentioned in our previous post, you can do this by editing the values under the ‘visual regression service’ object in your project’s wdio.conf file.  For example:

visualRegression: {
  compare: new VisualRegressionCompare.LocalCompare({
    referenceName: getScreenshotName(path.join(process.cwd(), 'screenshots/reference')),
    screenshotName: getScreenshotName(path.join(process.cwd(), 'screenshots/screen')),
    diffName: getScreenshotName(path.join(process.cwd(), 'screenshots/diff')),
    misMatchTolerance: 0.25,
  }),

Setting the mismatch tolerance value to 0.25 in the above snipped would allow the regression service a 25% margin of error when checking screen shots against any reference images it has captured.

Better Test Results:

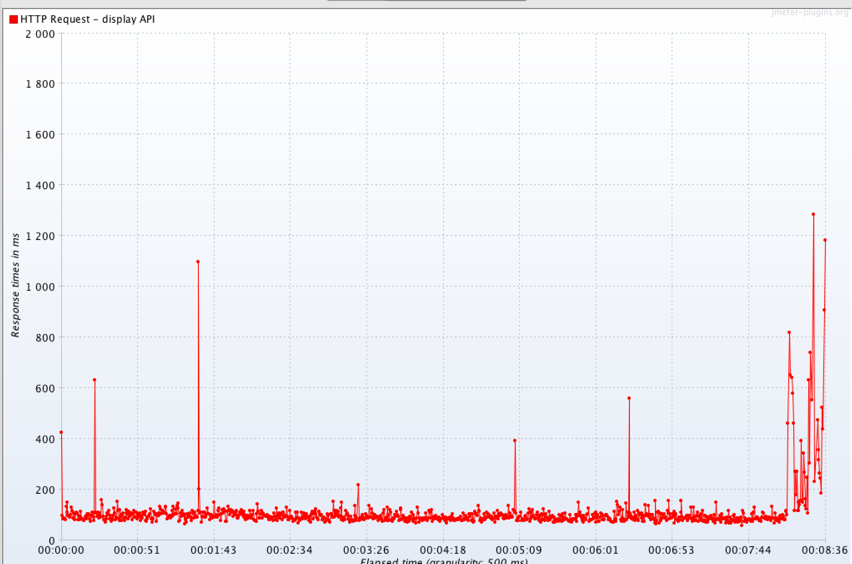
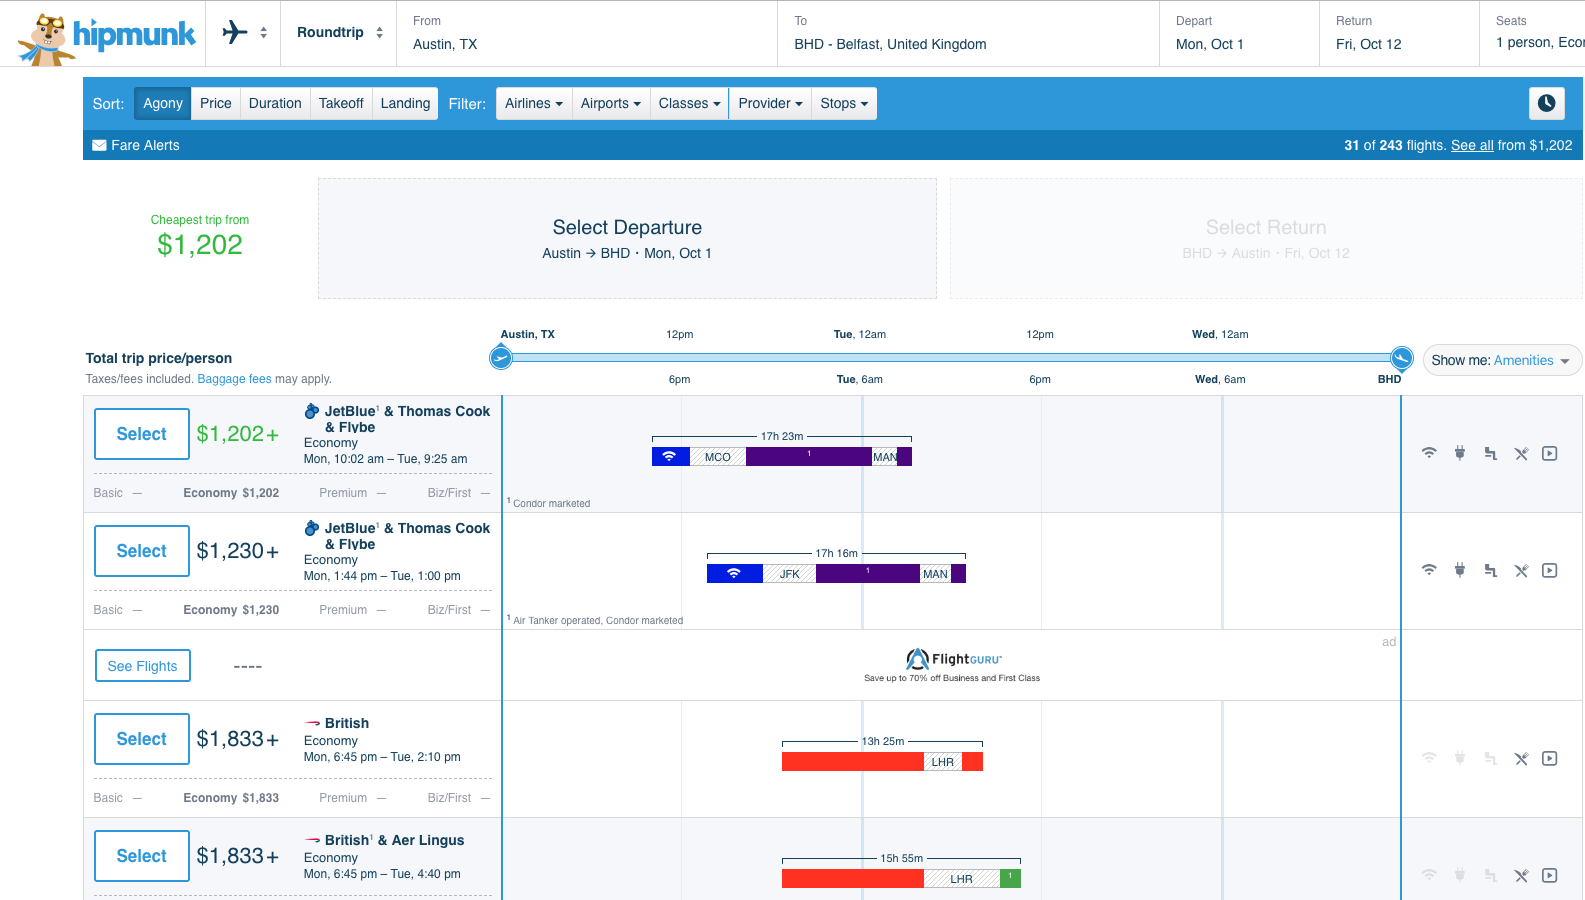
Also mentioned in the previous post, one of the drawbacks to given examples of using the visual-regression service in our tests is that there is little feedback being returned other than the output of our image comparison.

head-in-sand

Having fun with that lack of feedback?


However, with a bit of extra code, we can make usable assertion statements in our test executions once a screen comparison event is generated.

The key is the checkElement() method which is really a WebdriverIO method that is enhanced by the visual-regression service.  This method returns an object that contains some meta data about the check being requested for the provided argument.

We can assign the method call to a new variable, which, once we ‘deserialize’ the object into something readable (e.g. a JSON string) we can then leverage Chai or some other framework to use assertions to make our tests more descriptive.

Here’s an example:

it('should test some things visually', () => {
  ...
  let returnedContents = JSON.stringify(browser.checkElement('<my web element>');
  console.log(returnedContents);
  assert.includes('<deserialized text to assert for', returnedContents);
});

In the above code snippet, near the end of the test, we are calling ‘checkElement()’ to do a visual comparison of the contents of the given web element selector, then converting the object returned by ‘checkElement()’ to a string.  Afterward, we are asserting there is some text/string content within the stringified object our comparison returned.

In the case of the text assertion, we would want to assert a successful match message is contained within the returned object.  This is because the ‘checkElement()’ method, while it may return data that indicates a test failure, on its own will not trigger an exception that would appropriately fail our test should an image comparison mismatch occur.

Adding Mobile

going-mobile

Oooh – someone downloaded the pancake app!


Combining WebdriverIO’s framework along with the visual-regression service and a browser test service like Browserstack, we can create tests that run against real browsers.  To do this, we will need to make some changes to our WebdriverIO config.  Try the following:

  1. Make a copy of your wdio.conf.js
  2. Name the copy wdio.mobile.conf.js
  3. Edit your package.json file
  4. Copy the ‘test’ key/value pair under ‘scripts’ and past it to a new line, rename it ‘test:mobile’
  5. Point the test:mobile script to the wdio.mobile.conf.js config file and save your changes

Next, we need to edit the contents of the wdio.mobile.conf.js script to run tests only against mobile devices.  The reason for adding a whole, new test config and script declaration is that due to the way mobile devices behave, there are some settings to declare for mobile browser testing with WebdriverIO and Browserstack which are incompatible with running tests against desktop browsers.

Edit the code block at the top of the mobile config file, changing it to the following:

var path = require('path');
var VisualRegressionCompare = require('wdio-visual-regression-service/compare');
function getScreenshotName(basePath) {
  return function(context) {
    var type = context.type;
    var testName = context.test.title;
    var browserVersion = parseInt(context.browser.version, 10);
    var browserName = context.browser.name;
    var browserOrientation = context.meta.orientation;
    return path.join(basePath,
    `${testName}_${browserName}_v${browserVersion}_${browserOrientation}_mobile.png`);
  };
}

Note that we’ve removed the declarations for height and width dimensions.  As Browserstack allows us to test on actual mobile devices, defining viewport constraints are not only unnecessary, but it will result in our tests failing to execute (the height and width dimension object can’t be passed to webdriver as part of a configuration for a real, mobile device).

Next, update the visual-regression service’s orientation configuration near the bottom of the mobile config files to the following:

orientations: ['portrait', 'landscape'],

Since applications using responsive design can sometime break when moving from one orientation to another on mobile devices, we’ll want to run out tests in both orientation modes.

Stating this behavior in our configuration above will trigger our tests to automatically switch orientations and retest.

Finally, we’ll need to update our browser capability settings in this config file:

capabilities: [
{
  device: 'iPhone 8',
  'browserstack.local': false,
  'realMobile': true,
  project: 'My project - iPhone 8',
},
{
  device: 'iPad 6th',
  'browserstack.local': false,
  'realMobile': true,
  project: 'My project - iPad',
},
{
  device: 'Samsung Galaxy S9',
  'browserstack.local': false,
  'realMobile': true,
  project: 'My project - Galaxy S9',
},
{
  device: 'Samsung Galaxy Note 8',
  'browserstack.local': false,
  'realMobile': true,
  project: 'My project - Note 8',
},
]

In the code above, the ‘realMobile’ descriptor is necessary to run tests against modern mobile devices through Browserstack.  For more information on this, see Browserstack’s documentation.

Once your change is saved, try running your tests on mobile by doing:

npm run test:mobile

Examine the image outputs of your tests and compare them to the results from your desktop test run.  Now you should be able to run tests for your app’s UI across a wide range of browsers (mobile and desktop).

Taking Things to Jenkins

You could include the project we’ve put together so far into the codebase of your app (just copy the dev dependencies from your package.json your specs and configs into the existing project).

Another option is to use this as a standalone testing tool to apply some base screen-shot based verification of your app.

In the following example, we’ll go through the steps you can to set up a project like this as a resource to use in Jenkins to test a given application and send the results to members of your team.

Consider the value of being able to generate a series of targeted screen shots of elements of your app per build and send them to team members like a product manager or UX designer.  This isn’t necessarily ‘heavy lifting’ from a dev ops standpoint but automating any sort of feedback for your app will trend toward delivering a better app, faster.

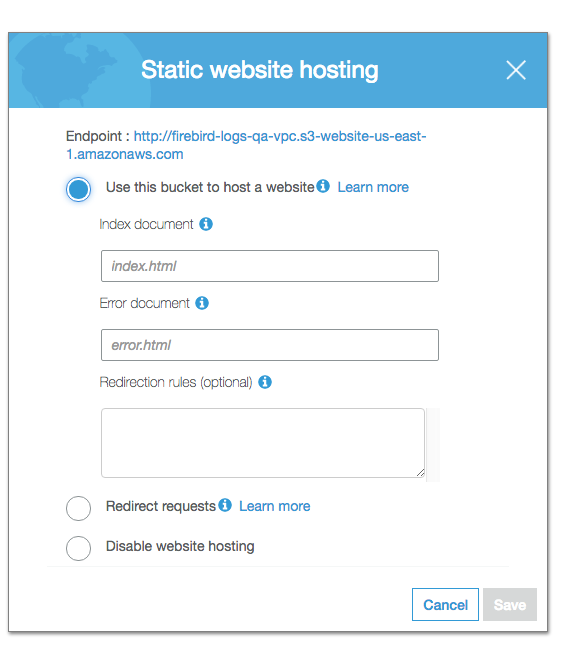
Assuming you have your project hosted in Github, you have administrative access to Jenkins and that your app is hosted in an environment Jenkins can access (your organization’s Amazon S3 bucket, hosted from a Docker image, etc.):

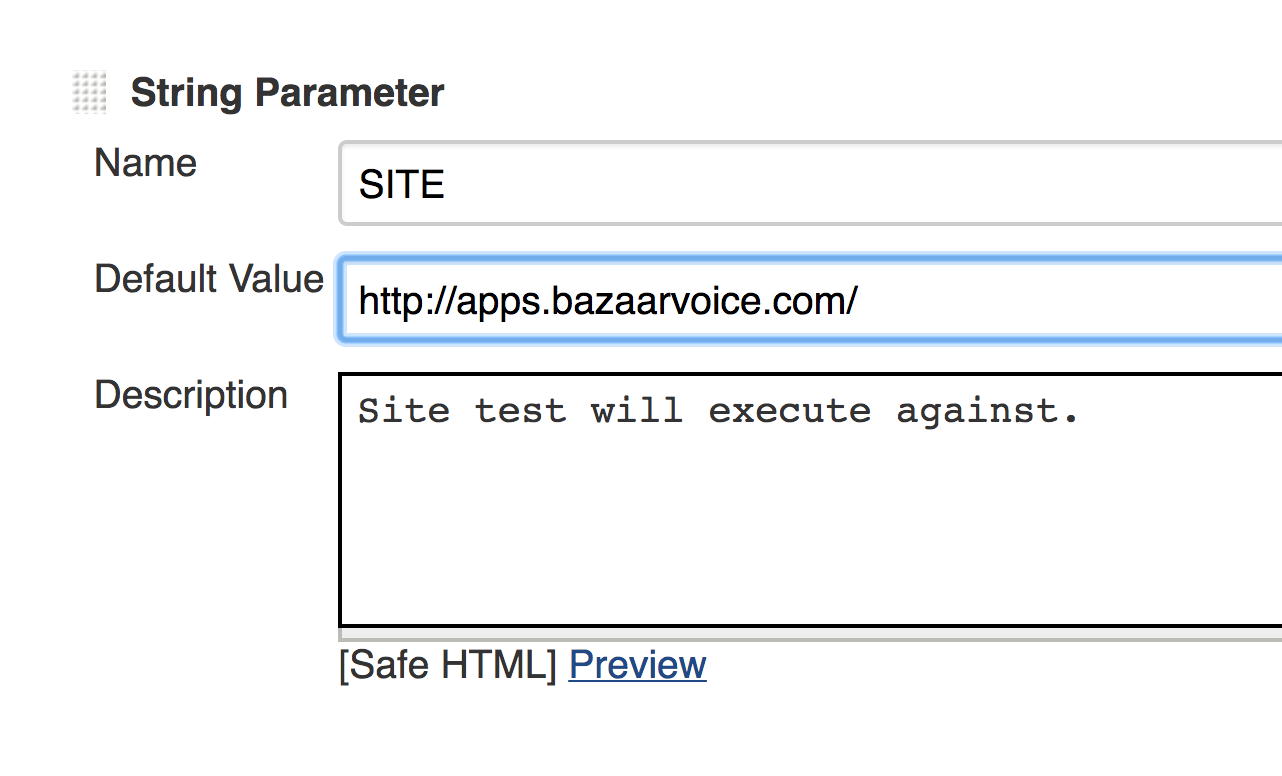
I. Create a new Jenkins job

jenkins-proj-name


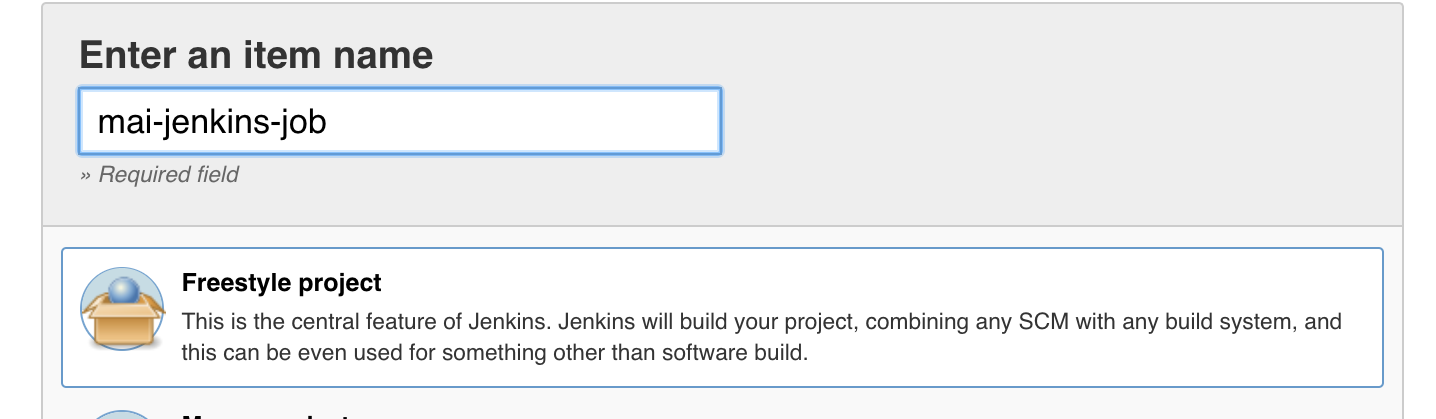
* Create a new Jenkins task within the same space the job that builds and ships your web app (should one exist).  Assign it a name.

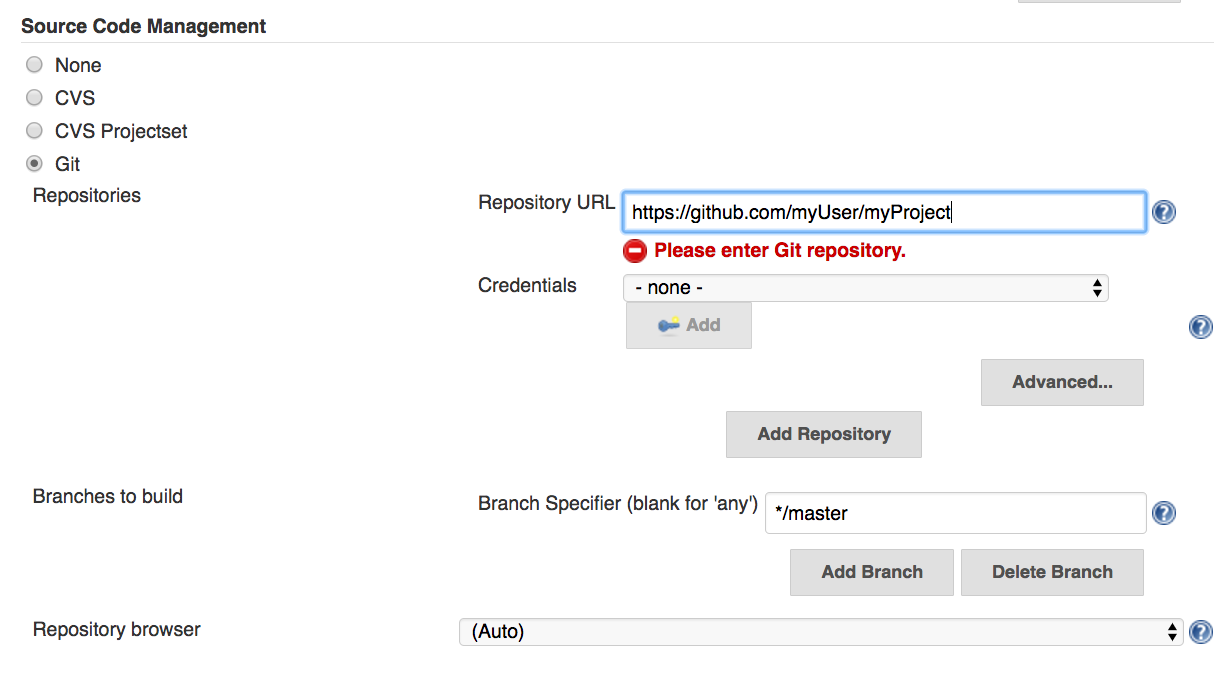
II. Configure the job to pull from your image testing app from Github

jenkins-set-repo


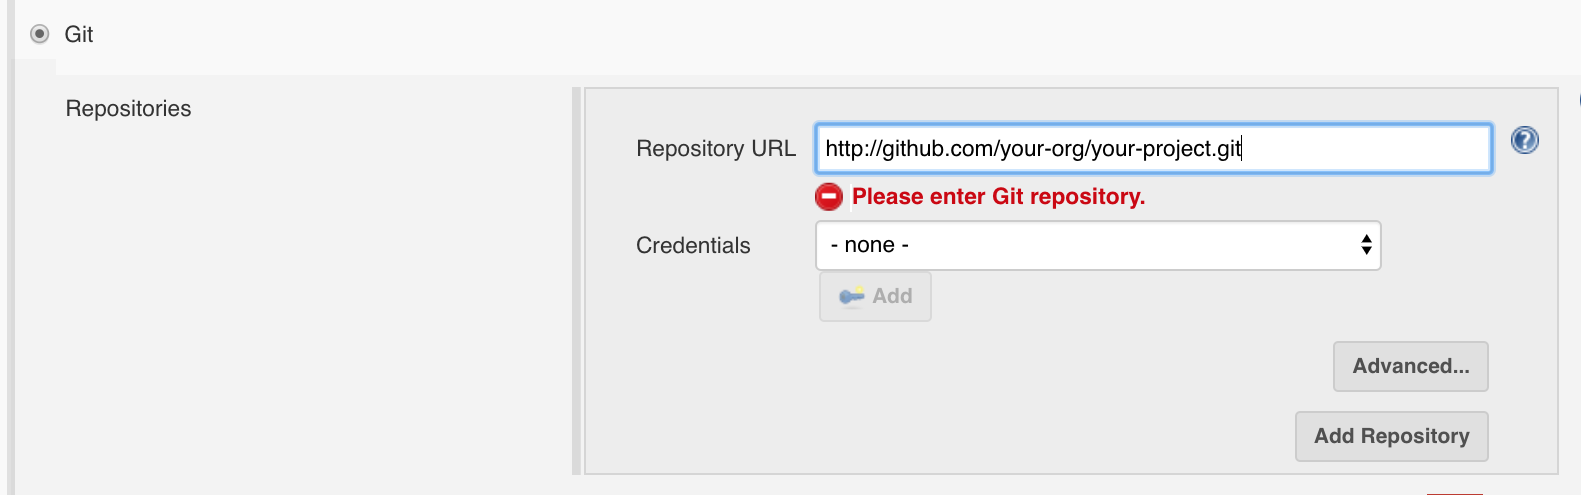
* Go to the source control configuration portion of the job.  Enter the info for your repository for the test app you’ve built.

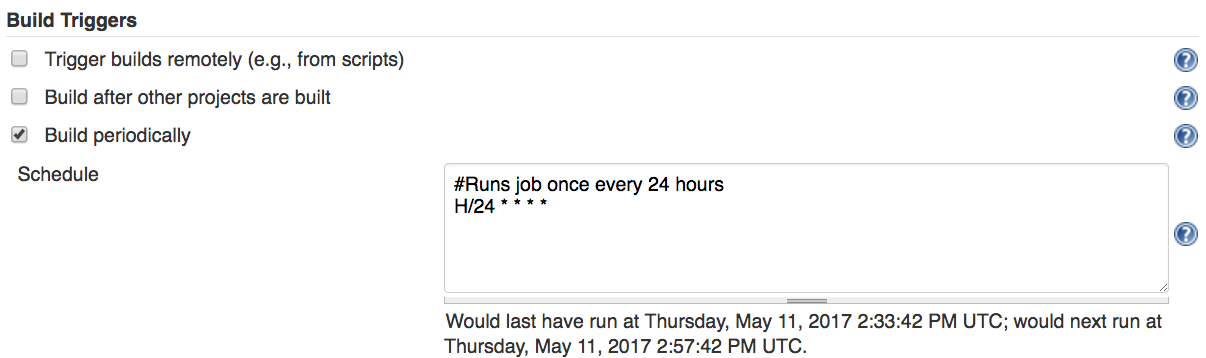
III. Set the project to build periodically

jenkins-set-trigger


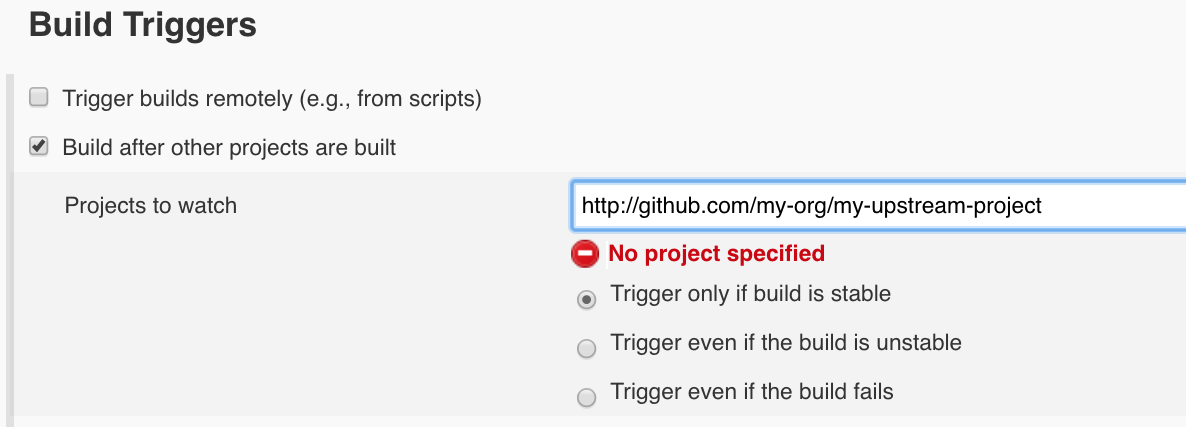
* Within the build settings of the job, choose the build periodically option and configure your job’s frequency.

Ideally, you would set this job to trigger once the task that builds and ‘ships’ your app completes successfully (thus, executing your tests every time a new version of the app is published).

Alternatively, to run periodically based on a given time, then enter something like ‘* 23 * * *’ into Jenkins’ cron configuration field to set your job to run once every day (in this case, at 11 PM, relative to your server’s configuration).

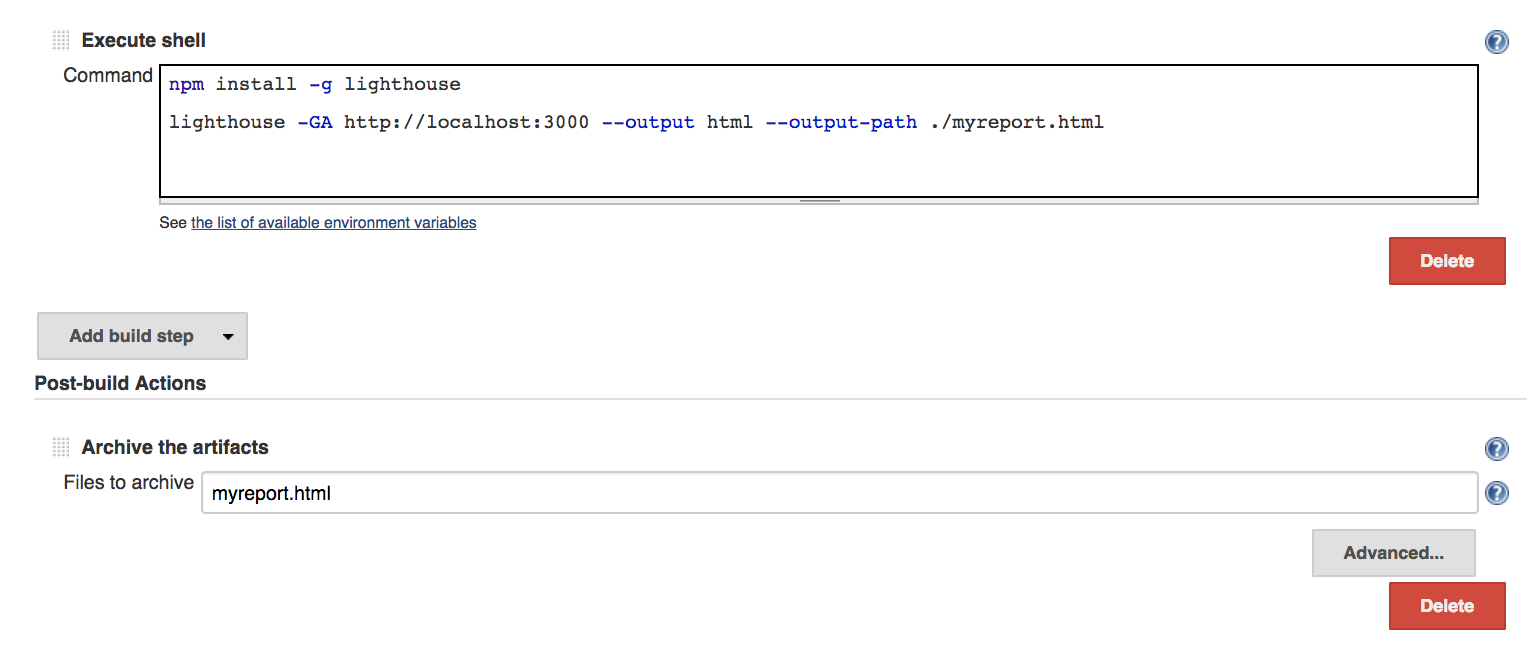
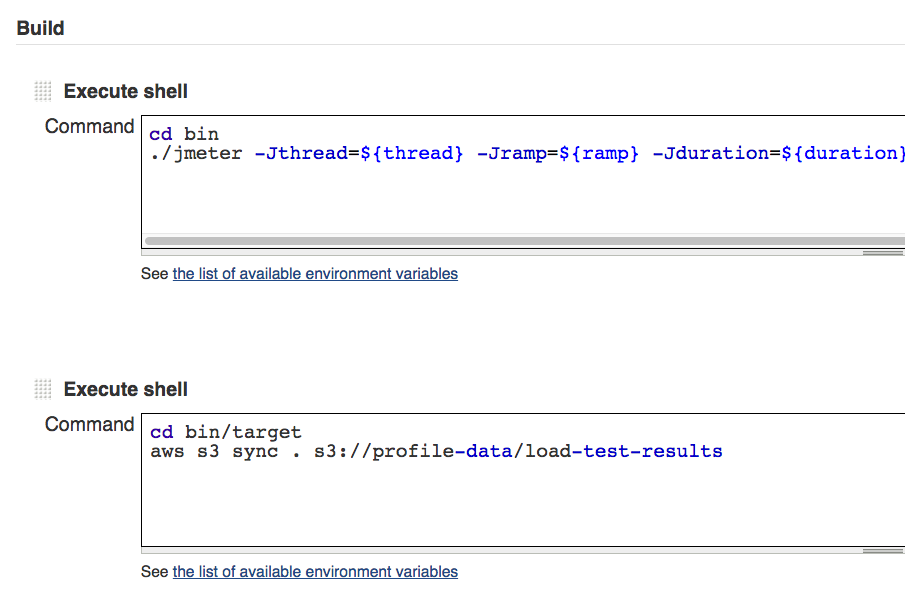
IV. Build your shell execution script

jenkins-shell-script


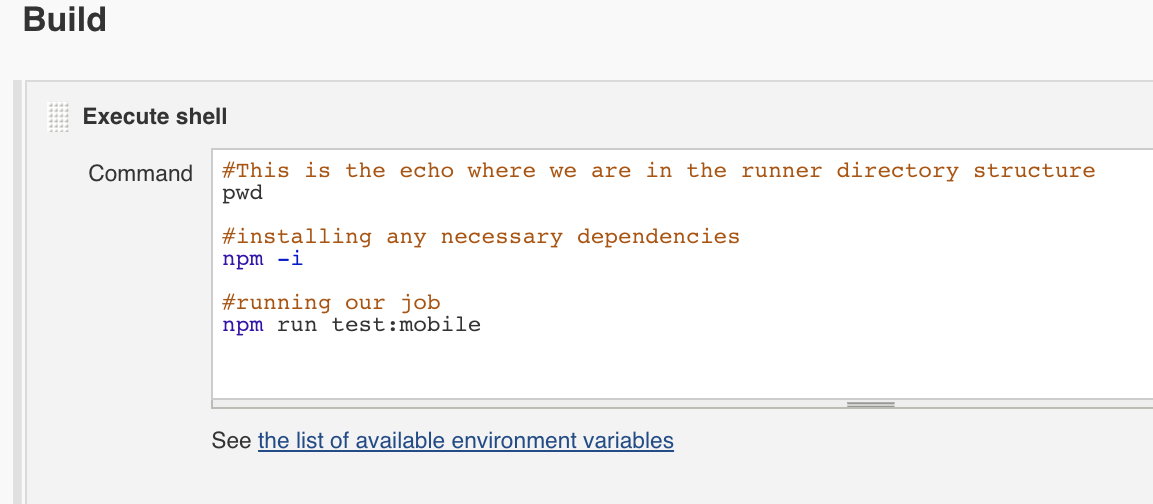
* Create a build step and for your task and choose the shell script option.  You can embed your npm test script execution here.

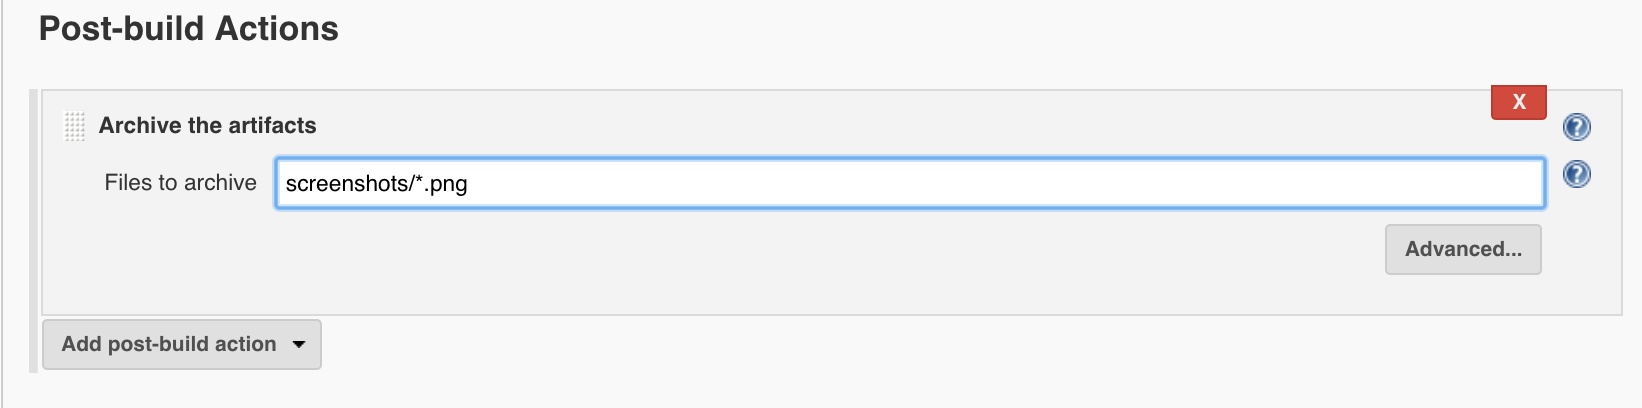
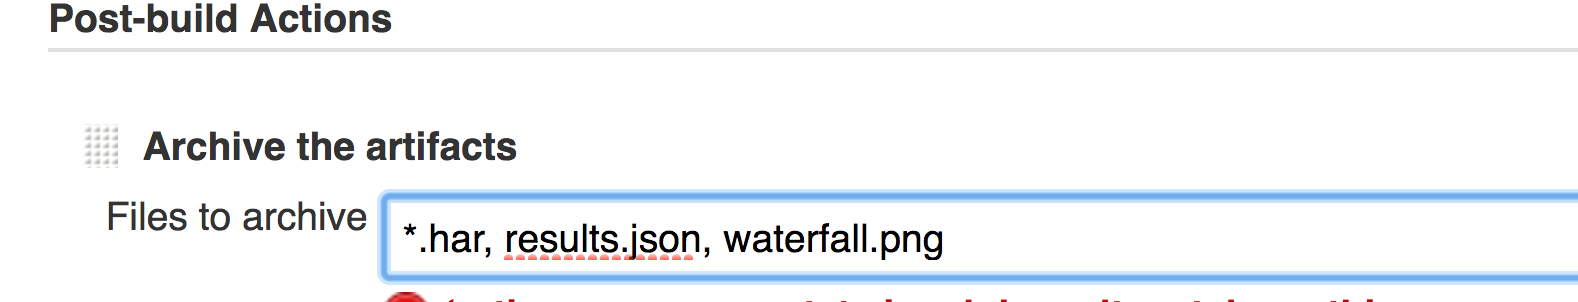
V. Collect your artifacts

From the list of post build options, choose the ‘archive artifacts’ option.  In the available text field, enter the path to the generated screen shots you wish to capture.  Note that this path may differ depending on how your Jenkins server is configured.  If you’re having trouble pinpointing the exact path to your artifacts, echo the ‘pwd’ command in your shell script step to have the job list your working directory in the job’s console output then work from there.

jenkins-archive

VI. Sending email notifications

jenkins-email-config


* Lastly, choose from the post build options menu the advanced email notification option.

Enter an email or list of email addresses you wish to contact once this job completes.  Fill out your email settings (subject line, body, etc.) and be sure to enter the path to the screen resources you will wish to attach to a given email.

Save your changes and you are ready to go!

This job will run on a regular basis, execute a given set of UI specific tests and send screen capture information to inquiring team members who would want to know.

You can create more nuanced runs but using Jenkins’ clone feature to copy this job, altering to run your mobile-specific tests, diversifying your test runs.

Further Reading

If you’re looking to dive further into visual regression testing, there are several code examples online worth reviewing.

Additionally, there are other visual regression testing services worth investigating such as Percy.IO, Screener.IO and Fluxguard.

Looking Good While Testing: Automated Testing With a Visual Regression Service

A lot of (virtual) ink has been spilled on this blog about automated testing (no, really). This post is another in a series of dives into different automated testing tools and how you can use them to deliver a better, higher-quality web application.

Here, we’re going to focus on tools and services specific to ‘visual regression testing‘ – specifically cross-browser visual testing of an application front end.

What?

By visual regression testing, we mean regression testing applied specifically to an app’s appearance may have changed across browsers or over time as opposed to functional behavior.

Why?

One of the most common starting points in testing a web app is to simply fire up a given browser, navigate to the app in your testing environment, and note any discrepancy in appearance (“oh look, the login button is upside down. Who committed this!?”).

american_psycho

A spicy take on how to enforce code quality – we won’t be going here.


The strength of visual regression testing is that you’re testing the application against a very humanistic set of conditions (how does the application look to the end user versus how it should look). The drawback is that doing this is generally time consuming and tedious.  But that’s what we have automation for!

hamburger_ad_vs_reality

How our burger renders in Chrome vs how it renders in IE 11…

How?

A wise person once said, ‘In software automation, there is no such thing as a method call for “if != ugly, return true”‘.

For the most part – this statement is true. There really isn’t a ‘silver bullet’ for the software automation problem of fully automating testing the appearance of your web application across a given browser support matrix.  At least not with some caveats.

The methods and tools for doing so can run afoul of at least one of the following:

  • They’re Expensive (in terms of time, money or both)
  • They’re Fragile (tests emit false negatives, can be unreliable)
  • They’re Limited (covers only a subset of supported browsers)
faberge_egg

Sure, you can support delicate tools. Just keep in mind the total cost.


Tools

We’re going to show how you can quickly set up a set of tools using WebdriverIO, some simple JavaScript test code and the visual-regression-service module to create snapshots of your app front end and perform a test against its look and feel.

Setup

Assuming you already have a web app ready for testing in your choice of environment (hopefully not in production) and that you are familiar with NodeJS, let’s get down to writing our testing solution:

interesting_man_tests_code

This meme is so old, I can’t even…


1. From the command line, create a new project directory and do the following in order:

  • ‘npm init’ (follow the initialization prompts – feel free to use the defaults and update them later)
  • ‘npm install –save-dev webdriverio’
  • ‘npm install –save-dev wdio-visual-regression-service’
  • ‘npm install –save-dev chai’

2. Once you’ve finished installing your modules, you’ll need to configure your instance of WebdriverIO. You can do this manually by creating the file ‘wdio.conf.js’ and placing it in your project root (refer to the WebdriverIO developers guide on what to include in your configuration file) or you can use the wdio automated configuration script.

3. To quickly configure your tools, kick off the automated configuration script by running ‘npm run wdio’ from your project root directory.  During the configuration process, be sure to select the following (or include this in your wdio.conf.js file if you’re setting things up manually):

  • Under frameworks, be sure to enable Mocha (we’ll use this to handle things like assertions)
  • Under services be sure to enable the following:
    • visual-regression
    • Browserstack (we’ll leverage Browserstack to handle all our browser requests from WebdriverIO)

Note that in this case, we won’t install the selenium standalone service or any local testing binaries like Chromedriver. The purpose of this exercise is to quickly package together some tools with a very small footprint that can handle some high-level regression testing of any given web app front end.

Once you have completed the configuration script, you should have a wdio.conf.js file in your project configured to use WebdriverIO and the visual-regression service.

Next, we need to create a test.

Writing a Test

First, make a directory within your project’s main source called tests/. Within that directory, create a file called homepage.js.

Set the contents of the file to the following:

describe('home page', () => {
  beforeEach(function () {
  browser.url('/');
});

it('should look as expected', () => {
browser.checkElement('#header');
});
});

That’s it. Within the single test function, we are calling a method from the visual-regression service, ‘checkElement()’. In our code, we are providing the ID, ‘header’ as an argument but you should replace this argument with the ID or CSS selector of a container element on the page you wish to check.

When executed, WebdriverIO will open the root URL path it is provided for our web application then will execute its check element comparison operation. This will generate a series of reference screen shots of the application. The regression service will then generate screen shots of the app in each browser it is configured to test with and provide a delta between these screens and the reference image(s).

A More Complex Test:

You may have a need to articulate part of your web application before you wish to execute your visual regression test. You also may need to execute the checkElement() function multiple times with multiple arguments to fully vet your app front end’s look and feel in this manner.

Fortunately, since we are simply inheriting the visual regression service’s operations through WebdriverIO, we can combine WebriverIO-based method calls within our tests to manipulate and verify our application:

describe('home page', () => {
  beforeEach(function () {
  browser.url('/');
  });

  it('should look as expected', () => {
    browser.waitForVisible('#header');
    browser.checkElement('#header');
  });

  it('should look normal after I click the button, () => {
    browser.waitForVisible('.big_button');
    browser.click('.big_button');
    browser.waitForVisible('#main_content');
    browser.checkElement('#main_content');
  });

  it('should have a footer that looks normal too, () => {
    browser.scroll('#footer');
    browser.checkElement('#footer');
  });
});

Broad vs. Narrow Focus:

One of several factors that can add to the fragility of a visual test like this is attempting to account for minor changes in your visual elements. This can be a lot to bite off and chew at once.

Attempting to check the content of a large and heavily populated container (e.g. the body tag) is likely going to contain so many possible variations across browsers that your test will always throw an exception. Conversely, attempting to narrow your tests’ focus to something very marginal (e.g. selecting a single instance of a single button) may never be touched by code implemented by front end developers and thus, you may be missing crucial changes to your app UI.

flight_search_results

This is waaay too much to test at once.


The visual-regression service’s magic is in that it allows you to target testing to specific areas of a given web page or path within your app – based on web selectors that can be parsed by Webdriver.

price_link

And this is too little…


Ideally, you should be choosing web selectors with a scope of content that is not too large nor too small but in between. A test that focuses on comparing content of a specific div tag that contains 3-4 widgets will likely deliver much more value than one that focuses on the selector of a single button or a div that contains 30 widgets or assorted web elements.

Alternately, some of your app front end may be generated by templating or scaffolding that never received updates and is siloed away from code that receives frequent changes from your team. In this case, marshalling tests around these aspects may result in a lot of misspent time.

menu_bar

But this is just about right!


Choose your area of focus accordingly.

Back to the Config at Hand:

Before we run our tests, let’s make a few updates to our config file to make sure we are ready to roll with our initial homepage verification script.

First, we will need to add some helper functions to facilitate screenshot management. At the very top of the config file, add the following code block:

var path = require('path');
var VisualRegressionCompare = require('wdio-visual-regression-service/compare');

function getScreenshotName(basePath) {
  return function(context) {
    var type = context.type;
    var testName = context.test.title;
    var browserVersion = parseInt(context.browser.version, 10);
    var browserName = context.browser.name;
    var browserViewport = context.meta.viewport;
    var browserWidth = browserViewport.width;
    var browserHeight = browserViewport.height;
 
    return path.join(basePath, `${testName}_${browserName}_v${browserVersion}_${browserWidth}x${browserHeight}.png`);
  };
}

This function will be utilized to build the paths for our various screen shots we will be taking during the test.

As stated previously, we are leveraging Browserstack with this example to minimize the amount of code we need to ship (given we would like to pull this project in as a resource in a Jenkins task) while allowing us greater flexibility in which browsers we can test with. To do this, we need to make sure a few changes in our config file are in place.

Note that if you are using a different browser provisioning services (SauceLabs, Webdriver’s grid implementation), see WebdriverIO’s online documentation for how to set you wdio configuration for your respective service here).

Open your wdio.conf.js file and make sure this block of code is present:

user: process.env.BSTACK_USERNAME,
key: process.env.BSTACK_KEY,
host: 'hub.browserstack.com',
port: 80,

This allows us to pass our browser stack authentication information into our wdio script via the command line.

Next, let’s set up which browsers we wish to test with. This is also done within our wdio config file under the ‘capabilities’ object. Here’s an example:

capabilities: [
{
  browserName: 'chrome',
  os: 'Windows',
  project: 'My Project - Chrome',
  'browserstack.local': false,
},
{
  browserName: 'firefox',
  os: 'Windows',
  project: 'My Project - Firefox',
  'browserstack.local': false,
},
{
  browserName: 'internet explorer',
  browser_version: 11,
  project: 'My Project - IE 11',
  'browserstack.local': false,
},
],

Where to Put the Screens:

While we are here, be sure you have set up your config file to specifically point to where you wish to have your screen shots copied to. The visual-regression service will want to know the paths to 4 types of screenshots it will generate and manage:

lots_a_screens

Yup… Too many screens


References: This directory will contain the reference images the visual-regression service will generate on its initial run. This will be what our subsequent screen shots will be compared against.

Screens: This directory will contain the screen shots generated per browser type/view by tests.

Errors: If a given test fails, an image will be captured of the app at the point of failure and stored here.

Diffs: If there is a given comparison performed by the visual-regression service between an element from a browser execution and the reference images which results in a discrepancy, a ‘heat-map’ image of the difference will be capture and stored here. Consider the content of this directory to be your test exceptions.

Things Get Fuzzy Here:

fozzy

Fuzzy… Not Fozzy


Finally, before kicking off our tests, we need to enable our visual-regression service instance within our wdio.conf.js file. This is done by adding a block of code to our config file that instructs the service on how to behave. Here is an example of the code block taken from the WebdriverIO developer guide:

visualRegression: {
  compare: new VisualRegressionCompare.LocalCompare({
    referenceName: getScreenshotName(path.join(process.cwd(), 'screenshots/reference')),
    screenshotName: getScreenshotName(path.join(process.cwd(), 'screenshots/screen')),
    diffName: getScreenshotName(path.join(process.cwd(), 'screenshots/diff')),
    misMatchTolerance: 0.20,
  }),
  viewportChangePause: 300,
  viewports: [{ width: 320, height: 480 }, { width: 480, height: 320 }, { width: 1024, height: 768 }],
  orientations: ['portrait'],
},

Place this code block within the ‘services’ object in your file and edit it as needed. Pay attention to the following attributes and adjust them based on your testing needs:

‘viewports’:
This is a JSON object that provides width/height pairs to test the application at. This is very handy if you have an app that has specific responsive design constraints. For each pair, the test will be executed per browser – resizing the browser for each set of dimensions.

‘orientations’: This allows you to configure the tests to execute using portrait and/or landscape view if you happen to be testing in a mobile browser (default orientation is portrait).

‘viewportChangePause’: This value pauses the test in milliseconds at each point the service is instructed to change viewport sizes. You may need to throttle this depending on app performance across browsers.

‘mismatchTolerance’: Arguably the most important setting there. This floating-point value defines the ‘fuzzy factor’ which the service will use to determine at what point a visual difference between references and screen shots should fail. The default value of 0.10 indicates that a diff will be generated if a given screen shot differs, per pixel from the reference by 10% or more. The greater the value the greater the tolerance.

Once you’ve finished modifying your config file, lets execute a test.

Running Your Tests:

Provided your config file is set to point to the root of where your test files are located within the project, edit your package.json file and modify the ‘test’ descriptor in the scripts portion of the file.

Set it to the following:

‘./node_modules/.bin/wdio /wdio.desktop.conf.js’

To run your test, from the command line, do the following:

‘BSTACK_USERNAME= BSTACK_KEY= npm run test — –baseUrl=’

Now, just sit back and wait for the test results to roll in. If this is the first time you are executing these tests, the visual-regression service can fail while trying to capture initial references for various browsers via Browserstack. You may need to increase your test’s global timeout initially on the first run or simply re-run your tests in this case.

Reviewing Results:

If you’re used to your standard JUnit or Jest-style test execution output, you won’t necessarily similar test output here.

If there is a functional error present during a test (an object you are attempting to inspect isn’t available on screen) a standard Webdriver-based exception will be generated. However, outside of that, your tests will pass – even if a discrepancy is visually detected.

However, examine your screen shot folder structure we mentioned earlier. Note the number of files that have been generated. Open a few of them to view what has been capture through IE 11 vs. Chrome while testing through Browserstack.

Note that the files have names appended to them descriptive of the browser and viewport dimensions they correspond to.

example1

Example of a screen shot from a specific browser


Make note if the ‘Diff’ directory has been generated. If so, examine its contents. These are your test results – specifically, your test failures.

example2

Example of a diff’ed image


There are plenty of other options to explore with this basic set of tooling we’ve set up here. However, we’re going to pause here and bask in the awesomeness of being able to perform this level of browser testing with just 5-10 lines of code.

Is there More?

This post really just scratches the surface of what you can do with a set of visual regression test tools.  There are many more options to use these tools such as enabling mobile testing, improving error handling and mating this with your build tools and services.

We hope to cover these topics in a bit more depth in a later post.   For now, if you’re looking for additional reading, feel free to check out a few other related posts on visual regression testing here, here and here.

Auditing your Web App for Accessibility with Lighthouse

If you’ve followed our blog for some time, you’ve likely encountered posts detailing how to engage in various kinds of software testing, from performance to data-driven to security and more.

This post continues that trend with a focus on testing your site for accessibility.

What is Accessibility?

All Access Badge


If you are unfamiliar with the concept, accessibility, within the realm of web applications is a term that covers a wide range of concerns. The primary focus is codifying and helping to reinforce design standards that ensure the web is accessible to all – regardless of people’s ability to consume and interact with it.

This is a very large topic and its definition is beyond the scope of this blog post’s intent. If you’re looking for a starting point however, our friends at W3C.org can help you with that: https://www.w3.org/standards/webdesign/accessibility

If you want to cut to the chase, there are two major accessibility standards you should be aware of (and are generally considered the path toward compliance). Both of these are supported and covered by the W3C as international standards and can be reviewed in full here:

You can also visit this link for some related coding examples.

Why Accessibility?

Why should everyone be concerned with accessibility design issues?  The short answer can be found from this quite from Sir Tim Berners-Lee, via the W3C:

“The power of the Web is in its universality.
Access by everyone regardless of disability is an essential aspect.”

A more complex answer is that, as the web reaches more and more global ubiquity, we as software creators need to take into account the range of needs to access the web from all users. This is simply fair play as web technology has matured and become evermore essential to our daily lives. There are also legal ramifications for not taking accessibility into account. Here are some examples:

How Accessible is my Site?

If you’ve closely followed the design principles of WCAG 2.0, then your web application front end should be compliant with most modern accessibility software such as screen readers. However it’s difficult to verify your app’s end-user experience in this regard without actually sitting down with a browser, your app, some third-party tools and applying some old-fashioned manual testing.

The challenge with this – you’re likely already thinking – is that this is time consuming and labor intensive. If you are on a small software team or have a very tight deadline (or both), this level of manual testing might be a hard (but necessary) pill for your product team to swallow.

There are 3rd party services that can perform this level of testing for you. A quick google search can get you started down this path. However, if hiring a 3rd party is either logistically or financially out of reach, there are plenty of software tools that can help take the sting out of accessibility verification.

Chrome is your Friend (Really)?

As of this blog post, Google’s Chrome browser currently accounts for about 1/2 of all worldwide browser usage on the web. Chrome however is not only popular, it also has a lot of helpful tools under the hood to aid in web development.

In fact, you can use your basic, desktop version of Chrome to perform an accessibility audit of a given site you happen to have open in your browser. To try this trick out, simply do the following:

  • Open your browser to a given site you wish to audit
  • Open the Chrome developer tools console
  • Under the developer console tabs, (e.g. Network, Elements, Console, etc.) search for and click on the Audits tab.
  • Click the Perform Audit option, select Accessibility and click Run Audit to begin.
chrome a11y audit screenshot

Look what we found under the hood!


The audit tool in this case will scan the contents of the site at the current URL you have open for markup patterns that support accessibility standards (e.g. proper element naming conventions, css settings, etc.) and flag patterns within the markup on the page that violate these standards. These of course are based on the WCAG and AIRA conventions mentioned at the beginning of this post.

This is a powerful but very easy to access and run set of tools for web developers (you can perform several kinds of audits, not just ones for accessibility). So easy in fact, you might be thinking that there must be a way to program these tools (and you would be right).

Illuminating Accessibility with Lighthouse!

Once you started the audit within Chrome, you might have noticed a message stating that something called Lighthouse was starting up, prior to the audit being executed.

Lighthouse in fact, is the engine that performs the audit. It’s also available as a library dependency or even its own stand-alone project.

Lighthouse can be incorporated into your project front end or build cycle in several ways. One of those is to use the Lighthouse as a standalone analyzation tool which you can use to verify the front end of your web app post deployment (think of this as another set of functional tests with a different, specific kind of output – in this case, an accessibility report.

You can get Lighthouse running locally via command line quickly by doing the following (assuming you have NodeJS installed):

1. Open a new terminal and do, npm install -g lighthouse
2. Once the latest version of lighthouse is installed, do, lighthouse "url of choice" -GA —output html —output-path ./report.html

Once the above command executes and finishes, you can open your Lighthouse report.html locally in your web browser:

Lighthouse Report

Lighthouse Report


Drill down into the different segments of the report to see what best practices you are following for accessibilityy (or performance, SEO or other web standards) and where you should target to improve your app.

Jenkins Configuration

Jenkins configuration for Lighthouse


To include this report within your CI build process, just add the above Node command line statements to a shell script attached to your job of choice and make sure to archive the results (if configuring this in a Jenkins task, your job config will probably look something like this:)

Accessibility Linting?

By default, the report Lighthouse provides is expansive and may take a while to read through.

Fortunately, there are several options to move this form of testing further upstream. In this case, we are going to look at a small, open source project called Lightcrawler.

Lightcrawler allows you to call specific audit aspects of Lighthouse from within your NodeJS project. The benefit of doing this is that you can more specifically target what you are auditing and perform said audits before you ship your project through to the rest of your CI process.

You can install Lightcrawler into your project by simply doing npm install —save-dev lightcrawler.

Next, given your Node app is configured with a script that will generate and run the app locally, simply add this to your “scripts” portion of your app’s package.json file:

”audit:a11y”: "./node_modules/.bin/lightcrawler --url=http://localhost:8080 --config lighthouse-config.json",

With Lightcrawler you can configure an accessibility audit in a variety of ways that can meet your project needs. For the purpose of this post, we will configure Lightcrawler to run only tests classified within an accessibility audit, and to run all tests of that type currently available. Here is our configuration file:

{
  "extends": "lighthouse:default",
  "settings": {
    "crawler": {
      "maxDepth": 1,
      "maxChromeInstances": 5
    },
    "onlyCategories": [
      "Accessibility"
    ],
    "onlyAudits": [
      "accesskeys",
      "aria-allowed-attr",
      "aria-required-attr",
      "aria-required-parent",
      "aria-required-childres",
      "aria-roles",
      "aria-valid-attr-value",
      "audio-caption",
      "button-name",
      "bypass",
      "color-contrast",
      "definition-list",
      "dlitem",
      "document-title",
      "duplicate-id",
      "frame-title",
      "html-has-lang",
      "html-lang-valid",
      "image-alt",
      "input-image-alt",
      "lable",
      "layout-table",
      "link-name",
      "list",
      "list-item",
      "meta-refresh",
      "meta-viewport",
      "object-alt",
      "tabindex",
      "td-headers-attr",
      "th-has-data-cells",
      "valid-lang",
      "video-caption",
      "video-description"
    ]
  }
}

You can copy the JSON above and save it as lightcrawler.conf.js within your project directory and direct your script to the config file’s path.

Test out your newly added audit script but running npm run audit:a11y. If everything is in working order, you should receive a command line output detailing the number of audits executed by Lightcrawler and error output for any given audit tests that may have failed (and more importantly, why).

Lightcrawler Console Output

Lightcrawler Console Output


This may look similar to linting report output from something like Prettier or ESLint.  Similar to the way Prettier or ESLint are used in pre-commit hooks within your project, you could add a Lightcrawler script to your pre-commit hook in order to better safeguard your application code from possible accessibility violations.

Beyond Auditing and Linting!

This should give you some ideas as to how you can reduce the overall effort required to deliver your apps’ web front end while still maintaining accessibility.  By no means are the handful of tips presented here deep enough to fully cover everything under the accessibility umbrella.  That task will require significant time and effort but, in keeping with the web’s initial intent of inclusivity and connectivity, one we as software developers should strive toward.

Getting Started with Dependency Security and NodeJS

Internet security is a topic that receives more attention every day.  If you’re reading this article in early 2018, issues like Meltdown, Specter and the Equifax breach are no doubt fresh in your mind.

Cybersecurity is a massive concern and can seem overwhelming.  Where do you start?  Where do you go?  What do you do if you’re a small application team with limited resources?  How can you better engineer your projects with security in mind?

Tackling the full gestalt of this topic, including OWASP and more is beyond the scope of this article. However, if you’re involved in a small front end team, and if you leverage services like AWS, have gone through the OWASP checklist and are wondering, ‘what now?’, this article is for you (especially if you are developing in NodeJS, which we’ll focus on in this article).

Let’s Talk About Co(de) Dependency:

A tiger and her baby pigs

We’re talking about claiming dependents right?


One way we can quickly impact the security of our applications is through better dependency management.  Whether you develop in Python, JavaScript, Ruby or even compiled languages like Java and C#, library packages and modules are part of your workflow.

Sure, it’s 3rd party code but that doesn’t mean it can’t have a major impact on your project (everyone should remember the Leftpad ordeal from just a few years ago).

As it turns out, your app’s dependencies can be your app’s greatest vulnerability.

Managing Code you Didn’t Write:

Below, we’ll outline some steps you can take to tackle at least one facet of secure development – dependency management.  In this article, we’ll cover how you can implement a handful of useful tools into a standard NodeJS project to protect, remediate and warn against potential security issues you may introduced into your application via its dependency stack.

Your code has issues

We’ve all had to deal with other people’s problematic code at one time or another


Using Dependency-Check:

Even if you’re not using NodeJS, if you are building any project that inherits one or more libraries, you should have some form of dependency checking in place for that project.

For NodeJS apps, Dependency-Check is the easiest, lowest-hanging fruit you can likely reach for to better secure your development process.

Dependency-Check is a command-line tool that can scan your project and warn you of any modules being included in your app’s manifest but not actually being utilized in any functioning code (e.g. modules listed in your package.json file but never ‘required’ in any class within your app).  After all, why import code that you do not require?

Installation is a snap.  From your project directory you can:

Npm install –g dependency-check

dependency-check package.json –unused

If you have any unused packages, Dependency-Check will warn you via a notice such as:

Fail! Modules in package.json not used in code: chai, chai-http, mocha

Armed with a list of any unused packages in hand, you can prune your application before pushing it to production.  This tool can be triggered within your CI process per commit to master or even incorporated into your project’s pre-commit hooks to scan your applications further upstream.

RetireJS:

‘What you require, you must retire’ as the saying goes – at least as it does when it comes to RetireJS.  Retire is a suite of tools that can be used for a variety of application types to help identify dependencies your app has incorporated that have known security vulnerabilities.

Retire is suited for JavaScript based projects in general, not just the NodeJS framework.

For the purpose of this article, and since we are dealing primarily with the command line, we’ll be working with the CLI portion of Retire.

npm install -g retire

then from the root of your project just do:

retire 

If you are scanning a NodeJS project’s dependencies only, you can narrow the scan by using the following arguments:

retire  —nopdepath 

By default, the tool will return something like the following, provided you have vulnerabilities RetireJS can identify:

ICanHandlebarz/test/jquery-1.4.4.min.js 
↳ jquery 1.4.4.min has known vulnerabilities: 
http://web.nvd.nist.gov/view/vuln/detail?vulnId=CVE-2011-4969 
http://research.insecurelabs.org/jquery/test/ 
&lt;a href="http://bugs.jquery.com/ticket/11290"&gt;
http://bugs.jquery.com/ticket/11290</a>

Retire scans your app and compares packages used within it with an updated online database of packages/package versions that have been identified by the security world as having exploitable code.

Note the scan output above identified that the version of jquery we have imported via the ICanHandlebarz module has a bug that is exploitable by hackers (note the link to CVE-2011-4969 – the exploit in question).

Armed with this list, we can identify any unnecessary dependencies within our app, as well as any exploits that could be utilized given the code we are currently importing and using.

NSP:

There are a multitude of package scanning utilities for NodeJS apps out on the web. Among them, NSP (Node Security Platform) is arguably the most popular.

Where the previously covered Retire is a dependency scanner suited for JavaScript projects in general, NSP, as the name implies, is specifically designed for Node applications.

The premise is identical: this command line tool can scan your project’s package manifest and identify any commonly known web exploits that can be leveraged given the 3rd party packages you have included in your app.

Utilizing NSP and Retire may sound redundant but, much like a diagnosing a serious condition via medical professional, it’s often worth seeking a second opinion.  It’s also equally easy to get up and running with NSP:

npm install -g nsp

nsp check —reporter &lt;Report type (e.g. HTML)&gt;

Running the above within the root of your node application will generate a report in your chosen output format

Again, wiring this up into a CI job should be straightforward.  You can even perform back-to-back scans using both Retire and NSP.

Snyk:

Yes, this is yet another dependency scanner – and like NSP, another one that specifically NodeJS oriented but with an added twist: Snyk.

Snyk home page

Snyk home page


With Retire and NSP, we can quickly and freely generate a list of vulnerabilities our app is capable of having leveraged against it.  However, what of remediation?  What if you have a massive Node project that you may not be able to patch or collate dependency issues on quickly?  This is where Snyk comes in handy.

Snyk can generate detailed and presentable reports (perfect for team members who may not be elbow deep in your project’s code).  The service also provides other features such as automated email notifications and monitoring for your app’s dependency issues.

Typical Snyk report

Typical Snyk report


Cost: Now, these features sound great (they also sound expensive).  Snyk is a free service, depending on your app’s size.  For small projects or open source apps, Snyk is essentially free.  For teams with larger needs, you will want to consult their current pricing.

To install and get running with Snyk, first visit https://snyk.io and register for a user account (if you have a private or open source project in github or bitbucket, you’ll want to register your Snyk account with your code management tool’s account.

Next, from your project root in the command line console:

npm install -g snyk

snyk –auth

Read through the console prompt.  Once you receive a success message, your project is now ready to report to your Snyk account.  Next:

Snyk test

Once Snyk is finished you will be presented with a URL will direct you to a report containing all vulnerable dependency information Snyk was able to find regarding your project.

The report is handy in that it not only identifies vulnerabilities and the packages they’re associated with but also steps for remediation (e.g. – update a given package to a specific version, remove it, etc.).

Snyk has a few more tricks up its sleeve as well.  If you wish to dive headlong into securing your application. Simply run:

Snyk wizard

This will rescan your application in an interactive wizard mode that will walk you through each vulnerable package and prompt you for actions to take for each vulnerable package.

Note, it is not recommended to use Snyk’s wizard mode when dealing with large scale applications due to it being very time consuming.

It will look like this:

Snyk monitor output

Snyk monitor output


Additionally, you can utilize Snyk’s monitoring feature which, in addition to scanning your application, will send email notifications to you or your team when there are updates to vulnerable packages associated with your project.

Putting it all together in CI:

Of course we’re going to arrange these tools into some form a CI instance.  And why not?  Given we have a series of easy-to-implement command line tools, adding these to part of our project’s build process should be straight forward.

Below is an example of a shell script we added as a build step in a Jenkins job to install and run each of these scan tools as well as output some of their responses to artifacts our job can archive:

#Installs our tools
npm install -g snyk
npm install -g dependency-check
npm install -g retire

#Runs dependency-check and outputs results to a text file
dependency-check ./package.json >> depcheck_results.txt

#Runs retire and outputs results to a text file
retire --nodepath node_modules >> retire_results.txt

#Authenticates use with Snyk
snyk auth $SNYK_TOKEN 

#Runs Snyk's monitor task and outputs results to a test file 
snyk monitor >> snyk_raw_monitor.txt

#Uses printf, grep and cut CLI tools to retrieve the Snyk report URL
#and saves that URL to a text file
printf http: >> snykurl.txt
grep https snyk_raw_monitor.txt | cut -d ":" -f 2 >> snykurl.txt
cat snykurl.txt

#Don't forget the set your post-job task in your CI service to save the above .txt
#files as artifacts for our security check run.

Note – depending on how you stage your application’s build lifecycle in your CI service, you may want to break the above script up into separate scripts within the job or separate jobs entirely. For example, you may want to scan your app using Dependency-Check for every commit but save your scan of your application using NSP or Snyk for only when the application is built nightly or deployed to your staging environment.  In which case, you can divide this script accordingly.

Note on Snyk:

In order to use Snyk in your CI instance, you will need to reference your Snyk authentication key when executing this tool (see the API key reference in the script).

This key can be passed as a static string to the job.  Your auth key for Snyk can be obtained by logging in at Snyk.io and retrieving your API key from the account settings page after clicking on the My Account link from Snyk’s main menu.

Next Steps:

This is only the tip of the iceberg when it comes to security and web application development.  Hopefully, this article has given you some ideas and hits of where to start in writing more secure software.  For more info on how to secure your Node-based apps, here’s some additional reading to check out:

Testing for Application Front End Performance with Web Page Test

taco-meter

‘Taco-meter’ – a device used to measure how quickly you can obtain tacos from your current location

If you’ve followed Bazaarvoice’s R&D blog, you’ve probably read some of our posts on web application performance testing with tools like Jmeter here and here.

In this post, we’ll continue our dive into web app performance, this time, focusing on testing front end applications.

API Response Time vs App Usability:

Application UI testing in general can be challenging as the cost of doing so (in terms of both time, labor and money) can become quite expensive.

In our previous posts highlighted above, we touched on testing RESTful APIs – which revolves around sending a set of requests to a target, measuring their response times and checking for errors.

For front-end testing, you could do the same – automate requesting the application’s front-end resources and then measuring their collective response times.  However, there are additional considerations for front end testing that we must account for – such as cross-browser issues, line speed constraints (i.e. broadband vs. a mobile 3G) as well as client side loading and execution (especially important for JavaScript).

Tools like Jmeter can address some of these concerns, though you may be limited in what can be measured.  Plugins for Jmeter that allow Webdriver API access exist but can be difficult to configure, especially in a CI environment (read through these threads from Stack Overflow on getting headless Webdriver to work in Jenkins for example).

There are 3rd party services available that are specialized for UI-focused load tests (e.g. Blazemeter) but these options can sometimes be expensive.  This may be too much for some teams in terms of time and money – especially if you’re looking for a solution for introductory, exploratory testing as opposed to something larger in scale.

Webpagetest.org:

Webpagetest.org is an open source project backed by multiple partners such as Google, Akamai and Fastly, among others.  You can check out the project’s github page here.

Webpagetest.org is a publicly available service.  Its main goal is to provide performance information for web applications, allowing designers and engineers to measure and improve application speed.

Let’s check out Webpagetest.org’s public facing page – note the URL form field.  We can try out the service’s basic reporting features by pasting the URL of a website or application into the field and submitting the form.  In this case, let’s test the performance of Bazaarvoice’s home page.

Before submitting the form however, note some of the additional options made available to us:

  • Browser type
  • Location
  • Number of tests
  • Connection
webpagetest.org form

Webpagetest.org’s initial submission form

This service allows us to configure our tests to simulate user requests from a slow, mobile, 3G device in the US to a desktop client with a fiber optic connection in Singapore (just to name a few).

Go ahead and submit the test form.  Once the test resolves, you’ll first notice the waterfall snapshot Webpagetest.org returns.  This is a reading of the application’s resources (images, JavaScript execution, external API calls, the works).  It should look very familiar if you have debugged a web site using a browser’s developer tools console.

webpagetest waterfall

Webpagetest.org’s waterfall report

This waterfall readout gives us a visual timeline of all the assets our web page must load for it to be active for the end user, in the order they are loaded, while recording the time taken to load and/or execute each element.

From here, we can determine which resources which have the longest load times, the largest physical foot prints and give us a clue as to how we might better optimize the application or web page.

Webpagetest.org’s content breakdown chart

In addition to our waterfall chart, our test results can provide any more data points, including but not limited to:

  • Content breakdown by asset type
  • CPU utilization
  • Bandwidth utilization
  • Screen shots and video capture of page load

Armed with this information from our test execution, you can begin to see where we might decide to make adjustment to our site to increase client-side performance.

Getting Programmatic:

Webpagetest.org’s web UI provides some great, easy-to-use features.  However, we can automated these tests using Webpagetest.org’s API.

In our next couple of steps, we’ll demonstrate how to do just that using Jenkins, some command line tools and Webpagetest.org’s public API, which you can read more about here.

Before Going Forward:

There are a few limitations or considerations regarding using Webpagetest.org and its API:

  • All test results are publicly viewable
  • API usage requires you to submit an email address to generate an API key
  • API requests are limited to 200 test runs per day
  • The maximum number of concurrent test runs allowed is 9

If test result confidentiality or scalability is a major concern, you may want to skip to the end of this article where we discuss using private instances of Webpagetest.org’s service.

Requirements:

 As mentioned above, we need an API key from Webpagetest.org. Just visit https://www.webpagetest.org/getkey.php and submit the form made available there.  You’ll then receive an email containing your API key.

Once you have your API key – lets set up a test using as CI service.  For this, like in our other test tutorials, we’ll be using Jenkins.

For this walkthrough, we’ll use the following:

  • Webpagetest’s public API
  • Jenkins
  • NodeJS (be sure your Jenkins instance has at least 1 server capable of using NodeJS 6 or above)
  • Webpagetest (a node module that provides a command-line wrapper for their API)
  • Jq-cli (a node module that provides JQ – a JSON query tool)
  • Wget-improved (a node implementation of the wget CLI tool – skip this if your Jenkins servers already have this binary installed).

Setting Up the Initial Job:

First, let’s get the Jenkins job up and running and make sure we can use it to reach our primary testing tool.

Do the following:

  • Log into Jenkins
  • Navigate to a project folder you wish your job to reside in
  • Click New Item
  • Give the job a name, select Freestyle Project from the menu and click OK

Now that the job is created, let’s set a few basic parameters:

  • Check ‘Discard old builds’
  • Set the Max # of Builds value to 100
  • Check the ‘Provide Node & npm bin/ folder to PATH’ option then choose your desired Node version (if this option is unavailable, see your system administrator).
jenkins-node

Specifying a NodeJs version for Jenkins to use

Next, let’s create a temporary build step to verify our job can reach Webpagetest.org

  • Click the ‘Add Build Step’ menu button
  • Select ‘Execute shell’
  • In the text box that appears, past in the following Curl command:
    •  curl http://webpagetest.org -s –f 
  • Save changes to your job and click the build option on the main job settings screen

Once the job has executed, click on the build icon and select the console output option.  Review the console output captured by Jenkins.  If you see HTML output captured at the end of the job, congratulations, your Jenkins instance can talk to Webpagetest.org (and its API).

Now we are ready to configure our actual job.

The Task at Hand:  

 The next steps will walk you through creating a test script.  The purpose of this script is as follows:

  • Install a few command line tools in our Jenkins instance when executed
  • Use these tools to execute a test using Webpagetest.org’s API
  • Determine when our test execution is complete
  • Collect and preserve our results in the following manner:
    • HAR (HTTP Archive)The entire test result data in JSON format
    • A PNG of our application’s waterfall
  • Filter our results for a specific element’s statistic we wish to know about

Adding Tools:

Click on the configure link for your job and scroll to the shell execution window.  Remove your curl command and copy the following into the window:

npm install -g webpagetest
npm install -g jq-cli-wrapper
npm install -g wget-improved

If you know that your Jenkins environments comes deployed with wget already installed, you can skip the last npm install command above.

Once this portion of the script executes, we’ll now have a command line tool to execute tests against Webpagetest’s API.  This wrapper makes it somewhat easier to work with the API, reducing the amount of syntax we’ll need for this script.

Next in our script, we can declare this command that will kick off our test:

webpagetest test $SITE -k $APIKEY -r $RUNS &gt; test_exec.json
&lt;span style="font-size: 1rem;"&gt;testId=$(cat test_exec.json | jq .data.testId)
&lt;/span&gt;testId="${testId%\"}"
testId="${testId#\"}"
echo $testId

This script block calls the API, passing it some variables (which we’ll get to in a minute) then saves the results to a JSON file.

Next, we use the command line tools cat and jq to sort our response file, assigning the testId key value from that file to a shell variable.  We then use some string manipulation to get rid of a few extraneous quotation marks in our variable.

Finally, we print the testId variable’s contents to the Jenkins console log.  The testId variable in this case should now be set to a unique string ID assigned to our test case by the API.  All future API requests for this test will require this ID.

Adding Parameters:

Before we go further, let’s address the 3 variables we mentioned above.  Using shell variables in the confines of the Jenkins task will give us a bit more flexibility in how we can execute our tests.  To finish setting this part up, do the following:

  • In the job configuration screen, scroll to and check the ‘This build is parameterized’ option.
  • From the dropdown menu, select String Parameter
  • In the name field, enter SITE
  • For the default field, enter a URL you wish to test (e.g. http://www.bazaarvoice.com)
  • Repeat this process for the APIKEY and RUNS variables
  • Set the RUNS parameter to a value of 1
  • Set the default value for the APIKEY parameter to your Webpagetest.org API key.

Save changes to your job and try running it.  See if it passes.  If you view the console output form the run, there’s probably not much you’ll find useful.  We have more work to do.

site-parameter

Your site parameter should look like this

Your runs parameter should look like this

And your key parameter should looks like this

Waiting in Line:

The next portion of our script is probably the trickiest part of this exercise.  When executing a test with the Webpagetest.org web form, you probably noticed that as your test run executes, your test is placed into a queue.

waiting

Cue the Jeopardy! theme…

Depending current API usage, we won’t be able to tell how long we may be waiting in line for our test execution to finish.  Nor will we know exactly how long a given test will take.

To account for that, next we’ll have to modify our script to poll the API for our test’s status until our test is complete.  Luckily, Webpagetest.org’s API provides a ‘status’ endpoint we can utilize for this.

Add this to your script:

webpagetest status $testId -o status.json
testStatus=$(cat status.json | jq .data.testsCompleted)

Using our API wrapper for webpage test and jq, we’re posting a request to the API’s status endpoint, with our test ID variable passed as an argument.  The response then is saved to the file, status.json.

Next, we use cat and jq to filter the content of status.json, returning the contents of the ‘testsCompleted’ (which is a child of the ‘data’ node) within that file.  This gets assigned to a new variable – testStatus.

Still Waiting in Line:


long line

Just like going to the DMV

The response returned when polling the status endpoint contains a key called ‘status’ with possible values set to ‘In progress’ or ‘Completed’.  This seems like the perfect argument we would want to check to monitor our test status.However, in practice, this key-value pair can be set prematurely – returning a value of ‘Completed’ when not necessarily every run within our test set has finished.  This can result in our script attempting to retrieve an unfinished test result – which would be partial or empty.

After some trial and error, it turns out that reading the ‘testsCompleted’ key from the status response is a more accurate read as to the status of our tests.  This key contains an integer value equal to the number of test runs you specified that have completed execution.

Add this to your script:

while [ "$testStatus" != "$RUNS" ]
do
sleep 10
webpagetest status $testId -o status.json
testStatus=$(cat status.json | jq .data.testsCompleted)
done

This loop compares the number of tests completed with the number of runs we specified via our Jenkins string variable, $RUNS.

While those two variables are not equal, we request our test’s status, overwrite the status.json file with our new response, filter that file again with jq and assign our updated ‘testsCompleted’ value to our shell variable.

Note that the 10 second sleep command within the loop is optional.  We added that as to not overload the API with requests every second for our test’s status.

Once the condition is met, we know that the number of tests runs we requested should be the same number completed. We can now move on.

Getting The Big Report:

Once we have passed our while loop, we can assume that our test has completed.  Now we simply need to retrieve our results:

webpagetest har $testId -o results.har

webpagetest results $testId -o results.json

Webpagetest’s API provides multiple options to retrieve result information for any given test.  In this case, we are asking the API to give us the test results via HAR format.

Note – if you wish to deliver your test results in HAR format, you will need a 3rd party application or service to view .har files.  There are several options available including stand-alone applications such as Charles Proxy and Har Viewer.

Additionally, we are going to retrieve the test results from our run using the API’s results endpoint and assign this to a JSON file – results.json.

Now would be a great time to save the changes we’ve made to your test.

Getting the Big Picture:

Next, we want to retrieve the web application’s waterfall image – similar to what was returned when executing our test via the Webpagetest.org web UI.

To do so, add this to your script:

waterfallImage=$(cat results.json | jq '.data.runs."1".firstView'.images.waterfall)
waterfallImage="${waterfallImage%\"}"
waterfallImage="${waterfallImage#\"}"
nwget $waterfallImage -O waterfall.png

Since we’ve already retrieved our test results and saved them to the results.json file, we simply need to filter this file for a key-value pair that contains the URL for where our waterfall snapshot resides online.

In the results.json file, the main parent that contains all test run information is the ‘data’ node.  Within that node, our results are divided up amongst each test run.  Here we will further filter our results.json object based on the 1st test run.

Within that test run’s ‘firstView’ node, we have an images node that contains our waterfall image.

We then assign the value of that node to another shell variable (and then use some string manipulation to trim off some unnecessary leading and ending quotation characters).

Finally, as we installed the nwget module at the beginning of this script, we invoke it, passing the URL of our waterfall image as an argument and the option to output the result to a PNG file.

Archiving Results:

Upon each execution, we wish to save our results files so that we can build a collection of historical data as we continue to build and test our application.  Doing this within Jenkins is easy

Just click on the ‘Add Post Build Action’ button within the Jenkins job configuration menu and select ‘Archive the artifacts’ from the menu.

In the text field provided for this new step, enter ‘*.har, results.json, waterfall.png’ and click save.

Now, when you run your test job – once the script succeeds, it will save each instance of our retrieved HAR, waterfall image and results.json file to each respective Jenkins run.

Once you save your job configuration, click the ‘Build with Parameters’ button and try running it.  Your artifacts should be appended to each job run once it completes.

results

Collecting your results in Jenkins

Like a Key-Value Pair in a JSON Haystack:

Next, we’re going to talk about result filtering.  The results.json provided initially by the API is exhaustive in size.  Go ahead and scroll through that file saved from your last successful test run (you will probably be scrolling for a while).  There’s a mountain of data there but let’s see if we can fish some information out of the pile.

The next JSON-relative trick we’re going to show you is how you can filter the results.json from Webpagetest.org down to a specific object you wish to measure statistics for.

The structure of the results.json lists every web element (from .js libraries to images, to .css files) called during the test and enumerates some statistics about it (e.g. time to load, size, etc.).  What if your goal is to monitor and measure statistics about a very specific element within your application (say, a custom .js library you ship with your app)?

needle-in-a-haystack

That’s one way of finding it…

For that purpose, we’ll use cat and js again to filter our results down to one, specific file/element’s results.  Try adding something like this to your script:

cat results.json | jq '.data.runs."1".firstView.requests[] | select(.url | contains(" <a unique identifying string for your web element> "))' > stats.json

This is similar to how we filtered our results to obtain our waterfall image above.  In this case, each test result from Webpagetest.org contains a JSON array called ‘requests’.  Each item in the array is delineated by the URL for each relative web element.

Our script command above parses the contests of results.json, pulling the ‘results’ array out of the initial test run, then filtering that array based on the ‘url’ key, provided that key matches the string we provided to jq’s ‘contains’ method.

These filtered results are then output to the stats.json file.  This file will contain the specific test result statistics for your specific web element.

Add stats.json to the list of artifacts you wish to archive per test run.  Now save and run your test again.  Note, you may need to experiment with the arguments passed to JQ’s contains method to filter your results based on your specific needs.

Next Steps:

At this point, we should have a Jenkins job that contains a script that will allow us to execute tests against Webpagetest.org’s public API and retrieve and archive test results in a set of files and formats.

This can be handy in of itself but what if you have team or organization members who need access to some or all of this data but do not have access to Jenkins (for security purposes or otherwise)?

Some options to expose this data to other teams could be:

  • Sync your archived elements to a publicly available bucket in Amazon S3
  • Have a 3rd party monitoring service (Datadog, Sumo Logic, etc.) read and report test findings
  • Send out email notifications if some filtered stat within our results exceeds some threshold

There’s quite a few ideas to expand upon for this kind of testing and reporting.  We’ll cover some of these in a future blog post so stay tuned for that.

Private or Testing and Wrap-Up:

If you find this method of performance testing useful but are feeling a bit limited by Webpagetest.org’s restrictions on their public API (or the fact that all test results are made public), it is worth mentioning that if you’re needing something more robust or confidential, you can host your own, private instance of the free, open-source API (see Webpagetest.org’s github project for documentation).

Additionally, Webpagetest.org also has pre-built versions of their app available as Amazon EC2 AMIs for use by anyone with AWS access.  You can find more information on their free AMIs here.

Additionally, here’s the script we’ve put together through this post in its entirety:


npm install -g webpagetest
npm install -g jq-cli-wrapper
npm install -g wget-improved

webpagetest test $SITE -k $APIKEY -r $RUNS &gt; test_exec.json
&lt;span style="font-size: 1rem;"&gt;testId=$(cat test_exec.json | jq .data.testId)
&lt;/span&gt;testId="${testId%\"}"
testId="${testId#\"}"
echo $testId

webpagetest status $testId -o status.json
testStatus=$(cat status.json | jq .data.testsCompleted)

while [ "$testStatus" != "$RUNS" ]
do
sleep 10
webpagetest status $testId -o status.json
testStatus=$(cat status.json | jq .data.testsCompleted)
done

waterfallImage=$(cat results.json | jq '.data.runs."1".firstView'.images.waterfall)
waterfallImage="${waterfallImage%\"}"
waterfallImage="${waterfallImage#\"}"
nwget $waterfallImage -O waterfall.png

cat results.json | jq '.data.runs."1".firstView.requests[] | select(.url | contains(" <a unique identifying string for your web element> "))' > stats.json

We hope this article has been helpful in demonstrating how some free tools and services can be used to quickly stand up performance testing for your web applications.  Please check back with our R&D blog soon for future articles on this and other performance related topics.


Publishing Load Test Results with Jmeter, Jenkins and S3

A while ago, I published a blog post that presented a tutorial overview of how to use Jmeter for load testing a typical RESTful API.

This post builds upon that original post with handy information on some updated reporting features of Jmeter as well a quick dive into how you can better propagate your load results in a continuous build environment (ala Jenkins).

if you’re completely new to Jmeter, please read my previous blog post, linked above before proceeding.

For those of you experienced with Jmeter (hopefully you already have some tests you’re wanting to deploy somewhere rather than let them live contentedly on your local machine), get ready because you’re gonna love this

67295777

It’s truly amazing the gifs you can find on the web.

Meet the New Jmeter, Same as the Old Jmeter (not really)

The previous load test tutorial covered setting up a load test from scratch using an early version of Jmeter.  One of the benefits of using Jmeter, as outlined in the original post was that it has been around for quite a long time, is well known, stable and free.  However, one of the major cons in using Jmeter is that its’ well, old – and has gone for a long while without major updates – especially when it comes to report generation.

Well, welcome to Jmeter 3!  It still comes with that same, great, vintage 90s UI but now with a hoard a bug fixes, stability upgrades and – wait for it – native HTML report generation, wooo!  Check out version 3’s documentation here:

Installation and Setup

So, let’s get down to it!  You can find the latest build of Jmeter 3 here: https://jmeter.apache.org/download_jmeter.cgi

Steps to setting up Jmeter 3 locally are similar to the installation steps covered in my original blog post.  Pre-installation requirements are the same:

  • Java JDK (version 7 or later)
  • Be sure your Java HOME local environment or path variables are set before execution.

Functionally, Jmeter 3 appears identical to older versions of the application but there are a lot of changes under the hood.  I recommend unarchiving and installing Jmeter 3 in its own directory, separate from any previous version of Jmeter you may have previously installed.

Migrating your tests

If you’re following along with this tutorial and wish to create a new load test from scratch, please follow the test setup steps in the original post’s tutorial however, be sure to SKIP the 3rd party report and listener portion of the test setup (guess what, you won’t be needing those plugins anymore).

If you have an existing test you wish to simply fire up in Jmeter 3, your mileage will vary in this case.  Some of the 3rd party listeners and other tools you may have used in your setup may be incompatible with the newer version of Jmeter.  If you have any custom listeners embedded in your test I recommend doing the following:

  • Open your original test in your older version of Jmeter
  • Remove 3rd party listeners, samplers or elements from your test (right-click and select remove)
  • Save the updated test as a new test
  • Open the newly created test in Jmeter 3

From this point, you won’t really need any of your original report listeners configured in your test, however, for debugging purposes, I do recommend keeping a simple response listener in your test – one for successful API responses, another separate for failed responses – just to help with debugging any issues your test might run into.

In a few cases, I’ve found despite removing any 3rd party plugins that some tests have compatibility issues with Jmeter 3.  Sadly, the easiest course of action is to rebuild the test from scratch.  Such is life (sigh).

Such is life...

Such is life…

Executing Tests with Report Generation

Given you have your initial test configured for Jmeter 3, let’s start up the app and view it in the new UI (though it looks like the old UI).  Once you start Jmeter froim the command line, you’ll see a message like this in your terminal:

================================================================================
Don't use GUI mode for load testing, only for Test creation and Test debugging !
For load testing, use NON GUI Mode & adapt Java Heap to your test requirements
================================================================================

You don’t say!?  If you’re a long-time user of earlier version of Jmeter, you’re probably thinking, “Well, no duh!” right?

Open your load test in the UI and give it a look-over to make sure its configured the way you intend.  It should be minimal simple thread group, your HTTP samplers, your results tree report and any CSV data resources you might need.

Your test may look something like this

Your test may look something like this

Next, save your test and close Jmeter (we’re now done with the Jmeter UI).

Now, we are going to use Jmeter’s command line interface to execute the load test and generate the report for the test.

Do the following:

Open your CLI terminal and navigate to your Jmeter 3 bin directory.  Execute the following command:

jmeter -n -t <test JMX file> -l <test log file> -e -o <Path to output folder>

Be sure to set the ‘test JMX file’ argument to the path where your load test’s .JMX file resides, relative to the Jmeter bin directory.

The test log file should be an arbitrary log file path/name that currently does not exist.

The output folder path is where your report will be written to.  This must be an empty directory.

A couple of notes:

If you configured your test to run for a set period, just sit back and wait.  The report will be generated in the output directory you provided once the test execution finishes.

If you configured it to run in perpetuity – you will need to formally stop the test before report generation will execute (simply killing your terminal session won’t help you here).

To stop your Jmeter test from the command line, simply open a new terminal window and enter one of the following commands:

Control + . – This stops Jmeter, halting any active listeners.

Control + ,  – This sends a shutdown command to Jmeter – it will wait until all active threads have finished their current tasks before closing shop (this is the recommended method to use unless you’re impatient

or there is an emergency – like, oh you forgot you pointed your test at production).

Are you really going to argue with Chuck?

Are you really going to argue with Chuck?

Once your test has gracefully exited, navigate to the output folder you specified and open your newly minted report in your web browser of choice.

Jmeter 3 HTML report

Jmeter 3 HTML report

Pretty sweet huh?
sxf8ww

If you haven’t seen Jmeter’s dashboard report before, you’re probably thinking, “golly, there’s a lot of stuff here” – and there is.  The dashboard report contains a pretty wide variety of data on your test execution.  Enumerating through all of that here would be exhausting however – if you’re interested in all the gory details of Jmeter’s dashboard metrics, check out this in-depth explanation here:

https://jmeter.apache.org/usermanual/generating-dashboard.html

Show and Tell (mostly show)

So now you have this fancy load test report but hoarding all this metric goodness on your local development workstation is no fun for the rest of your team.  But that’s OK because if you have access to a continuous integration build environment (ala – Jenkins), the rest of this blog post will walk you through taking your Jmeter test and throwing it into a Jenkins build that allows you to not only run your test remotely but also save and propagate your results to the rest of your agile team.

Make your test available

First things first, you’re going to need to take your Jmeter test, get it off your local machine and into some form of web-accessible delivery.  If you have AWS access, you could place your .JMX files and resources into a bucket and be done with it.  In our case, I recommend creating a private Github repository for your tests and committing your Jmeter working directory, tests and resource files to that repository.  There’s a couple of reasons for this:

  • It’s easy to access a given Github repository with Jenkins
  • You can manage updates and versions of your tests just like source code
  • You can manage variants of your load tests using Github’s branch management features

That said, before tossing your tests into Github’s gaping maw, here’s an important note regarding information security:

Depending on your type of load test, you may have some API or other service access keys stored in your test.  You don’t want to check in API or other access keys into your repository (even if it is marked private).  But don’t just take my word for it:

https://softwareengineering.stackexchange.com/questions/205606/strategy-for-keeping-secret-info-such-as-api-keys-out-of-source-control

If you’ve already committed your tests to your repository and you still have some software keys in there and are thinking, “Oh boy… What now!?”, here’s a link to some handy notes on how to extract some sensitive values from your test or code using some handy features of Git:

https://gist.github.com/derzorngottes/3b57edc1f996dddcab25

Getting Up and Running with Jenkins

Jenkins is one of the most widely available CI build tools in use today.  As such, we’re going to cover how to set up a Jenkins task to run your load tests.  If you’re using some other build system (e.g. Team City) this walk-through won’t be as pertinent but essentially, the tasks will be the same.

Step 1: Get access to Jenkins:

Assuming you already have a Jenkins build server of some sort available to your organization – let’s log into it.  If you don’t have access to Jenkins, talk to your friendly neighborhood dev ops engineer.  Note, that for this walkthrough, you’re going to need some level of administrator access to set up everything we need to execute our tests.

Step 2: Create and Setup your Job with Parameters:

Do the following:

  • From the Jenkins home page, choose a directory you wish to run your load test jobs from (or create one).
  • Click the “New Item” link and then choose “Freestyle Project”
  • Give your project a name and description
  • Choose the “This project is parameterized” option – we’ll use parameters to allow you to configure your load test If needed.
  • Select the “New string parameter” option and create a new parameter named, “thread”
  • Set the default value to whatever you want your test’s default number of threads to be (e.g. 40).
  • Create another string parameter and name it “ramp” – set its default value to the number of seconds you wish your test to take to ramp up to its maximum load.

If your test is going to loop, create another string parameter named, “loops” and set its default, numeric value.

If you have an API key (or keys) you need for your test to execute, as mentioned above, and have already removed said keys from your test (substituting them for a placeholder value) you can create additional string parameters here (naming them key1, key2, etc.).  You can then set your API key(s) to the default value field.  Granted, you are propagating your API key here but this is a much better practice in terms of security than leaving them in a potentially publicly accessible repository as your Jenkins instance should be private and protected.

5dbe72d3d6a5db0d23a62eea640d7c5a_1457280669769jpg-keymaster-gatekeeper-meme_250-250

Step 3: Git Jenkins to Talk to Git:

While still in the Jenkins job configuration screen, under the Source Code Management section, select “Git” and enter your repository’s URL alias into the Repository URL field.

If this is your first time doing this, Jenkins expects a specific format for your Github URL strings.  It should look something like this:

https://github.com:<your main repository name>/<your project name>

If you’re using a publicly accessible Github repository, skip the next step, enter your preferred branch name (or */master if you don’t need a specific branch).

Next, select the appropriate credentials option from the relative drop down menu to allow Jenkins to properly introduce itself to your Github repo (if you’re having trouble with this, ask your dev ops engineer or Jenkins server admin for help – and maybe do something nice for them while you’re at it like get them a thank you card or some cookies or something, because at this point, you’d be out of luck without them, right?).

bp4

Step 5: Build Settings:

You can kick off your tests manually however, it’s probably better to set up timer or other method to handle this for you.  Try the following:

Under the Build Triggers heading, check the Build periodically option

Enter your time range you wish the build to trigger at (this will be in Cron notation – which is tricky if you’re seeing this for the first time).

bp5

This article does a decent job explain Cron’s formatting: http://www.nncron.ru/help/EN/working/cron-format.htm

Now, click on the Add build step option and from the dropdown menu, select ‘Execute shell’.

Here, we will define the command we will use to execute the Jmeter test once Jenkins pulls the test resources from Github. This will be like the shell command we used to run Jmeter locally as described above.

bp7

Syncing to Amazon Web Services

Now we need to make sure we’re saving our generated report somewhere so the rest of our team can review it.  Jenkins has a Jmeter performance plugin that can archive our results.  Also, we could just have Jenkins archive the output directory Jmeter generates the report in (though handing all the recursive directories it will build might be a pain).

Given you have an AWS account, you have the options to sync your reports to an AWS bucket and host them like a static web page.  This method would be beneficial if you need to expose your load test results to team members or other parties that do not or should not have access to your build systems (e.g. product manager, support team members, etc.).

If you don’t have access to AWS, aren’t sure you have access to AWS or may have issues with your build server communicating to AWS, once again, now is a fine time to make friends with (*cough* bribe *cough*) your friendly neighborhood dev ops engineer.

Let’s say you’ve taken care of that and you and your dev ops guru are best buddies now.  Next, you’ll need to further configure your Jenkins job by adding another Execute shell build step.  Make sure this one is ordered sequentially after your Jmeter test execution step.

In the Execution shell, simply add a command to change to the output directory your report will be in (defined in your test execution command) and use the AWS sync command to send your HTML report to AWS:

cd bin/target
 aws s3 sync . s3://mybucketroot/mybucketname

Save your Jenkins job.  You’re done (with Jenkins at least).

Now, in the above step, we are assuming you have a bucket already created in AWS where you can sync your data to.  You’re also going to need access to modify how the bucket works in terms of its permissions.

Making Your Test Results Readable from the Web:

By default, your AWS bucket is out there on the web, you can read from it, write from it, but your other team members will have trouble reading the HTML report from that location.  We need to configure the bucket so that it will display its contents like a static web page.  Here’s how:

Log into your AWS account and access your specified bucket.

Click on the bucket and select the Properties option

Click the Static website hosting panel

bp9

Enable the static hosting option

Specify your index.html file location (this should be the relative path to the main HTML file for your uploaded report).

bp10

Save your changes and boom – now you’re done.

Save and run your job.  If your account permissions are all set up correctly, your test should execute and the test results will be uploaded to the specified AWS bucket.

From here, simply access your AWS bucket using the following styled web link:

https://s3.amazonaws.com/myBucketRoot/myBucketName

995f09e2e0291e1c61e3d22a62438b95f23395d966984d472eb5b43ea04f76beYour test results should now be viewable just as if they were a static web page by anyone on your team.

Wrapping it Up:

Now that you have your load tests residing in a Github repository, feel free to leverage Github’s branching features to allow you to manage multiple iterations of your load tests:

Commit different variations of the same branch to new branches

Use Jenkin’s copy feature to copy your existing job, and just point it to your different branches to allow you to execute multiple test types.

Use Jmeter’s UI locally to copy/edit your existing tests to make additional iterations.  Save these to your repo and commit them just like you would any other coding project.

Again, use Jenkin’s copy feature to create variations of your test run jobs – this time, just edit your shell command to execute your desired .JMX test file per a given execution.

Thanks for reading and I hope this give you further ideas and insight into how you can leverage Jmeter to further improve your software projects through load testing.

Looking Back at Looking Back: A Retrospective of the Retrospective Process

A while ago, I published a post on this blog about how to perform retrospectives for development teams who proscribe to Kanban and/or the agile development process.

You can read that post here: Don’t Look Back in Anger

I’ve received a lot of feedback on that blog post – enough that I thought I’d follow up with an additional post that details further fine-tuning of our retrospective process – a retro of retros if you will but first…

Yo dawg, I heard you like old memes...


Yo dawg, I heard you like old memes...

OK, now with that out of the way – here’s some insights into what we’ve learned from looking back at the retrospectives we’ve performed over time:

It’s Not Just for Development Teams

Regardless whether you’re using Kanban, Agile development, other forms of SDLC management, (insert snazzy development jargon buzzword here) or not – the process of re-evaluation and improvement can be applied to any team process.

After the previous blog post was published, I had a member of our product knowledge team approach me to tell me how they were planning on using the retrospective process to improve how they communicate technical details to our clients.

It seems like an obvious move but honestly, as the retro process laid out in the previous blog post was very specific to the agile/Kanban management process, I felt this was worth mentioning here.

You Need Moderation

This was only briefly mentioned in the previous blog post but, as we’ve conducted further retrospectives, it became clear that some form of moderation during the retrospective sessions was needed.

In this case, I’m not talking about the need for a designee to “take the minutes” of your sessions (you should already be doing this) but we found that the team really needed someone to help move the retrospective along.  Here’s why:

Time is an Expense – Yup, time is money and if you have a large team spending a large amount of time in retrospective, somewhere, someone is thinking – “boy, that’s a lot of billable hours going on in that meeting”.  You need a moderator to help stick to the time box you’ve put together for your retrospective.  Spend the necessary time for review but not too much time.

Technical Teams go Down Technical Rabbit Holes – And that’s because, especially if you’re dealing with highly technical teams, we by default are pretty obsessed with solving complex problems.  You get enough engineers together to discuss how to solve for there being 4 different competing programming frameworks and you’re going to end up with 5 competing frameworks.  Focus on technical solutions is necessary to solving problems but it’s good to have someone keep the team focused on identifying problems here; determining technical feasibility should be done outside the retrospective.


This really does happens - that's why its funny


This really does happens - that's why its funny

Emotional Teams go Down Emotional Rabbit Holes (and all teams are emotional) – Technical prowess aside, people are people and we tend to have some pretty strong feelings about things, one way or another.  If you don’t skirt the danger of falling into a technical time sink of a discussion, I guarantee you that you will at some point fall into an emotionally charged one.  It’s important to have someone help the team keep the discussion tight and focused – so we can focus our passions on moving forward (after we cleared some of the path forward in your retrospective).

Ron Burgundy is emotional

How Do You Moderate?

This has been the subject of many, many management books, articles and college thesis papers.  There’s way too much to unpack when it comes to how to moderate your team meetings (hint, it depends on your team) but here’s some hints we’ve picked up along the way:

Time Can’t Change Me – Don’t be afraid to use a timer (you all have smart phones and there’s an app for that)!  If you’re following a format similar to the one outlined in the previous post – each subsequent phase tends to take longer than the previous one – allocate time accordingly.

Simple Division – Since you’ve likely divided your retro into phases and slated a time limit to conduct it in, divide your time slated for the retrospective among those phases.

Keep in mind the number of people on your time – try to sub-divide time allocated for each phase for each team member (e.g. five members and 15 minutes for phase one? – Try to keep everyone close to 3 minutes a piece per phase).

The Kindest Cut – Don’t be afraid to cut someone off if it looks like their starting to dominate the conversation (but do this gently and with tact).

Take notes of heated discussion points (particularly if it’s between a small subset of your team).  Promise to follow up with those team members with a further discussion of their points – which are important, but do focus on keeping the meeting moving forward.

Remind the team that the sooner the meeting concludes the sooner everyone can get back to work as a team (that’s the whole goal here anyway).

Take Notes:

Again, this was briefly touched upon in the previous post.  Initially, when we began the retrospective process, we weren’t very diligent on taking notes aside from noting which to-do items we wanted to take away and work toward after each retrospective.

The further we refined our process however, to more detailed notes we not only kept but also published.

Taking notes was key to us further refining our process because two things became apparent when looking back at our notes from our previous retrospectives:

  • Some of our to-dos, while we committed time and effort to improve, were brought up again in later retrospectives.
  • Some of our pressing needs at the time of a specific retrospective became non-issues as our team naturally evolved.

Capturing the former allowed us to recognize a persistent problem the team identified but required consecutive effort to resolve.  In this case, we appeared to keep taking on more work within our Kanban process than we had bandwidth to resolve (biting off more than we could chew).  This moment of realization resulted in becoming the central topic of its own retrospective.

The latter, while on the outset seemed not necessarily noteworthy, did provide an ah-ha moment for the team when we could see in black-and-white, on our Confluence page, evidence of not only of our team evolving but in one way or another, improving.

Anonymity Can Be Powerful:

People are people and aside from that being a Depeche Mode song we found that people frankly sometimes don’t like to be put on the spot.  In this case, when we conducted our retrospective retrospective (see the whole thing about the combo breaker below), feedback from several team members spoke about the round-robin style forum method of team discussing highlighted in the our initial blog post.

The main criticism was that, while that method of discussion did help the team to consensually highlight both what went well and what could be improved, the act of doing so in this manner made some people uncomfortable.

The item for improvement became how we can better facilitate our already established method of feedback – while reducing some of the personal, individual aspects of the process to make some team members more comfortable (again, people are people, people are different, some approach different forms of interaction better than others and if you plan on working together as a functional team, that is a fact you will need to address).


The other half consists of porkchop sandwiches


The other half consists of porkchop sandwiches

Our solution took inspiration for our company happy hour and team building invites (no seriously, I was not writing this while racing go karts or having margaritas with the team).


We simply decided to move a portion of our team discussing to a service like Survey Monkey:

  • We would put forth a discussion topic session for our future retrospective sessions
  • Invite team members to “the party”
  • Allowed anonymous submissions to the survey (suggestions for the upcoming “party”)
  • Allowed voting for submitted topics for both well-done and to-improve points of discussion
  • Collected the anonymous submissions, focusing on substantially up-voted items
  • And brought those to the retrospective meeting


These cacti rock


These cacti rock

Not only did this give some people a more relaxed avenue to provide feedback, it also cut down on the time needed for performing the actual retrospective meeting (a big plus if you’re dealing with a large team).

Get Metrics Involved:

Applying data science to your own development work itself can be its own full-time job especially if you’re working with a large team or multiple teams.

Now you’re probably thinking, “Oh man, don’t tell me to get all crazy with standard deviations and bell-curves for our own retrospectives – this isn’t a performance review!”

And you’re right – but hear me out.  It pays to have some metrics available when you conduct a retro.  Story Time!

We once conducted a retrospective where a topic of discussion was brought up among a couple of engineers where some voiced their opinion that our work and momentum had slowed over the past month (basically, some felt we were getting less and less done, while engineering resources and work remained rather constant).

This could have been a controversial topic to breech.  However, within the discussion, we had metrics handy to answer whether this was the case or not.

By having metrics readily available that measured both work in progress versus work items completed and comparing that to commit history for our project and then being able to compare these metrics against those from the previous month, we found that:

  • Our commit history had in fact increased
  • Our average stories completed had remains relatively constant across both periods.

We tabled this discussion at this point (importance of a moderator at work!) but further investigation led to the fact that basically while we were working our butts off, our stories were becoming larger and more complex – which led to us targeting in a future retrospective, that we needed to reconsider how we conducted our planning meetings

TL:DR stories weren’t being broken down into sub tasks as much as they should have been.  Work items ballooned in scope and reflectively were bogged down on our Kanban board.

Now… figuring out what metrics you may need is probably going to be a challenge.  This is something that can be very different from team to team.  However, there are two rules you may want to keep in mind when sourcing metrics for your retrospectives:

  • Agree as a team what metrics are important
  • Imperfect visibility is better than zero visibility

Basically, whatever heuristic you decide on using – it needs to be something that makes sense to the whole team.  This in itself could be a great topic for its own retrospective.

By imperfect visibility versus zero visibility, even if your chosen metrics aren’t exhaustive (better for your retro that they’re quick and easy to digest), having some level of metrics is better than having none.  It’s hard to argue with math – even if that math is the equivalent of 1 + 1 = 2.

Some metrics we’ve used – just to give you some ideas:

  • Total number of stories committed to per period
  • Number of stories completed (cross-referenced with commits)
  • Average number of stories in progress during period
  • Number of stories completed based on service level (P1s vs P3s vs “DO IT NAO!”)
  • Lead time of stories from their committed state to their finished state (however your team defines that)

Again, whatever you chose to use – be careful of diving too deep for your retrospective and be sure to make that choice as a team.

Combo Breaker:

In our last retrospective, we did something different. Rather than follow the format provided in the previous we performed a recursive retrospective by looking back at the results of our retrospectives from the beginning of the year.  Time for a Scala joke!


We've already blown our quota for this joke


We've already blown our quota for this joke

As indicated above, we came up with some deep, recursive improvements.  Here’s some steps you can follow to do the same:

  • Prior to the upcoming retrospective, we review notes taken from the prior retrospective sessions
  • Try to target a time-frame that makes sense for your team (e.g. last quarter, last calendar year, previous geological epoch, etc.)
  • Note the well-done items and the need-to-improve ones
  • Look for repeating patterns as this is key (no, StackOverflow doesn’t have a regex for this – trust me, I looked).
  • Compile these repeating patterns from previous retrospectives into a small list and bring that to the retrospective.

In the retrospective, instead of following the same procedure your team is no doubt already movin’ and groovin’ to, you can present to this this list (bonus points if you preface this by abruptly jumping atop the nearest available piece of Herman Miller furniture in your office and shouting, “Co-co-co-co-co-co Combo breaker!!!!“).


Shameless pandering to 90s gaming nostalgia


Shameless pandering to 90s gaming nostalgia

Actually, no bonus points will be awarded.  However, depending on the demeanor of your co-workers, you may be cheered, you may get a laugh, or may be straight up escorted from the building.  Either way, it’s going to be a fun rest of the day for you.

Instead of sourcing consent from the team (you’ve effectively already done this with your previous retrospectives) go over the take-aways from each previous retro session.  Briefly discuss the following:

  • Of the Things we did well, are we still doing them well?
  • Of the things we needed to improve on – did we improve (DWYSYWD **)?
  • For any item the team answered, “no” for – as a team, pick one of these items for discussion.

From here, continue the retrospective as you would normally run it – discuss what steps need to be taken to improve on your topic of focus, create and assign action items, etc. (don’t forget to take notes).

This technique I’ve found helps accomplish three things:

  • Its handy when pressed for time – as you’re effectively dog-fooding your own previous retrospectives, a lot of the consensus building for the sessions is taken care of.
  • It’s a change of pace – Hey, people get bored with routine. Breaking routine also often lends to new avenues of thinking.
  • Shores up gaps – Let’s be honest, at some point, your team will commit to an item of improvement that is going to take several passes at solving. Here’s how you can make sure you’re not leaving something on the table. ***

Aww...


** (Do What You Said You Would Do – Don’t you dig complex acronyms?)

*** If you seriously accomplish every single item of improvement your team targets every time, all the time, congratulations, you’re some kind of unicorn collective.  Give yourselves a high five or whatever it is unicorns do.


High five!


High five!

For those who read and enjoyed the previous dive into conducting retrospectives, hopefully this post has given you some insight on how to further fine-tune the process and improve how you and your team improve.


You weren’t getting away without a parting shot from this guy.


You weren’t getting away without a parting shot from this guy


Don’t Look Back in Anger: Retrospectives, Software Development and How Your Team Can Improve

Retrospective – This term can elicit a negative response in people in the software development industry (verbally and physically).  After all, it is a bit of a loaded term.  Looking back can be painful especially since that usually means looking back at mistakes, missteps and decisions we might want to take back.
retro-940x272

I have worked for over a decade in software development and information technology fields and during that time I’ve been involved in many meetings you could label as ‘retrospective’.  Some of these have been great, others terrible.  Some were over-long sessions of moaning and wailing resulting in a great deal of sound and fury, signifying little while others have been productive discussions that led to positive, foundational change in the way a team operated.

Looking back at all of that, I’ve realized a few common truths to the process of retrospectives and how it relates to building software:

  • They’re necessary – there’s always room for improvement.
  • Don’t focus on the negative – focus on the constructive (ie: “how we can improve”)
  • You need an actionable to-do-list – figure out what to change, quickly, then act on it

For the past five months, my team has been employing a process to facilitate retrospectives based around the three bullet points above to foment positive change in the way our team works.  This blog post will detail how we do this.  This is not to say, “you should perform retrospectives and you should do them this exact way”, because every software team works differently.  This however is to say, “here’s an example of how the retrospective process was done with success”.  Maybe it could work for you or give you ideas on how you can form your own process that works best for your team.

Step 1: Recognize!

Kermit_-_YOU_BETTA_RECOGNIZE_400x400


OK, let’s get the grisly stuff out of the way first:  Your team needs to improve.  And that is OK – because no team is perfect and no matter how well we execute on our goals, there’s always room to improve.  In fact, if your team is not at some regular interval assessing or reassessing how you design software, you’re probably ‘doing it wrong’ because (can you smell the theme I’m cooking up here yet?) – there’s always room to improve.  If you’re exploring or actively participating management concepts like Kanban/continuous improvement, this process is essential.

Step 2: Togetherness

OK – you want to improve your process and are ready to discuss how that can be done.  How does the rest of your team feel about that?  You can drag a horse to water and you can drag your team mates into a meeting but you can’t make either drink (unless you’re looking to rack up some workplace violations and future sensitivity training).

This is not how we define team work.

It’s important to get a consensus from the entire team in question before proceeding with a retrospective.  This will actually be easier than some might think.  After all – in software engineering, we’re all trying to solve complex problems.  This is just another problem that needs figuring out.

Before going further, you’re going to need a few things:

  • Somewhere to meet
  • Someone to take notes
  • Someone to keep time
  • Somewhere to post your meeting notes (Jira, Confluence page, post-it notes, whiteboard, whatever works for you)
  • Some time (30 minutes to 1 hour, depending on the size of your team)

Step 3: Good Vibrations

tumblr_mvvj0lM5LS1s65qnho1_400 


Come on, you know you loved this song back in the day.

The tough stuff is out of the way at this point.  You and your team have decided to fine tune your process and have met in a room together to do so (the 2 boxes of Shipley’s donuts you brought with you is barely a tangent in this case).

National-Donut-Day-6.7.14


When we started performing retrospectives regularly on the Shopper Marketing team, we started our discussion by talking about our recent successes as a team.

In this case, we as a team, one by one went around the room and listed one thing during the past period (sprint, release cycle, week, microfortnight, etc. – the interval doesn’t matter, whatever works for your team) and offered 1 thing we felt the team did well.  Doing this has a couple of functions:

  • It helps the team jog its memory (a lot can happen in a short amount of time).
  • It helps celebrate what the team has done recently (wallow in your success!).
  • It sets the right tone (before we focus on what needs to change, lets give a shout out to what we’re doing right).

Note that, especially with larger teams, sometimes one’s perception of how well something might have gone might be very different from someone else’s.  If Jane, your engineering head for your web service says she thought the release of the bulk processor was on time and under budget but Bill, your UI lead contends that it in fact wasn’t on time, wasn’t under budget and wiped out an entire village and made some kids cry, then this is the point where you should pause the retro and have a brief discussion about the matter and possibly a follow-up later.  This leads us to our next step…

69526590-1


Nick Young asking the important questions of our time.

Step 4: What Could Be Better?

Now that you’re full of happy thoughts about what you’ve done well as a team (and full of donuts) its time to discuss change.  This process is the same as the previous step only this time, each team member must call out one thing they think the team could have done better.

homer-simpson


Mmmmmmm... Donuts...

Note that this isn’t about what was bad, or what sucked, or so-and-so is a doofus and has bad breath – but what can the team do better.  In order to keep the discussion productive and expedient, each person is limited to 1 item and that item has to be something the team has direct agency over.  You also might find it handy to nominate a moderator for this point of discussion.

Here’s an example of a real issue that was brought up in a retrospective at a previous company I worked for and the right and wrong way to frame it when it comes to focusing on ‘your team’s agency’.

Marketing and sales sold our client a bunch of features that our product doesn’t do and we had to work 90+ hours this week just to deliver it”

-Or –

“We should work and communicate closer with marketing and sales so they understand our product features as well as the effort required in developing said features”

While the first statement may be true it’s the second one that actually encapsulates the problem in a way the team has a manner of dealing with.  I found that focusing strongly on the positive aspects of a retrospective discussion helps some teams to self-align toward reaching toward the kind of perspective found in the latter statement above than the former.

Other teams I found realized the need to appoint a moderator to help keep the discussion focused.  Its important to figure out what sort of need your team has in this regard early in the retrospective process.  This might seem tough at first (and emotionally charged) and that’s OK.  What’s important is to keep a positive frame of mind to work through this discussion.

As previously stated, if there appears to be a major disconnect between team members regarding issues that could have been done better, this is a good time to discuss that and hopefully iron out any misunderstandings or make plans to do so soon after the retrospective.

Whoever is taking notes, I hope you’re getting all of this because we’re about to tie it all together.

Big_Lebowski_Rug_Blue_Shirt_POP

Step 5: Decide

By now, you and your team will have come up with a good deal of input on what the team did well and what could be improved.  You might be surprised but having done this numerous times, often a very clear pattern to what the team though went well and could have improved on appears and does so quickly.

As a team, go over the list of items to potentially improve on and note which ones are the strongest, common denominator.  Pick 1 or 2 of these and this will provide some focus for the team for the next period of work (sprint, cycle, dog year, etc.).  These can be process-oriented intangibles or even technical issues.  Here are some examples:

Our front end engineers were idle during much of the sprint waiting on services to be updated”

Or

We spend 1-2 hours doing process Y manually every week and we should probably automate it

The first item has to do with improving the team’s process of how it interacts with itself.  The other is a clear, intangible need that can be solved using a technical solution.

action-comics-1-superman-thumb-450x6071


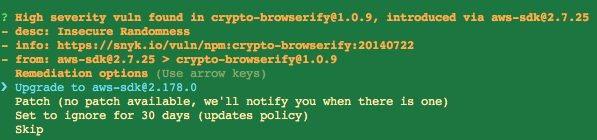
A high-valued issue.

Once the team has identified 1 or 2 high-valued issues they feel need to be addressed, its time to do just that.

Step 6: Act!

This is the most important step.  It’s one thing to identify a problem to be solved, another to actually act on it.  Hold a discussion as to what potential solutions to your issues might be.  The time keeper at this point should be keeping an eye on the clock to help the team keep the meeting moving forward in a productive manner.  At this step, try and keep the following in mind:

  • By now, whatever issues the team has identified that need to be addressed, it should be something the team has full agency to solve (the matter is firmly in the team’s hands)
  • Depending on the issue at hand, it may be something complex and the team might need a couple of tries to solve it. Don’t get discouraged if the issue appears gargantuan or if you can’t solve it within your next period of work alone.

tumblr_lsvmqpEpk21qdku5lo2_500


Once you’ve brainstormed on solutions to how you and your team can make improvements, it’s time to really act.  In this case, you should have some ideas that can be transformed into action items (you get a Jira ticket and you get a Jira ticket and…).  The retro should conclude with the team being able to break down a solution for improving into 1 or more workable tasks and then assigning them to team members for the next sprint, cycle or galactic year.

The key to making this all work is that last part.  What comes out of the retrospective should be treated as any other item of work your team normally commits to in the confines of your regular working period (sprint, release, Mayan lunar month, etc.) with one or more team members responsible for delivering the solution, whether technical or otherwise.

Now you’re ready to move forward with improving as a team and dive into that post-donut food coma.

DakIK


Woooo! Food coma!

Step 7: Going Forward

Whether you use this process or some other framework to run a retrospective, repeating that process is very important.  To what degree or frequency your team does that is for the team to decide.  Some teams I’ve worked with performed retrospectives after every sprint, others only after major releases and some just whenever the team felt it was necessary.  The key is for the team to decide on that interval and after your initial retrospective, be sure to devote some time at the beginning of subsequent retrospectives to review your action items from the previous session (did you complete them and were the issues related to them resolved?).

Hopefully this post has given you an idea how your team can not only perform retrospectives but also improve your team’s working process and even look forward to looking back.

And on that note…

Quick and Easy Web Service Load Testing with JMeter

What is Load Testing and Why Should I Care?

Somewhere between the disciplines of Dev Operations, Database Management, Software Design and Testing, there’s a Venn diagram where at its crunchy, peanut-butter filled center lies the discipline of performance testing.

crunky
 Herein lies the performant (sic)

Which is to say, professional performance testers have a very specific set of skills (that they have acquired over many years) that make them a nightmare for non-performing web services. This helps them to answer the following question from our clients:

“Just what is the level of performance we can expect from your service”?

What if your project team doesn’t have access to anyone with a background in perf testing? What if you suddenly find yourself needing to answer the above question but don’t know where to begin?

Scary, right? Bazaarvoice’s Shopper Marketing team recently found itself in this exact situation (they weren’t being hunted by Liam Neeson so they had that going for them though).

takentester


The point of this article is not to bootstrap you, the reader, into a perf-testing, dev-ops version of the dude from Taken. Instead, it’s to show how a small team can quickly (and cheaply) performance test a web service in order to insure they can meet a client’s needs.

Approach:

If you’ve never been involved in any sort of performance testing for web services before, there are essentially two different tracks performance testing can begin from:

Targeted Testing – you have a pre-defined level of service/latency that you need to reach. Generally, you already have an understanding of what your service’s current performance baseline is.

Exploratory Testing – The current performance baseline isn’t really known. Here, the goal is to find out at what point and how quickly performance degrades.

Typically, with small-team oriented projects, you’ll find often that the team starts with the latter path in order to then progress to the former – as was the case with Shopper Marketing’s efforts here.

Our Setup:

We have a RESTful web API (built in Java) which handles requests for shopper profile information stored and sorted across multiple types of data stores. This API will service a JavaScipt based front end widget deployed to a client’s home page to display product data. The client’s home page receives approximately 20 simultaneous unique views per second on average. Can our API service the client at that level?

To test this, we constructed a load test in JMeter that would do the following:

  1. Execute a series of continuous requests to the API that mimic those that will come from the client front end.
  2. Enable the test to run parallel requests to simulate a specific user load
  3. Use real, sampled data so that the requests and responses will be as close to real-world as possible
  4. Measure the response time of the API over time
  5. Measure the number of successful responses vs failures from the API while under load

Why JMeter:

So why are we conducting our test using JMeter? Isn’t that thing two days older than dirt?

_original


Dirt: its old.

Well, for one, JMeter is free.

jmeter


Jmeter: Its older and free-er

We could just leave it at that but wait, there’s more:

JMeter is a load testing tool that has been around for many years. It isn’t just developed and maintained by the same group responsible for Apache Web Server, JMeter is a modified version of Apache itself.  It specializes not only in sending and receiving HTTP requests (you know, like a web server) but with monitoring and reporting tools available for it as well as a wealth of plugins.

50_banner

Sure, there are better (cough! more expensive cough!) tools out there that specialize in load testing but in our case, we needed to determine metrics quickly and with a tool that could be easily set up and re-run numerous times (heavy emphasis on quick and cheap).

Performance testing is a very repetitive process. You will be executing tests, reporting findings, then modifying your service in order to improve performance – followed by a lot of washing, rinsing and repeating to further refine performance. Whatever load testing tool you choose, make sure it is one that allows you to quickly and easily modify, re-run and re-report findings as you will be living your own form of dev-ops Groundhog Day when you take on this endeavor.

Groundhog_Day_(movie_poster)
 A thought provoking documentary on the life and times
 of a performance tester

But enough memes – lets get down to how we programmed Jmeter to show us pretty performance graphs!

Downloading the Application:

You can download JMeter from the Apache Software Foundation here: http://jmeter.apache.org/download_jmeter.cgi

Note – Jmeter requires Java 6 or above (you are using Java 8+ right?) and you should have your Java HOME environment variables set up on your local environment (or wherever you plan on deploying and executing your load tests from).

Latest Java download:
http://java.com/en/download/

Setting up your local Java environment:
https://docs.oracle.com/cd/E19182-01/820-7851/inst_cli_jdk_javahome_t/

Once the JMeter binary package is downloaded and unzipped to your test machine, start JMeter by running ./jmeter from the command line within the application’s bin/ directory.

Configuring Jmeter:

Regardless of what load testing tool you prefer to use; its technical merits will always be tied to its reporting capability. JMeter’s default reporting capabilities are pretty limited. However, there are a wealth of plugins to augment this. Before going any further you will want to install JMeter Plugins Extras and JMeter Plugins Extras Lib in order to get the results you’ll want from JMeter.

http://jmeter-plugins.org/downloads/all/

68263351

Unarchive the contents of these files and place them in the lib/ext directory within your JMeter installation.

Once finished, re-start JMeter.

Note – you can install, update and manage plugins for JMeter using the JMeter plugin manager. This feature is in Beta so your mileage may vary. More on the JMeter plugin manager here: http://jmeter-plugins.org/wiki/PluginsManager/

Designing a Test:

For those new to JMeter, setting up a test is rather simple but there’s a little bit of jargon to explain. A basic JMeter test consists of the following:

Test Plan – A collection of all of the elements that make up your load test

Thread Group – Controls the number of threads and their ramp-up/ramp-down time. Think of each thread as a unique visitor to your site/request to your service.

Listeners – These will be attached to your thread group and will generate your reports

Config Elements – These contain a variety of base information required to execute the test – mainly domain, IP or port information related to the service’s location. Optionally, some config elements can be used to handle situations like having to authenticate through LDAP during tests.

Samplers – These elements are used to generate and handle data as well as options and arguments during test (e.g. request payloads and arguments).

Building the Test – Step by Step:

1. Click on your test plan and assign it a name and check the Run Teardown option
2. Right click on the test plan and select Add > Threads > Thread Group

jm1

3. Enter a name for the thread group (e.g. load test 1)
a. Set the number of threads option to the maximum desired number of requests you want to field         to the API per second (simultaneously)
b. Set the ramp-up period option to the number of seconds you wish the test to take before it                 reaches the maximum number of threads set above (e.g. setting thread count to 100 and the             ramp-up to 60 will start the test with 1 thread and add an additional thread per second. After 1           minute, the test will be at a maximum of 100 concurrent requests per second).
c. Set the Loop option for the number of cycles of maximum requests you wish the test to repeat           once it reaches is maximum number of threads. Once this loop finishes, the test will end.
d. Check the forever option if you wish the test to continue to execute at its max thread count                 indefinitely. Note – this will require you to manually shut the test down.

jm2

4. Right click on the Thread Group and select Add > Config Element > HTTP Request Defaults
5. Set the Server Name or IP Address (and optionally the Port) fields to the domain/IP/port your             service can be reached at (e.g. http://my.network.bazaarvoice.com)

jm3

Now we’re ready to program our test – using the options in the HTTP Request element, we’ll construct what we want each request per each thread to contain.

1. Right click on the thread group and select Add > Sampler > HTTP Request
2. In the HTTP Request config panel, set the implementation to HTTPClient 4
3. Set your protocol (http or https) and your method type (in this place, GET)
4. Set the path option to the endpoint you wish to send your request to – do not include any HTTP         arguments (e.g. /path/sub-path1/sub-path2/endpoint)
5. Next, we’ll configure each and every HTTP argument we need to pass within our request.
6. Do this by clicking into the first line of the send parameters table.
7. Enter your first argument name into the name field, the value into the value field, click the include       equals option and, if need be, click the encode option if your argument value needs to be HTTP         encoded.
8. Click Add and repeat this process for each key-value pair you need to send with your request

jm4
 Your HTTP Request sampler should look something like this.

Now would be a good time to save your test!

leo
 Don’t be this man

Adding Listeners:

Next, we need to add listeners (JMeter-speak for report generators) in order to report our findings during and after the load test.

Right click on the thread group and select Add > Listeners > and then pick your choice of listener.

The choice of test listeners is quite deep, especially if you installed the reporting add ons as noted above. You can configure whatever listeners you feel you need, though here some you may want to add to your test:

View Results Tree – This listener will tabulate each request response it receives during the test as well as collect its response type, headers and content. I highly recommend configuring two of these listeners and assigning 1 for successes and 1 for failures. This will help sort your response types, allow you to debug your tests in case of authentication errors, malformed requests or troubleshoot issues if your API should suddenly start returning 500 errors.

Response Times Vs Threads – If you’re configuring your test to ramp up its load over time, this listener will provide a chart which you can use to measure the responsiveness of your API over time as the request load is increased. Again, I recommend configuring multiple instances of this listener – one to record requests and another to record error latency if you choose to use this listener.

Response Times Over Time – If your test is being configured to provide a constant load over a period of time, this listener can help chart performance of the API based on a steady load over time. It’s helpful in helping to spot issues such as inadequate load balancing or rate limiting of your requests depending on if your service architecture is really aggressive when it comes to that aspect (cough, cough – load balancers – cough).

jm5
 Example of response time over time graph setup (successful responses only)

Now would be another great time to save your progress.

Kicking off a Test:

OK – the moment you’ve been waiting for (be honest). Let’s kick this pig and bask in the glory of our performant API!

Click the big, green button to start the test. Note on the upper right hand side of the JMeter UI, you’ll have an indicator showing the number of threads currently running (out of the total max to ramp up to) as well as an indicator of any warnings or errors being thrown).

jm6
 GO!

Click on the Results Tree listener to view a table of your responses. If you’re seeing errors, click on an error instance in the results tree to view the error type, body and content.

jm7
 10 out of 10 threads running, no exceptions

Once you’re ready to stop a test, click the big, red, X icon to shut the test down.

jm8
 STOP!

Modifying a Test:

You’re probably thinking, “Hey, that was easy and oh look! Our test results are coming in and they look pretty good. There’s got to be more to it than this”. …And you would be right. Remember that comment about load balancers above? Well, in most modern web service architectures, you’ll encounter some form of load balancing whether it’s part of the web server’s features or an intermediary. In our case, Mashery would have cached our static request after a few seconds at maximum load. After that, we weren’t even talking to the API directly, rather, Mashery simply sent us the cached response for the request. Our results in Jmeter may have looked good but it was lying to us.

khaled

Fortunately, JMeter allows us to inject some form of randomness into our requests to circumvent this issue.

One way of accomplishing this is to invoke a randomized ID into your HTTP arguments – especially if your API accepts a random, serialized load ID as an argument. Here’s how you can do that:

1. Right click on the thread group and select Add > Config Elements > Random Variable

jm9

2. On the Random Variable config screen, set a value for in the variable name field (e.g.                         my_random_id)
3. Set a minimum and maximum value to define the range your random variable will take (e.g. 1000       and 9999)

jm10

4. Set the Per Thread option to true (this will ensure a random value will be set for each thread.

vegita
 And this joke is over plaaaaaaaaaaayed!!!!

5. Next, we’ll need to click on the HTTP Sampler and include our newly added random variable to         our test. Let’s assume our API accepts an argument called ‘loadId’ which corresponds to a                 random, 5-digit number.

6. In this case, click on the Send Parameters table and add a new key value pair with the name set       to ‘loadId’ and the value set to ‘{$my_random_id}’ (or whatever you’ve named your variable in the       config element screen.

jm11

One of the requirements of our load test request is that we must provide a specific profile ID that relates to a profile to be returned by the API. For our purposes, we exported a list of existing IDs (over 90,000) from the Cassandra database our API reads from and writes to, imported that into our JMeter test and instructed the HTTP Request sampler to randomly grab an ID and include it as the argument for every individual request.

We configured this by doing the following:

1. Right click on the thread group and select Add > Config Element > CSV Data Set Config

jm12

2. In the CSV data set config options, set the file name option to the path to your CSV file that                 contains your working data
3. In the variable name field, provide a name for which the test sampler will refer to each instance of       your data as (e.g. myRandomID)
4. Enter ‘,’ into the delimiter option field
5. Set the Recycle on EoF to true, Stop on EoF to false and Sharing Mode to All Threads

jm13

This last set of options will ensure that if the test cycles through all elements in your CSV (which it will use for each and every thread) it will simply start back at the top of the list.

Next, click on your HTTP Sampler. Here you will need to add a bash script style variable to the sampler in order for it to automatically pull the shared data variable from your CSV config element (e.g. if you named your variable in the CSV config element to “myRandomID” you need to inject the value {$myRandomID} into the listener somewhere. This will depend on the nature of your API. In our case, we simply appended this to our API endpoint, setting the ID variable to be called between the API domain/endpoint call and the HTTP arguments in the URI.

jm14

Yup – good time to save your game – I mean test. After that…

giphy-1
 Ratta-tat-tat yo!

Reading Results:

We’ve gone over how to build and run a performance test but once the test has concluded and you have gathered results, you need to understand what you’re looking at.

To view the results of a particular listener, just click on it in the JMeter UI.

The Results Tree reports are self-explanatory but what about the other reports? In particular, lets look at the Threads Over Time listener. Here is the graph output for this listener from our initial performance test:

3-15-16-load-test-2
 Average response time for successful requests – 1.6 seconds

This listener was configured to only measure time per successful request in order to obtain more focused results. In the graph you can see that over time, there was a great deal of variance with the majority of requests taking around 1.6 seconds to resolve. Note the highest and lowest points on the graph – these are the outlining deviations for test results as opposed to the concentrated area of red (the average time per request).

Generally speaking, the tighter the graph, the more consistent the API’s performance and of course, the lower the average number, the faster the performance.

Large spikes with pronounced peaks and valleys usually indicate there is an issue with the service’s load balancing features or something “mechanical” getting in the way of the test.

Long periods of plateauing are another indicator to watch for. These may indicate some form of rate limiting or timeout.

Caveats and Next Steps:

Now you’re ready to send off your newly minted beast of a load test to go show that MCP who’s boss. Before you go and press that button – some advice.

On Test Performance:

JMeter is a great tool and all – especially for the price you pay but it is old and not necessarily the most high-performance perf testing tool out there (oh the irony). When launching tests off your local machine or a server – keep in mind that each thread you configure for your test will be another thread your CPU will need to handle. You can quickly and easily create a test that will test your local environments to its limit. Doing so can, at times, crash you test (and dump your results into the ether – engage sad panda face). Start with a small-to-medium performance load and build up from there.

5679299

Starting and Stopping a Test:

When stopping a test, manually or automatically, you might notice a sudden uptick in errors and latency at the very end of the test (and possibly at the beginning as well). This is normal behavior – when a test is started and stopped you can experience some level of thread abandonment (which JMeter will record as an error because those last requests never receive proper responses). These errors can be ignored when viewing results.

Basically, the test results are kind of like a loaf of bread – no one wants the ends.

bread


One of life's great mysteries

A Word of Caution:

JMeter is basically a multi-threaded web request generator and manager. The traffic patterns it generates can resemble those seen during a DoS attack – especially for very large tests. If there are any internal or external web security policies in place within the network you’re testing, be careful as to not set these off (i.e. just because you can run a test on a production server that sends 400,000 simultaneous requests to a google web service – which then gets your whole office IP range banned from said service – doesn’t mean you should and no, the author of this piece has absolutely no knowledge of any similar event ever happening, ever…).

From Latency to Where?

The above performance graph was from the very first performance test against our internal Shopper Marketing recommendations API. Utilizing the test, its results and monitoring tools like DataDog we were able to find where we needed to improve our service from both the code base as well as hosting environment to reach our performance goal.

After several repeated tests along with re-provisioning new Elastic Search clusters and a lot of code refactoring, we eventually arrived at the following test result:

perftestfinal


Average response time for successful requests – 100 milliseconds

From and average response rate of 1.6 seconds to 100 milliseconds is a pretty big leap in performance. Ultimately, our client was pretty happy with our answer.

This is by no means an exhaustive method of load testing but merely a way of doing quick and easy exploratory testing that delivered a good deal of value for our team.

Have fun testing!

Front End Application Testing with Image Recognition

One of the many challenges of software testing has always been cross-browser testing. Despite the web’s overall move to more standards compliant browser platforms, we still struggle with the fact that sometimes certain CSS values or certain JavaScript operations don’t translate well in some browsers (cough, cough IE 8).

In this post, I’m going to show how the Curations team has upgraded their existing automation tools to allow for us to automate spot checking the visual display of the Curations front end across multiple browsers in order to save us time while helping to build a better product for our clients.

The Problem: How to save time and test all the things

The Curations front end is a highly configurable product that allows our clients to implement the display of moderated UGC made available through the API from a Curations instance.

This flexibility combined with BV’s browser support guidelines means there are a very large number ways Curations content can be rendered on the web.

Initially, rather than attempt to test ‘all the things’, we’ve codified a set of possible configurations that represent general usage patterns of how Curations is implemented. Functionally, we can test that content can be retrieved and displayed however, when it comes whether that the end result has the right look-n-feel in Chrome, Firefox and other browsers, our testing of this is largely manual (and time consuming).

How can we better automate this process without sacrificing consistency or stability in testing?

Our solution: Sikuli API

Sikuli is an open-source Java-based application and API that allows users to automate web, mobile and OS applications across multiple platforms using image recognition. It’s platform based and not browser specific, so it enables us to circumvent limitations with screen capture and compare features in other automation tools like Webdriver.

Imagine writing a test script that starts with clicking the home button within an iOS simulator, simply by providing the script a .png of the home button itself. That’s what Sikuli can do.

You can read more about Sikuli here. You can check out their project here on github.

Installation:

Sikuli provides two different products for your automation needs – their stand-alone scripting engine and their API. For our purposes, we’re interested in the Sikuli API with the goal to implement it within our existing Saladhands test framework, which uses both Webdriver and Cucumber.

Assuming you have Java 1.6 or greater installed on your workstation, from Sikuli.org’s download page, follow the link to their standalone setup JAR

http://www.sikuli.org/download.html

Download the JAR file and place it in your local workstation’s home directory, then open it.

Here, you’ll be prompted by the installer to select an installation type. Select option 3 if wish to use Sikuli in your Java or Jython project as well as have access to its command line options. Select option 4 if you only plan on using Sikuli within the scope of your Java or Jython project.

Once the installation is complete, you should have a sikuli.jar file in your working directory. You will want to add this to your collection of external JARs for your installed JRE.

For example, if you’re using Eclipse, go to Preferences > Java > Installed JREs, select your JRE version, click Edit and add Sikuli.jar to the collection.

Alternately, if you are using Maven to build your project, you can add Sikuli’s API to your project by adding the following to your POM.XML file:

<dependency>
    <groupId>org.sikuli</groupId>
    <artifactId>sikuli-api</artifactId>
    <version>1.2.0</version>
</dependency>

Clean then build your project and now you’re ready to roll.

Implementation:

Ultimately, we wanted a method we could control using Cucumber that allows us to articulate a web application using Webdriver that could take a screen shot of a web application (in this case, an instance of Curations) and compare it to a static screen shot of specific web elements (e.g. Ratings and Review stars within the Curations display).

This test method would then make an assumption that either we could find a match to the static screen element within the live web application or have TestNG throw an exception (test failure) if no match could be found.

First, now that we have the ability to use Sikuli, we created a new helper class that instantiates an object from their API so we can compare screen output.

import org.sikuli.api.*;
import java.io.IOException;
import java.io.File;
/**
* Created by gary.spillman on 4/9/15.
*/
public class SikuliHelper {

public boolean screenMatch(String targetPath) {
new ImageTarget(new File(targetPath));

Once we import the Sikuli API, we create a simple class with a single class method. In this case, screenMatch is going to accept a path within the Java project relative to a static image we are going to compare against the live browser window. True or false will be returned depending on if we have a match or not.

//Sets the screen region Sikuli will try to match to full screen
ScreenRegion fullScreen = new DesktopScreenRegion();

//Set your taret to compare from
Target target = new ImageTarget(new File(targetPath));

The main object type Sikuli wants to handle everything with is ScreenRegion. In this case, we are instantiating a new screen region relative to the entire desktop screen area of whatever OS our project will run on. Without passing any arguments to DesktopScreenRegion(), we will be defining the region’s dimension as the entire viewable area of our screen.

double fuzzPercent = .9;

try {
    fuzzPercent = Double.parseDouble(PropertyLoader.loadProperty(&quot;fuzz.factor&quot;));
}
catch (IOException e) {
    e.printStackTrace();
}
new ImageTarget(new File(targetPath));

Sikuli allows you to define a fuzzing factor (if you’ve ever used ImageMagick, this should be a familiar concept). Essentially, rather than defining a 1:1 exact match, you can define a minimal acceptable percentage you wish your screen comparison to match. For Sikuli, you can define this within a range from 0.1 to 1 (ie 10% match up to 100% match).

Here we are defining a default minimum match (or fuzz factor) of 90%. Additionally, we load in from a set of properties in Saladhand’s test.properties file a value which, if present can override the default 90% match – should we wish to increase or decrease the severity of test criteria.

target.setMinScore(fuzzPercent);
new ImageTarget(new File(targetPath));

Now that we know what fuzzing percentage we want to test with, we use target’s setMinScore method to set that property.

ScreenRegion found = fullScreen.find(target);

//According to code examples, if the image isn't found, the screen region is undefined
//So... if it remains null at this point, we're assuming there's no match.

if(found == null) {
    return false;
}
else {
    return true;
}
new ImageTarget(new File(targetPath));

This is where the magic happens. We create a new screen region called found. We then define that using fullScreen’s find method, providing the path to the image file we will use as comparison (target).

What happens here is that Sikuli will take the provided image (target) and attempt to locate any instance within the current visible screen that matches target, within the lower bound of the fuzzing percentage we set and up to a full, 100% match.

The find method either returns a new screen region object, or returns nothing. Thus, if we are unable to find a match to the file relative to target, found will remain undefined (null). So in this case, we simply return false if found is null (no match) or true of found is assigned a new screen region (we had a match).

Putting it all together:

To completely incorporate this behavior into our test framework, we write a simple cucumber step definition that allows us to call our Sikuli helper method, and provide a local image file as an argument for which to compare it against the current, active screen.

Here’s what the cucumber step looks like:

public class ScreenShotSteps {

    SikuliHelper sk = new SikuliHelper();

    //Given the image &quot;X&quot; can be found on the screen
    @Given(&quot;^the image \&quot;([^\&quot;]*)\&quot; can be found on the screen$&quot;)
    public void the_image_can_be_found_on_the_screen(String arg1) {

        String screenShotDir=null;

        try {
            screenShotDir = PropertyLoader.loadProperty(&quot;screenshot.path&quot;).toString();
        }
        catch (IOException e) {
            e.printStackTrace();
        }

        Assert.assertTrue(sk.screenMatch(screenShotDir + arg1));
    }
    new ImageTarget(new File(targetPath));
}

We’re referring to the image file via regex. The step definition makes an assertion using TestNG that the value returned from our instance of SikuliHelper’s screen match method is true (Success!!!). If not, TestNG throws an exception and our test will be marked as having failed.

Finally, since we already have cucumber steps that let us invoke and direct Webdriver to a live site, we can write a test that looks like the following:

Feature: Screen Shot Test
As a QA tester
I want to do screen compares
So I can be a boss ass QA tester

Scenario: Find the nav element on BV's home page
Given I visit &quot;http://www.bazaarvoice.com&quot;
Then the image &quot;screentest1.png&quot; can be found on the screen
new ImageTarget(new File(targetPath));

In this case, the image we are attempting to find is a portion of the nav element on BV’s home page:

screentest1

Considerations:

This is not a full-stop solution to cross browser UI testing. Instead, we want to use Sikuli and tools like it to reduce overall manual testing as much as possible (as reasonably as possible) by giving the option to pre-warn product development teams of UI discrepancies. This can help us make better decisions on how to organize and allocate testing resources – manual and otherwise.

There are caveats to using Sikuli. The most explicit caveat is that tests designed with it cannot run heedlessly – the test tool requires a real, actual screen to capture and manipulate.

Obviously, the other possible drawback is the required maintenance of local image files you will need to check into your automation project as test artifacts. How deep you will be able to go with this type of testing may be tempered by how large of a file collection you will be able to reasonably maintain or deploy.

Despite that, Sikuli seems to have a large number of powerful features, not limited to being able to provide some level of mobile device testing. Check out the project repository and documentation to see how you might be able to incorporate similar automation code into your project today.