Bazaarvoice has thousands of clients including brands and retailers. Bazaarvoice has billions of records of product catalog and User Generated Content(UGC)from Bazaarvoice clients. When a shopper visits a brand or retailer site/app powered by Bazaarvoice, our APIs are triggered.
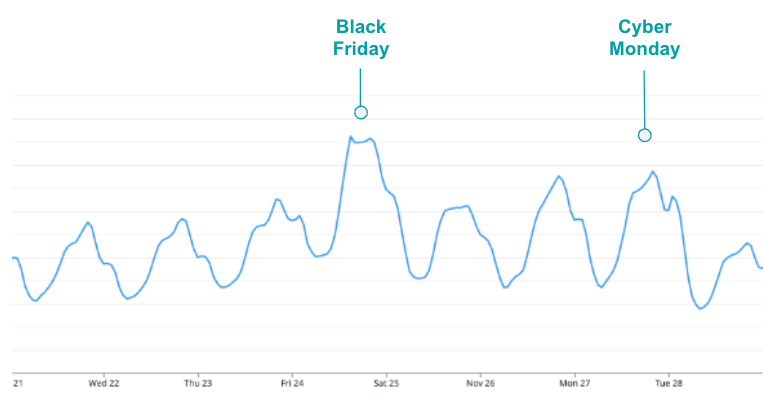
In 2023,Bazaarvoice UGC APIs recorded peak traffic of over 3+ billion calls per day with zero incidents. This blog post will discuss the high level design strategies that are implemented to handle this huge traffic even when serving hundreds of millions of pieces of User Generated Content to shoppers/clients around the globe.
The following actions can take place when shoppers interact with our User-Generated Content (UGC) APIs.
- Writing Content
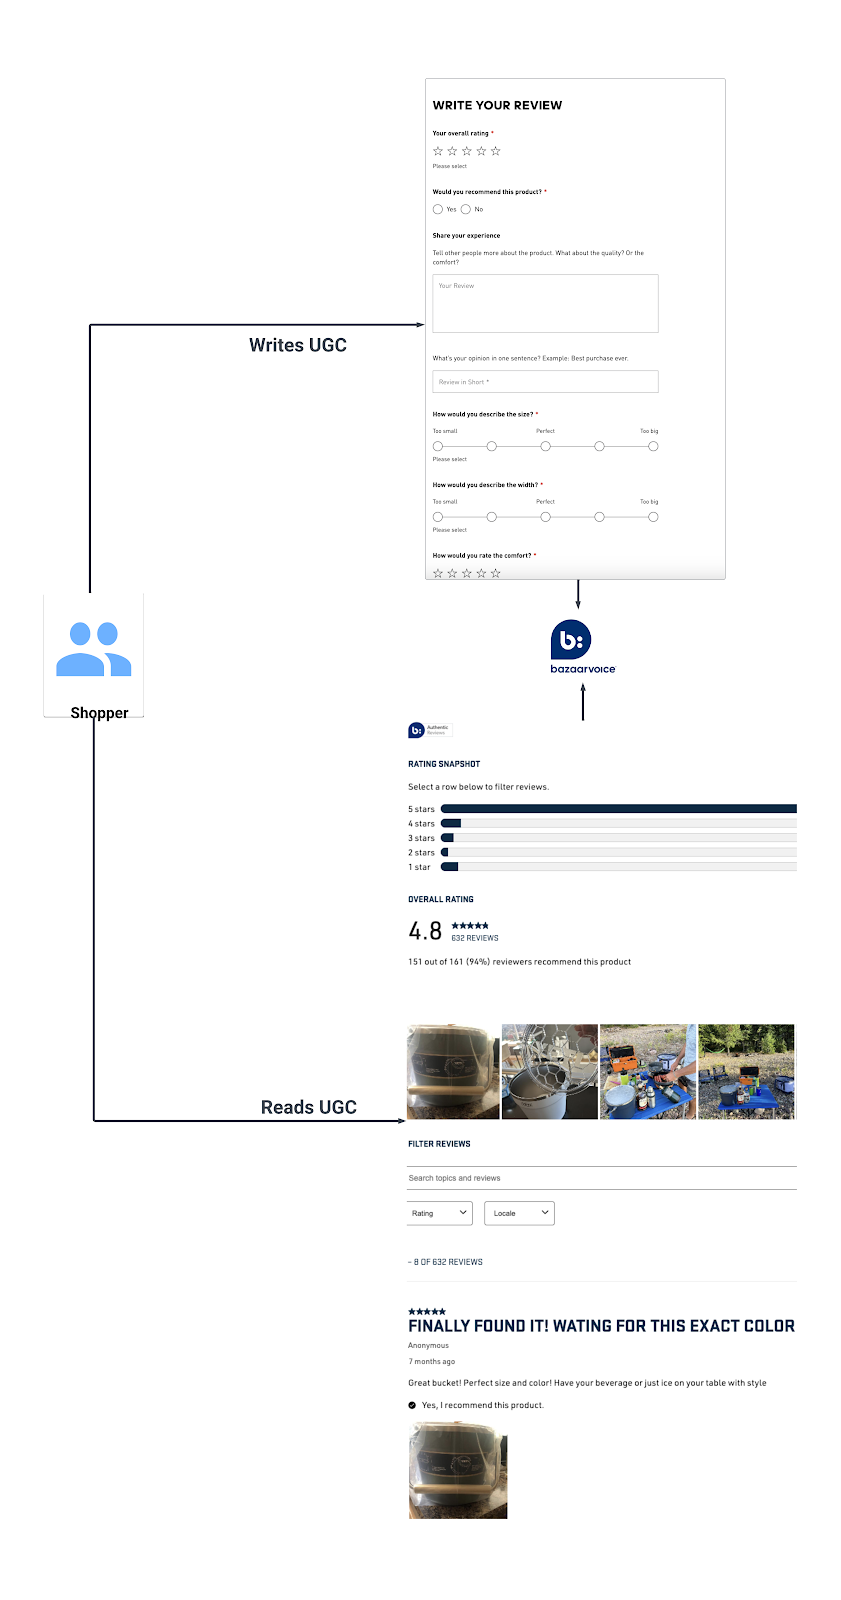
- When a shopper writes any content such as reviews or comments etc. on any of the product on retailer or brand site, it invokes a call to Bazaarvoice’s write UGC APIs, followed by Authenticity/content moderation.
- Reading Content
- When a shopper visits the brand or retailer site/app for a product, Bazaarvoice’s read UGC APIs are invoked.
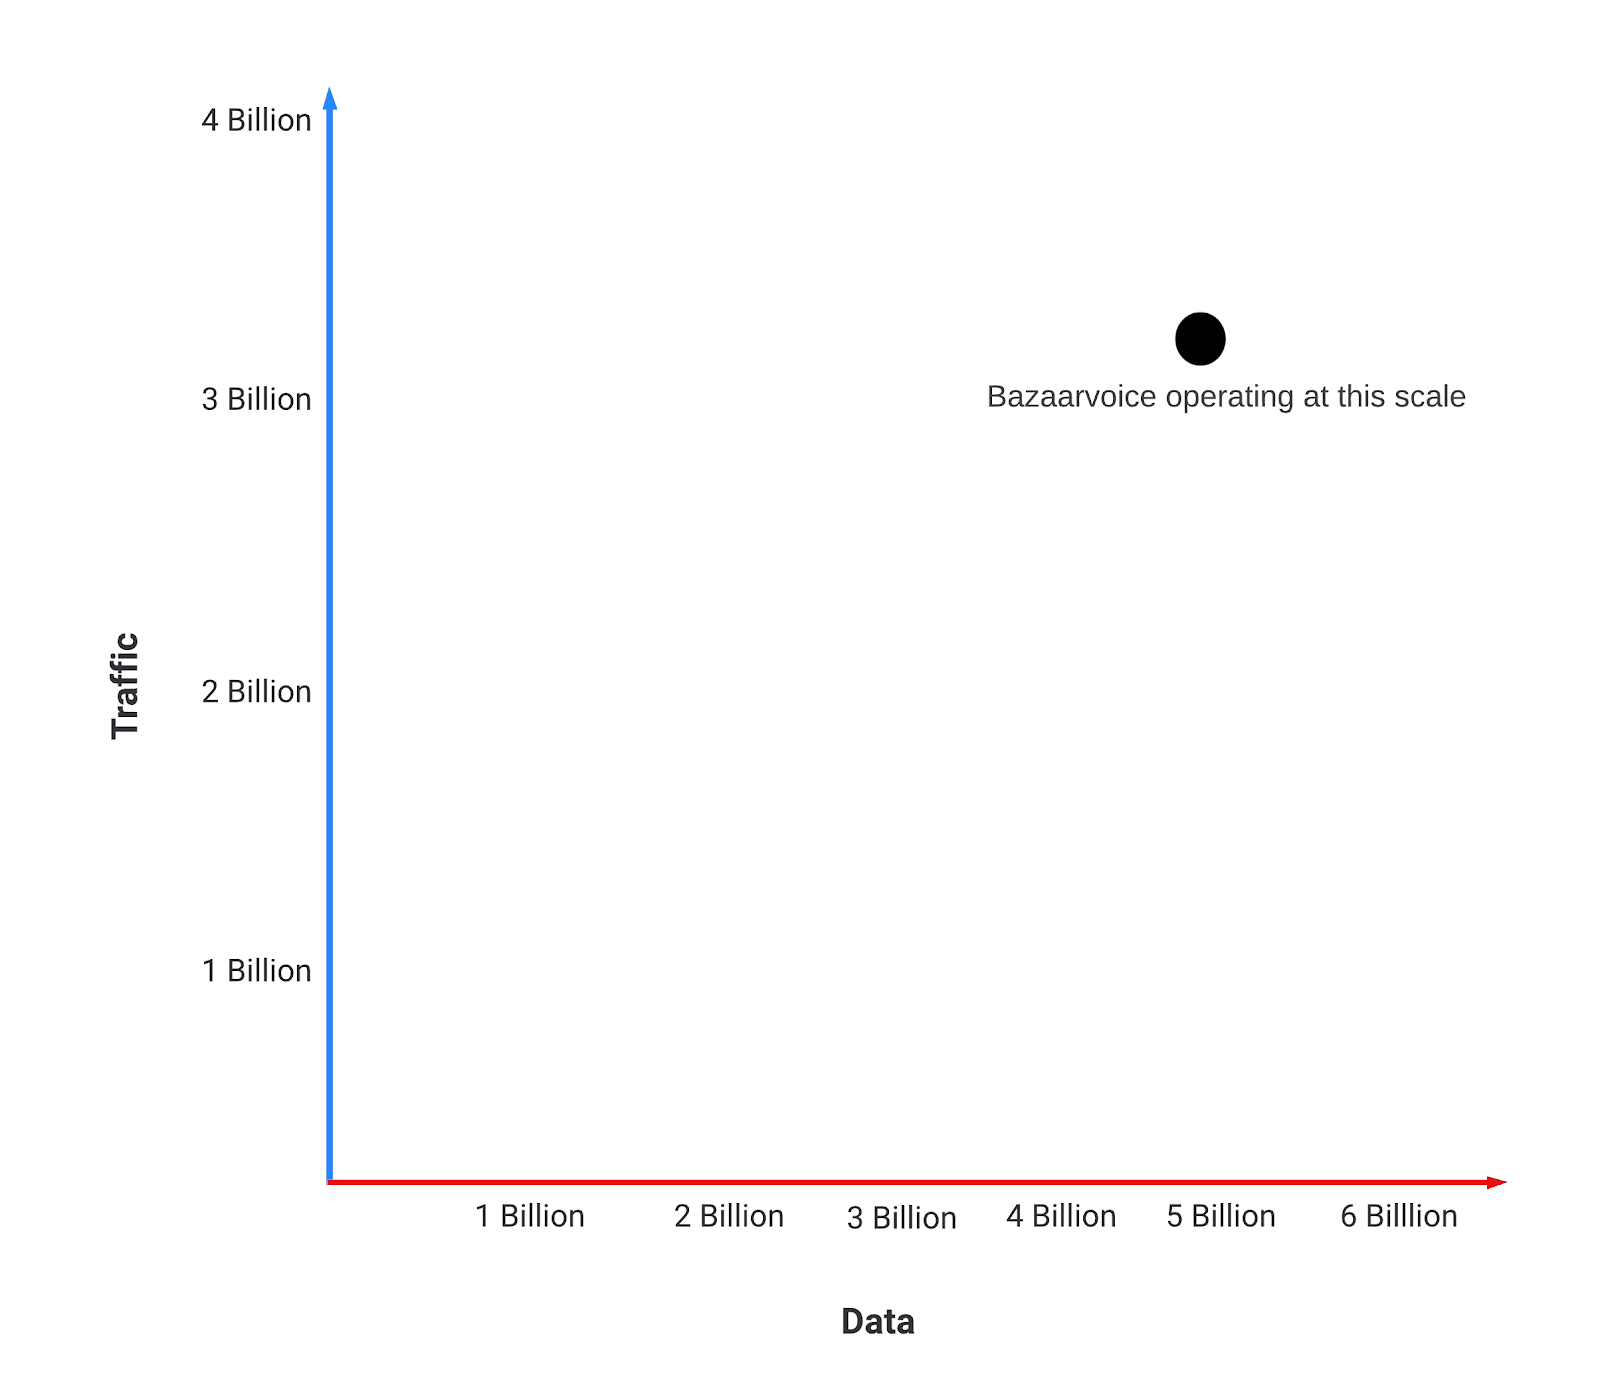
| Traffic: 3+ Billion calls per day(peek) | Data: ~5 Billions of records,Terabyte scale |
High-level API Flow:
- Whenever a request is made to Bazaarvoice UGC API endpoints, the Bazaarvoice gateway service receives the request, authenticates the request, and then transmits the request information to the application load balancer.
- Upon receiving the request from the load balancer, the application server engages with authentication service to authenticate the request. If the request is deemed legitimate, the application proceeds to make a call to its database servers to retrieve the necessary information and the application formulates response accordingly.
Let’s get into a bit deeper into the design
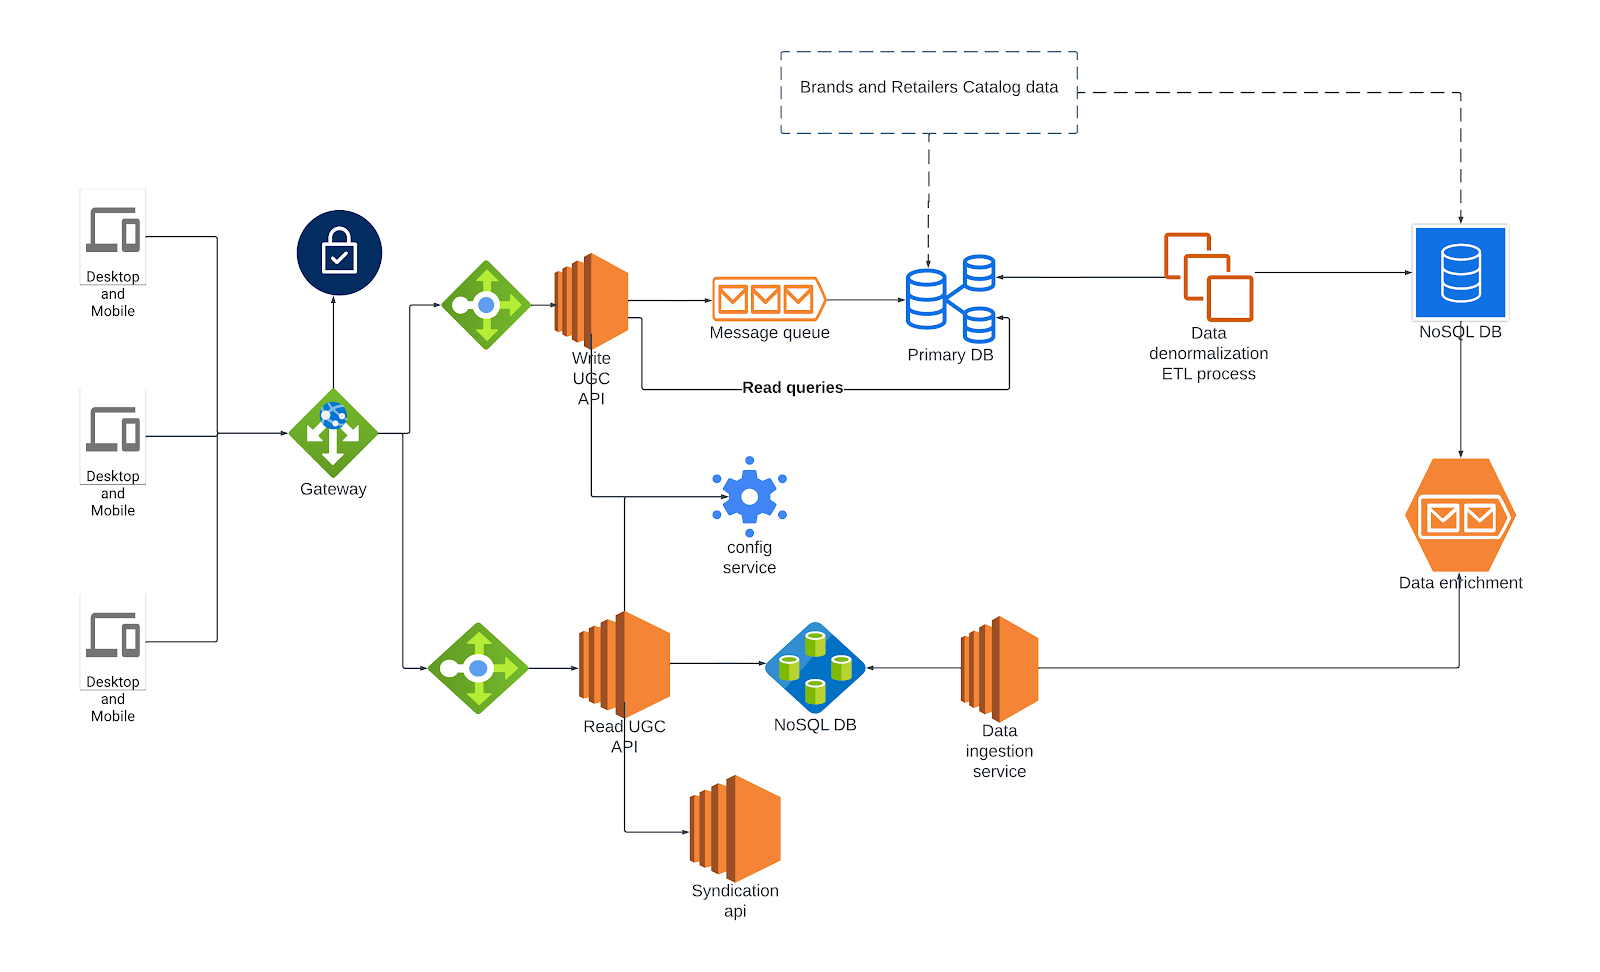
Actions taken at the gateway upon receiving a request
- API’s authentication:
We have an authentication service integrated to the gateway to validate the request. If it’s a valid request then we proceed further. Validation includes ensuring that the request is from a legitimate source to serve one of Bazaarvoice’s clients
- API’s security:
If our API’s are experiencing any security attacks like Malicious or DDOS requests, WAF intercepts and subsequently blocks the security attacks as per the configured settings.
- Response Caching:
We implemented response caching to improve response times and client page load performance, with a duration determined by the Time-to-Live (TTL) configuration for requests. This allows our gateway to resend the cached response, if the same request is received again, rather than forwarding the request to the server.
Understanding User-Generated Content (UGC) Data Types and API Services
Before delving into specifics of how the UGC is originally collected, it’s important to understand the type of data being served.
e.g.
- Ratings & Reviews
- Questions & Answers
- Statistics (Product-based Review Statistics and Questions & Answers Statistics)
- Products & Categories
For more details, you can refer to ConversationsAPI documentation via Bazaarvoice’s recently upgraded Developer Center.
Now, let’s explore the internals of these APIs in detail, and examine their interconnectedness.
- Write UGC API service
- Read UGC API service
Write UGC API service:
Our submission form customized for each client, the form will render based on the client configuration which can include numerous custom data attributes to serve their needs. When a shopper submits content such as a review or a question through the form, our system writes this content to a submission queue. A downstream internal system then retrieves this content from the queue and writes it into the master database.
Why do we have to use a queue rather than directly writing into a database?
- Load Leveling
- Asynchronous Processing
- Scalability
- Resilience to Database Failures
Read UGC API service:
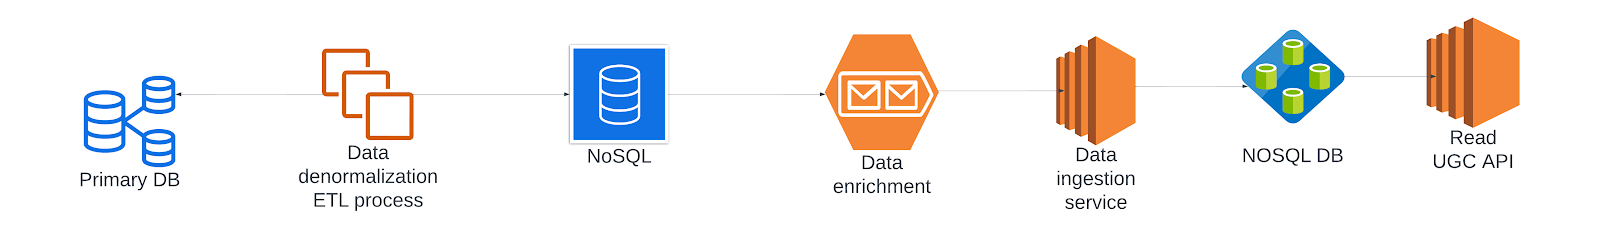
The UGC read API’s database operates independently from the primary, internal database. While the primary database contains normalized data, the read API database is designed to serve denormalized and enriched data specifically tailored for API usage in order to meet the response time expectations of Bazaarvoice’s clients and their shoppers.
Why do we need denormalized data?
To handle large-scale traffic efficiently and avoid complex join operations in real-time, we denormalize our data according to specific use cases.
We transform the normalized data into denormalized enriched data through the following steps:
- Primary-Replica setup: This will help us to separate write and read calls.
- Data denormalization: In Replica DB, we have triggers to do data processing (joining multiple tables) and write that data into staging tables. We have an application that reads data from staging tables and writes the denormalized data into Nosql DB. Here data is segregated according to the content type. Subsequently, this data is forwarded to message queues for enrichment.
- Enriching the denormalized data: Our internal applications consume this data from message queues, with the help of internal state stores, we enrich the documents before forwarding them to a destination message queue.
e.g. : Average rating of a product, Total number of ugc information to a product.
- Data Transfer to UGC application Database: We have a connector application to consume data from the destination message queue and write it into the UGC application database.
Now that you’ve heard about how Bazaarvoice’s API’s handles the large client and request scale, let’s add another layer of complexity to the mix!
Connecting Brands and Retailers
Up to this point, we’ve discussed the journey of content within a given client’s dataset. Now, let’s delve into the broader problem that Bazaarvoice addresses.
Bazaarvoice helps its brands and retailers share reviews within the bazaarvoice network. For more details refer to syndicated-content.
Let’s talk about the scale and size of the problem before getting into details,
From 12,000+ Bazaarvoice clients, We have billions of catalog and UGC content. Bazaarvoice provides a platform to share the content within its network. Here data is logically separated for all the clients.
Client’s can access their data directly, They can access other Bazaarvoice clients data, based on the Bazaarvoice Network’s configured connections.
E.g. :
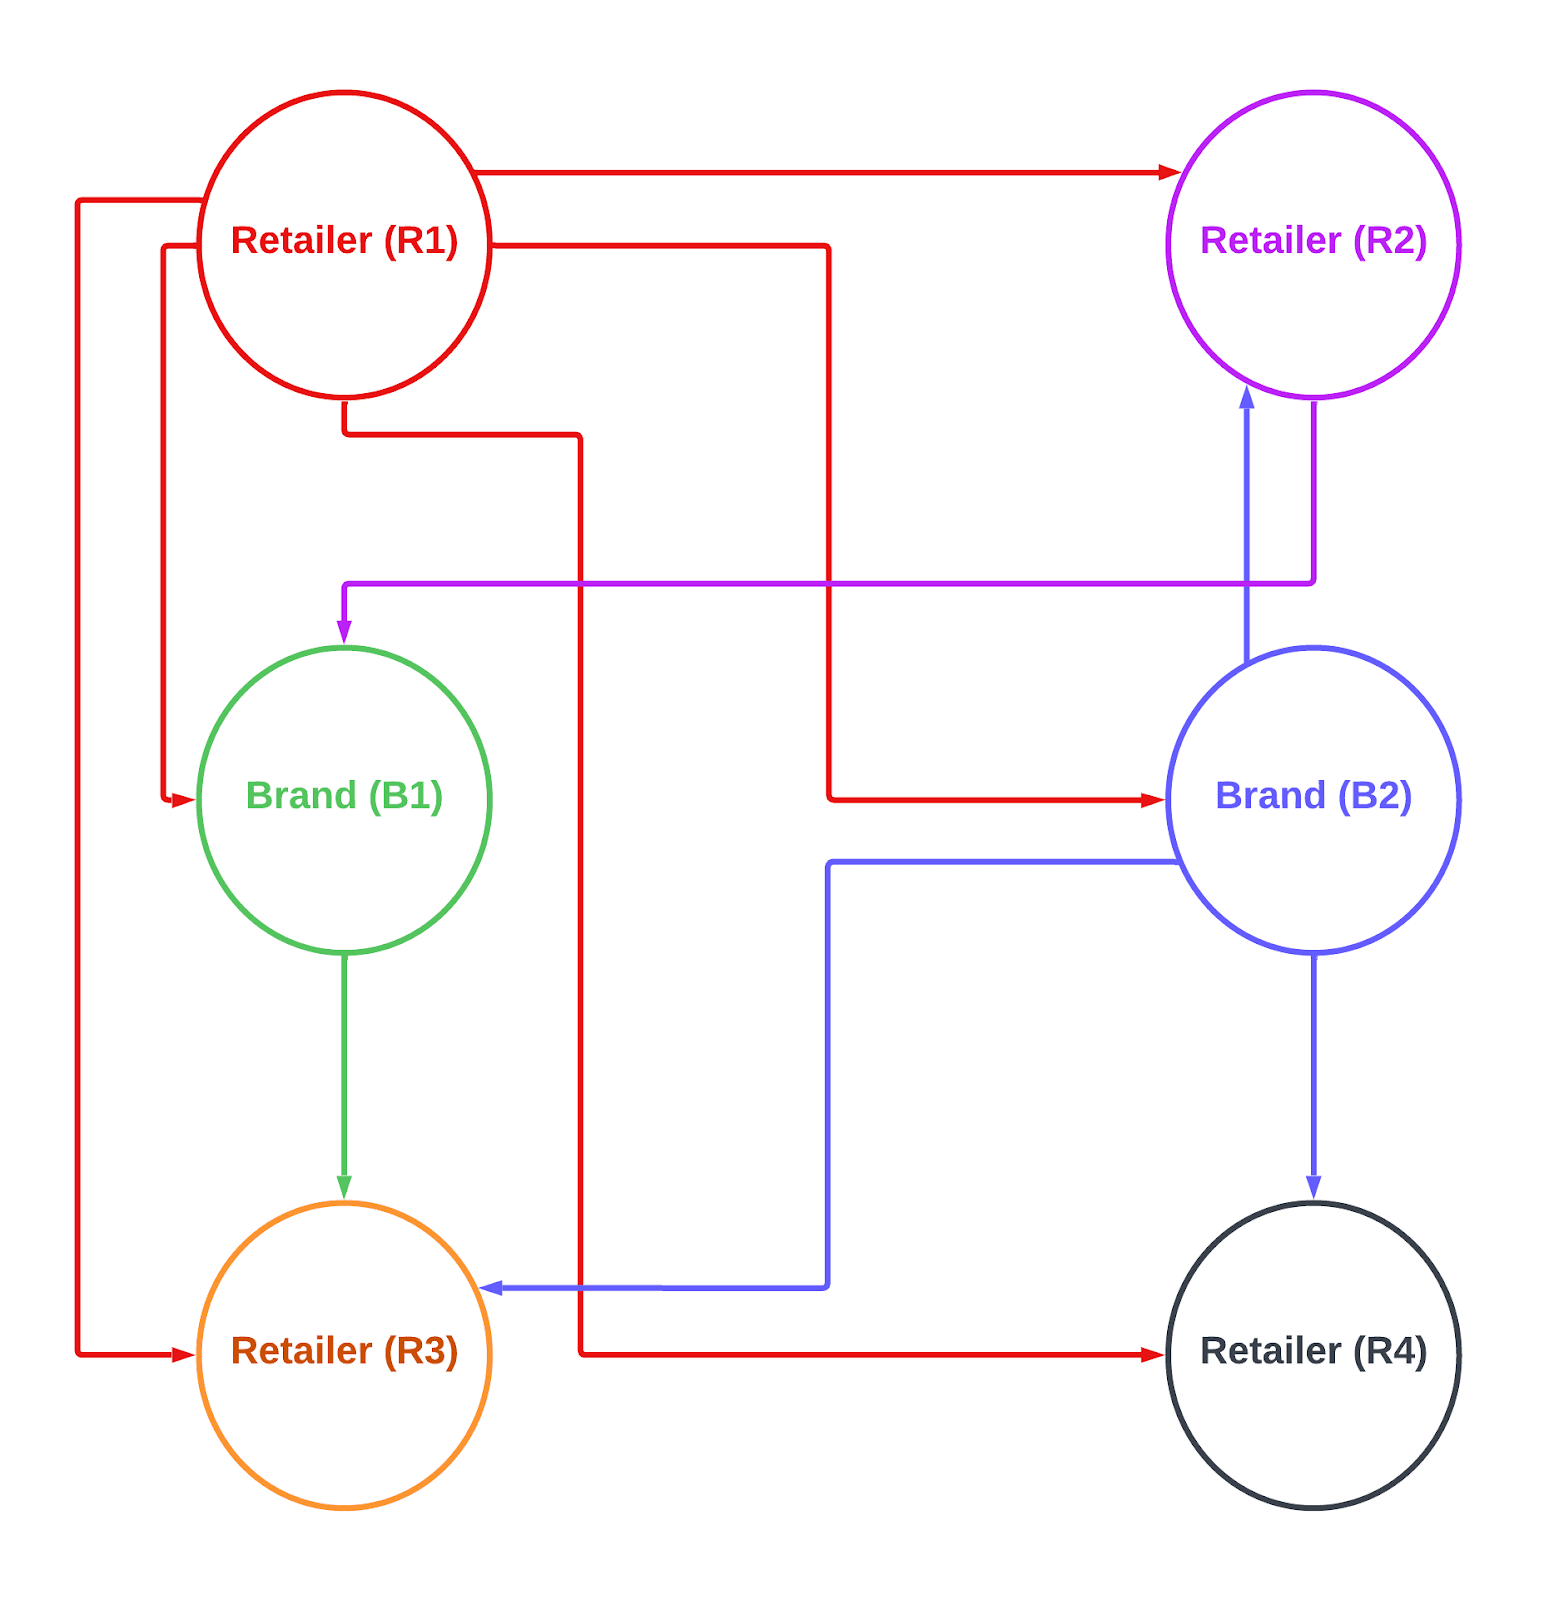
From the above diagram, Retailer (R3) wanted to increase their sales of a product by showing a good amount of UGC content.
| Retailer (R1) | 1 billion catalog & ugc records |
| Retailer (R2) | 2 billion catalog & ugc records |
| Retailer (R3) | 0.5 billion catalog & ugc records |
| Retailer (R4) | 1.2 billion catalog & ugc records |
| Brand (B1) | 0.2 billion catalog & ugc records |
| Brand (B2) | 1 billion catalog & ugc records |
Now think,
If Retailer (R3) is accessing only its data, then it’s operating on 0.5 billion records, but here Retailer (R3) is configured to get the ugc data from Brand (B1) , Brand (B2) , Retailer (R1) also.
If you look at the scale now it’s 0.5 + 0.2 + 1 + 1 = 2.7 billions.
To get the data for one request, it has to query on 2.7 billion records. On top of it we have filters and sorting, which make it even more complex.
In Summary
Here I’ve over simplified, to make you understand the solution that Bazaarvoice is providing, in reality it’s much more complex to serve the UGC Write and Read APIs at a global scale with fast response times and remain globally resilient to maintain high uptime.
Now you might correlate why we have this kind of architecture designed to solve this problem. Hopefully after reading this post you have a better understanding of what it takes behind the scenes to serve User Generated Content across Brands and Retailers at billion-record-scale to shoppers across the globe.