

Introduction
Large language models are fantastic tools for unstructured text, but what if your text doesn’t fit in the context window? Bazaarvoice faced exactly this challenge when building our AI Review Summaries feature: millions of user reviews simply won’t fit into the context window of even newer LLMs and, even if they did, it would be prohibitively expensive.
In this post, I share how Bazaarvoice tackled this problem by compressing the input text without loss of semantics. Specifically, we use a multi-pass hierarchical clustering approach that lets us explicitly adjust the level of detail we want to lose in exchange for compression, regardless of the embedding model chosen. The final technique made our Review Summaries feature financially feasible and set us up to continue to scale our business in the future.
The Problem
Bazaarvoice has been collecting user-generated product reviews for nearly 20 years so we have a lot of data. These product reviews are completely unstructured, varying in length and content. Large language models are excellent tools for unstructured text: they can handle unstructured data and identify relevant pieces of information amongst distractors.
LLMs have their limitations, however, and one such limitation is the context window: how many tokens (roughly the number of words) can be put into the network at once. State-of-the-art large language models, such as Athropic’s Claude version 3, have extremely large context windows of up to 200,000 tokens. This means you can fit small novels into them, but the internet is still a vast, every-growing collection of data, and our user-generated product reviews are no different.
We hit the context window limit while building our Review Summaries feature that summarizes all of the reviews of a specific product on our clients website. Over the past 20 years, however, many products have garnered thousands of reviews that quickly overloaded the LLM context window. In fact, we even have products with millions of reviews that would require immense re-engineering of LLMs to be able to process in one prompt.
Even if it was technically feasible, the costs would be quite prohibitive. All LLM providers charge based on the number of input and output tokens. As you approach the context window limits for each product, of which we have millions, we can quickly run up cloud hosting bills in excess of six figures.
Our Approach
To ship Review Summaries despite these technical, and financial, limitations, we focused on a rather simple insight into our data: Many reviews say the same thing. In fact, the whole idea of a summary relies on this: review summaries capture the recurring insights, themes, and sentiments of the reviewers. We realized that we can capitalize on this data duplication to reduce the amount of text we need to send to the LLM, saving us from hitting the context window limit and reducing the operating cost of our system.
To achieve this, we needed to identify segments of text that say the same thing. Such a task is easier said than done: often people use different words or phrases to express the same thing.
Fortunately, the task of identifying if text is semantically similar has been an active area of research in the natural language processing field. The work by Agirre et. al. 2013 (SEM 2013 shared task: Semantic Textual Similarity. In Second Joint Conference on Lexical and Computational Semantics) even published a human-labeled data of semantically similar sentences known as the STS Benchmark. In it, they ask humans to indicate if textual sentences are semantically similar or dissimilar on a scale of 1-5, as illustrated in the table below (table from Cer et. al., SemEval-2017 Task 1: Semantic Textual Similarity Multilingual and Crosslingual Focused Evaluation):
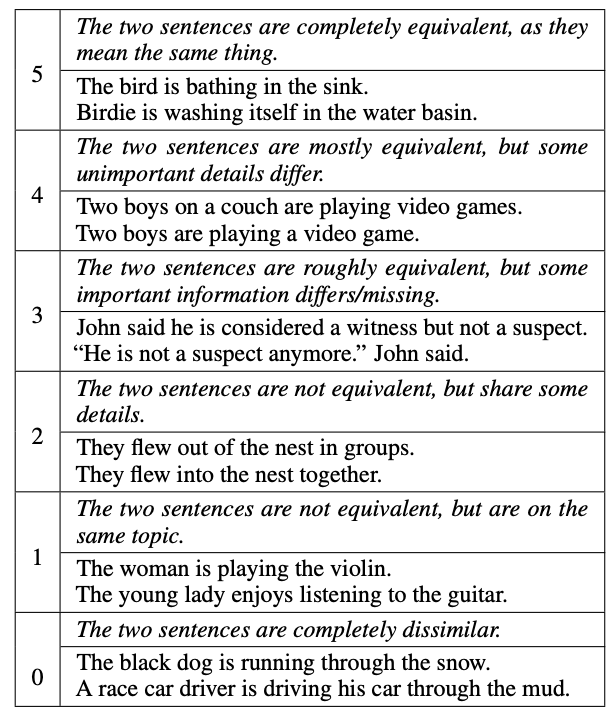
The STSBenchmark dataset is often used to evaluate how well a text embedding model can associate semantically similar sentences in its high-dimensional space. Specifically, Pearson’s correlation is used to measure how well the embedding model represents the human judgements.
Thus, we can use such an embedding model to identify semantically similar phrases from product reviews, and then remove repeated phrases before sending them to the LLM.
Our approach is as follows:
- First, product reviews are segmented the into sentences.
- An embedding vector is computed for each sentence using a network that performs well on the STS benchmark
- Agglomerative clustering is used on all embedding vectors for each product.
- An example sentence – the one closest to the cluster centroid – is retained from each cluster to send to the LLM, and other sentences within each cluster are dropped.
- Any small clusters are considered outliers, and those are randomly sampled for inclusion in the LLM.
- The number of sentences each cluster represents is included in the LLM prompt to ensure the weight of each sentiment is considered.
This may seem straightforward when written in a bulleted list, but there were some devils in the details we had to sort out before we could trust this approach.
Embedding Model Evaluation
First, we had to ensure the model we used effectively embedded text in a space where semantically similar sentences are close, and semantically dissimilar ones are far away. To do this, we simply used the STS benchmark dataset and computed the Pearson correlation for the models we desired to consider. We use AWS as a cloud provider, so naturally we wanted to evaluate their Titan Text Embedding models.
Below is a table showing the Pearson’s correlation on the STS Benchmark for different Titan Embedding models:
| Model | Dimensionality | Correlation on STS Benchmark |
| amazon.titan-embed-text-v1 | 1536 | 0.801031 |
| amazon.titan-embed-text-v2:0 | 256 | 0.818282 |
| amazon.titan-embed-text-v2:0 | 512 | 0.854073 |
| amazon.titan-embed-text-v2:0 | 1024 | 0.868574 |
| State-of-the-art | 0.929 |
So AWS’s embedding models are quite good at embedding semantically similar sentences. This was great news for us – we can use these models off the shelf and their cost is extremely low.
Semantically Similar Clustering
The next challenge we faced was: how can we enforce semantic similarity during clustering? Ideally, no cluster would have two sentences whose semantic similarity is less than humans can accept – a score of 4 in the table above. Those scores, however, do not directly translate to the embedding distances, which is what is needed for agglomerative clustering thresholds.
To deal with this issue, we again turned to the STS benchmark dataset. We computed the distances for all pairs in the training dataset, and fit a polynomial from the scores to the distance thresholds.

This polynomial lets us compute the distance threshold needed to meet any semantic similarity target. For Review Summaries, we selected a score of 3.5, so nearly all clusters contain sentences that are “roughly” to “mostly” equivalent or more.
It’s worth noting that this can be done on any embedding network. This lets us experiment with different embedding networks as they become available, and quickly swap them out should we desire without worrying that the clusters will have semantically dissimilar sentences.
Multi-Pass Clustering
Up to this point, we knew we could trust our semantic compression, but it wasn’t clear how much compression we could get from our data. As expected, the amount of compression varied across different products, clients, and industries.
Without loss of semantic information, i.e., a hard threshold of 4, we only achieved a compression ratio of 1.18 (i.e., a space savings of 15%).
Clearly lossless compression wasn’t going to be enough to make this feature financially viable.
Our distance selection approach discussed above, however, provided an interesting possibility here: we can slowly increase the amount of information loss by repeatedly running the clustering at lower thresholds for remaining data.
The approach is as follows:
- Run the clustering with a threshold selected from score = 4. This is considered lossless.
- Select any outlying clusters, i.e., those with only a few vectors. These are considered “not compressed” and used for the next phase. We chose to re-run clustering on any clusters with size less than 10.
- Run clustering again with a threshold selected from score = 3. This is not lossless, but not so bad.
- Select any clusters with size less than 10.
- Repeat as desired, continuously decreasing the score threshold.
So, at each pass of the clustering, we’re sacrificing more information loss, but getting more compression and not muddying the lossless representative phrases we selected during the first pass.
In addition, such an approach is extremely useful not only for Review Summaries, where we want a high level of semantic similarity at the cost of less compression, but for other use cases where we may care less about semantic information loss but desire to spend less on prompt inputs.
In practice, there are still a significantly large number of clusters with only a single vector in them even after dropping the score threshold a number of times. These are considered outliers, and are randomly sampled for inclusion in the final prompt. We select the sample size to ensure the final prompt has 25,000 tokens, but no more.
Ensuring Authenticity
The multi-pass clustering and random outlier sampling permits semantic information loss in exchange for a smaller context window to send to the LLM. This raises the question: how good are our summaries?
At Bazaarvoice, we know authenticity is a requirement for consumer trust, and our Review Summaries must stay authentic to truly represent all voices captured in the reviews. Any lossy compression approach runs the risk of mis-representing or excluding the consumers who took time to author a review.
To ensure our compression technique was valid, we measured this directly. Specifically, for each product, we sampled a number of reviews, and then used LLM Evals to identify if the summary was representative of and relevant to each review. This gives us a hard metric to evaluate and balance our compression against.
Results
Over the past 20 years, we have collected nearly a billion user-generated reviews and needed to generate summaries for tens of millions of products. Many of these products have thousands of reviews, and some up to millions, that would exhaust the context windows of LLMs and run the price up considerably.
Using our approach above, however, we reduced the input text size by 97.7% (a compression ratio of 42), letting us scale this solution for all products and any amount of review volume in the future.
In addition, the cost of generating summaries for all of our billion-scale dataset reduced 82.4%. This includes the cost of embedding the sentence data and storing them in a database.


