
Are you working on an agile team? Odds are high that you probably are. Whether you do Scrum/Kanban/lean/extreme, you are all about getting work done with the least resistance possible. Heck, if you are still on Waterfall, you care about that. But how well are you doing? Do you know? Is that something a developer or a lead should even worry about or is a SEP? That’s a trick question. If your team is being held accountable and there is a gap between their expectations and your delivery, by the transitive property, you should worry about some basic lean metrics.
Here at Bazaarvoice, we are agile and overwhelmingly leverage kanban. Kanban emphasizes the disciplines of flow and continuous improvement. In an effort to make data-driven decisions about our improvements, we needed an easy way to get the relevant data. With just JIRA and GitHub alone, access to the right data has a significant barrier to entry.
So, like any enterprising group of engineers, we built an app for that.
What we did
Some of us had recently gone through an excellent lean metric forecasting workshop with Troy Magennis from Focused Objective. In his training he presented the idea of displaying a quadrant of lean metrics in order to force a narrative for a teams behavior, and to avoid overdriving on a single metric. This really resonated with me and seemed like good paradigm for the app we wanted to build.
And thus, Vger was born.
We went with a simple quadrant view with very bookmarkable url parameters. We made it simple to for teams to self-service by giving them an interface to make their own “Vger team” and add whatever “Vger boards” they need. Essentially, if you can make a JQL query and give it a board in JIRA, Vger can graph the metrics for it. In the display, we provide a great deal of flexibility by letting teams configure date ranges for the dashboard, work types to be displayed, and the JIRA board columns to be considered as working/non-working.
Now the barrier to entry for lean metrics is down to “can you open a browser.” Not too shabby.
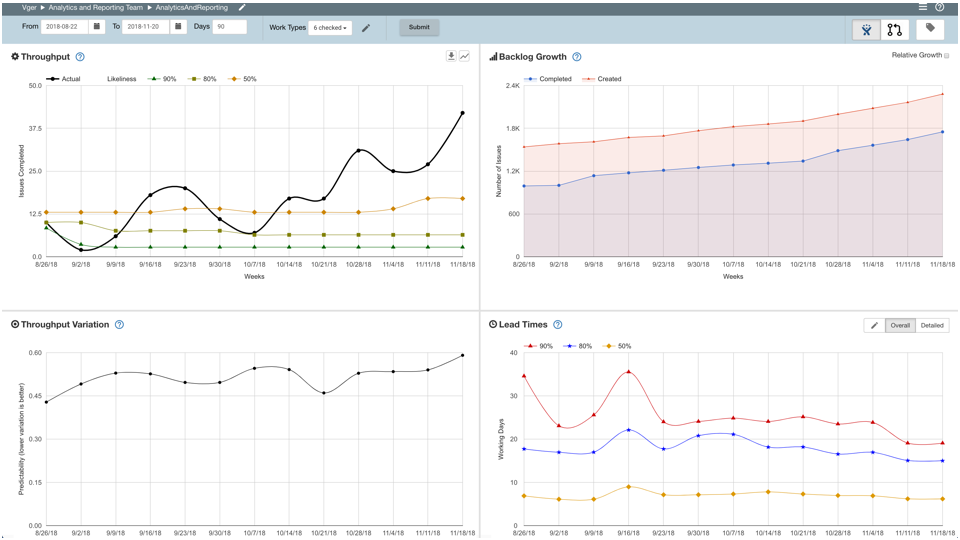
The Quadrant View
We show the following in the quadrant view:
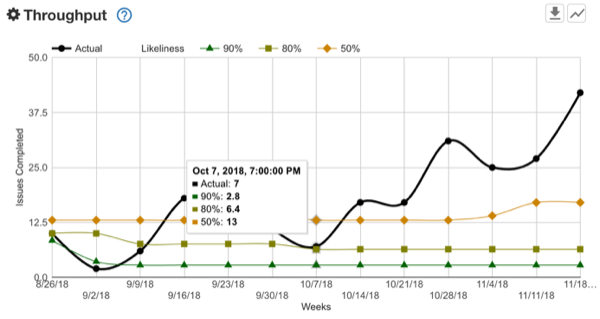
1. Throughput – The number of completed tickets per week.
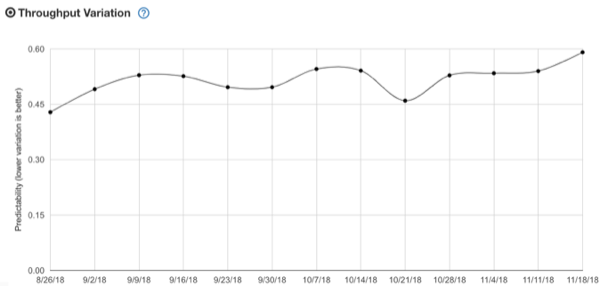
2. Variation – the variation (standard deviation/mean) for the Throughput.
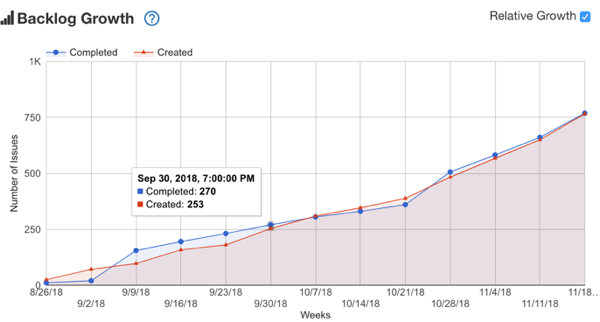
3. Backlog Growth – the tickets opened versus closed.
4. Lead Times – The lead times for the completed tickets. This also provides a detailed view by Jira board column to see where you spend most of your time.
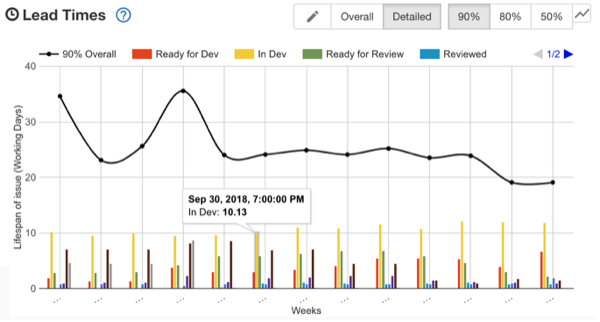
We at Bazaarvoice are conservative gamblers, so you’ll see the throughput and lead time quadrants show the 50%, 80%, and 90% likelihood (the inverse of percentile). We do this because relying on the average or mean is not your friend. Who want’s to bet on a coin toss? Not us. We like to be right say, eight out of ten times.
The Quarterly View
Later, we were asked to show throughput by quarter to help with quarterly goal planning. We created a side-car page for this. It shows Throughput by quarter:

We also built a scatterplot for lead times so outliers could be investigated:

This view has zoomable regions and each point lets you click through to the corresponding JIRA ticket. So that’s nice.
But Wait! Git This….
From day one, we chose to show the same Quadrant for GitHub Pull Requests.
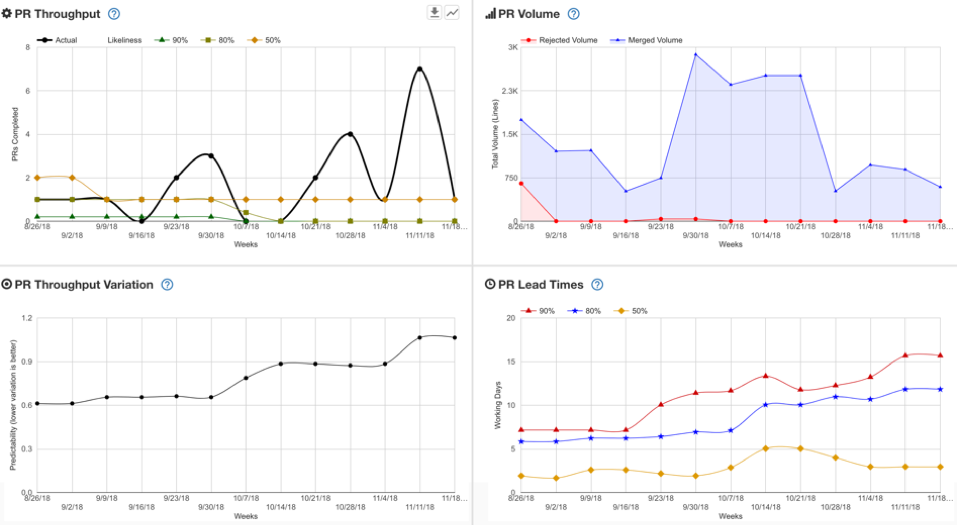
Note that we show rejected and merged lines in the PR Volume quadrant. We also support overlaying your git tags on both PR and JIRA ticket data. Pretty sweet!
I Want to Do More
Vger lets you download throughput data from the Quadrant and Quarterly views. You can also download lead time from the Quarterly view too. This lets teams and individuals perform their own visualizations and investigations on these very useful lean metrics.
But Why?
Vger was built with three use cases in mind:
Teams should be informed in retros
Teams should have easy access to these key lean metrics in their retros. We recommend that they start off viewing the quadrant and seeing if they agree with the narrative the retro facilitator presents. They should also consider the results of any improvement experiments they tried. Did the new behavior make throughput go up as they hoped it would? It the new behavior reduce time spent in code review? Did it reduce the number open bugs? etc. Certainly not everything in a retro should be mercilessly data-driven, but it is a key element to a culture of continuous improvement.
Managers should know this data and speak to it
Team managers commonly speak to how their teams are progressing. These discussions should be data-driven, and most importantly it should be driven by the same data the team has access to (and hopefully retros to). It should also be presented in a common format that still provides for some customization. NOTE: You should avoid comparing team to team in Vger or a similar visualization. In most situations, that way leads to futility, confusion, and frustration.
We should have data to drive data-driven decisions about the future
Lean forecasting is beyond the scope of this post however, Troy Magennis has a fine take on it. My short two cents on the matter is: a reasonably functioning team with even a little bit of run time should never be asked “how long will it take?” Drop that low value ritual and do the high value task of decomposing the work, then forecast with historical data. Conveniently, you can download this historical data from Vger you used in your spreadsheet of choice. I happen to like monte carlo simulations myself.
Isn’t This for Kanban?
You’ll note I used the term “lean metrics” throughout. I wanted to avoid any knee-jerk “kanban vs scrum vs ‘how we do things'”reaction. These metrics apply no matter what methodology you consciously (or unconsciously) use for the flow of work through your team. It was built for feature development teams in mind, but we had good success when our client implementation team started using it as an early adopter. It allowed them to have a clear view into their lead time details and ferret out how much time was really spent waiting on clients to perform an action on their end.
Cool. How Do I Get a Vger?
We open sourced it here, so help yourself. This presented as “it worked for us”-ware and is not as finely polished as it could be, so it has some caveats. It is a very simple serverless app. We use JIRA and GitHub, so only those tools are currently supported. If you use similar, give Vger a try!
What’s Next?
If your fingers are itching to contribute, here’s some ideas:
- Vger’s ETL process could really use an update
- The Quadrant view UI really needs an update to React to match the Quarterly view
- Make it flexible for your chosen issue tracker or source control?
- How about adding a nice Cumulative Flow Diagram?