
Parth Shah and Thai Bui
Overview
One of the reasons why Hadoop jobs are hard to operate is their inability to provide clear, actionable error diagnostic messages for users. This stems from the fact that Hadoop consists of many interrelated components. When a component fails or behaves poorly, the failure will be cascaded to its dependent components which causes a job to fail.
This blog post is an attempt to help to solve that problem by created a user-friendly, self-serving and actionable Hadoop diagnostic system.
Our Goals
Due to its complex nature, the project was split into multiple components. First, we prototyped a diagnostic tool to help debug Hadoop application failure by providing a clear root cause analysis and save engineering time. Second we purposely inflict failures on a cluster (via a method called chaos testing) and collected the data to understand how certain log messages map to errors. Finally, we examined regular expression as well as natural language processing (NLP) techniques to automatically provide root cause analysis in production.
To document this, we organized the blog in the following sections:
- Error Message Analytics Portal
- To provide a quick glance at the known root cause.
- Datadog Dashboard
- To calculate failure rates related to the unknown root cause and known root cause.
- Separate infrastructure failure from a missing data failure (missing partition).
- Data Access
- All relevant logs messages from services like Yarn, Oozie, HDFS, hive server, etc. were collected and stored under an S3 bucket with an expiration policy.
- Chaos Data Generation
- Using chaos testing, we produced actual errors related to memory, network, etc. This was done to understand relationships between log messages and root cause errors.
- A service was made to create an efficient and simple way to run chaos tests and collect its corresponding/related log data.
- Diagnostic Message Classification
- Due to the simple and repetitive nature of log messages (low in entropy), we built a natural language processing model that classified specific error types of an unknown failure.
- Tested the model on the chaos data for the specific workload at Bazaarvoice
Error Message Analytics Portal
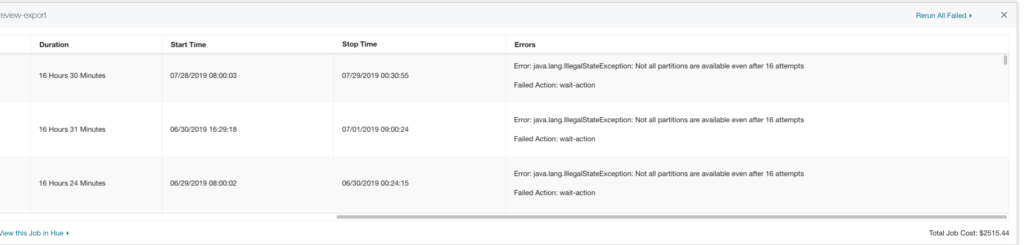
Bazaarvoice provides an internal portal tool for managing analytics applications by the end-users. The following screenshot demonstrates an example message of a “Job failures due to missing data”. This message is caught by using a simple regular expression of the stack trace. A regular expression works because there is only one way a job could fail due to missing data.
DataDog Dashboard
What is a partition?
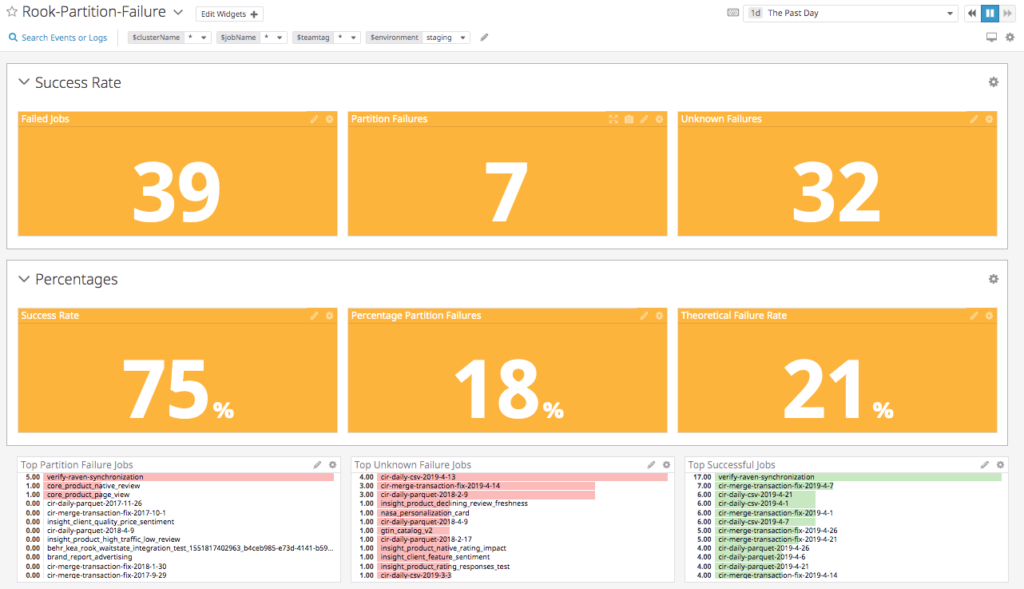
Partitioning is a strategy of dividing a table into related parts based on date, components or other categories. Using a partition, it is easy and faster to query a portion of data. However, the partition a job is querying can sometimes not be available which causes a job to fail by our design. The dashboard below calculates metrics and keeps track of jobs that failed due to an unavailable partition.
The dashboard classifies failed jobs as either a partition failure (late/missing data) or an unknown failure (Hadoop application failure). Our diagnostic tool attempts to find the root cause of the unknown failures since a late or missing data is an easy problem to solve.
Data Access
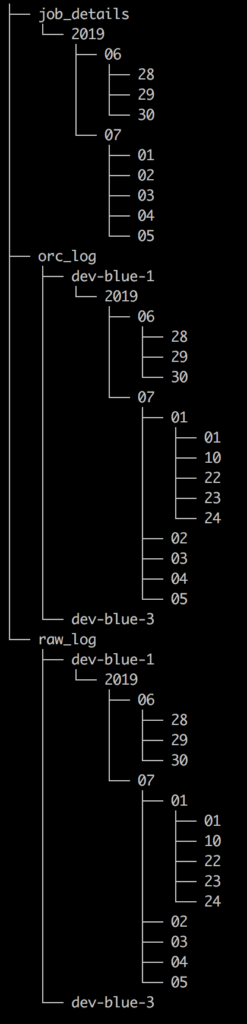
Since our clusters are powered by Apache Ambari, we leveraged and enhanced Ambari Logsearch Logfeeder to ship logs of relevant services directly to S3 and partitioned the data by as shown in the raw_log of the Directory Tree Diagram below. However, as the dataset got bigger, partitioning was not enough to efficiently query the data. To speed up read performance and to iterate faster, the data was later converted into ORC format.
Convert JSON logs to ORC logs
DROP TABLE IF EXISTS default.temp_table_orc;
CREATE EXTERNAL TABLE default.temp_table_orc (
cluster STRING,
file STRING,
thread_name STRING,
level STRING,
event_count INT,
ip STRING,
type STRING,
...
hour INT,
component STRING
) STORED AS ORC
LOCATION 's3a://<bucket_name>/orc-log/${workflowYear}/${workflowMonth}/${workflowDay}/${workflowHour}/';
INSERT INTO default.temp_table_orc SELECT * FROM bazaar_magpie_rook.rook_log
WHERE year=${workflowYear} AND month=${workflowMonth} AND day=${workflowDay} AND hour=${workflowHour};
Sample Queries for Root Cause Diagnosis
SELECT t1.log_message,
       t1.logtime,
       t1.level,
       t1.type,
       t2.Frequency
FROM
  (SELECT log_message,
          logtime,
          TYPE,
          LEVEL
   FROM
     ( SELECT log_message,
              logtime,
              TYPE,
              LEVEL,
              row_number() over (partition BY log_message
                                 ORDER BY logtime) AS r
      FROM bazaar_magpie_rook.rook_log
      WHERE cluster_name = 'cluster_name'
        AND DAY = 28
        AND MONTH=06
        AND LEVEL = 'ERROR' ) S
   WHERE S.r = 1 ) t1
LEFT JOIN
  (SELECT log_message,
          COUNT(log_message) AS Frequency
   FROM bazaar_magpie_rook.rook_log
   WHERE cluster_name = 'cluster_name'
     AND DAY = 28
     AND MONTH=06
     AND LEVEL = 'ERROR'
   GROUP BY log_message) t2 ON t1.log_message = t2.log_message
WHERE t1.logtime BETWEEN '2019-06-28 13:05:00' AND '2019-06-28 13:30:00'
ORDER BY t1.logtime
LIMIT 400;
SELECT log_message, logtime, type
FROM bazaar_magpie_rook.rook_log WHERE level = 'ERROR' AND type != 'logsearch_feeder' AND logtime BETWEEN '2019-06-24 09:05:00' AND '2019-06-24
12:30:10'
ORDER BY logtime
LIMIT 1000;
SELECT log_message, COUNT(log_message) AS Frequency
FROM  bazaar_magpie_rook.rook_log
WHERE cluster_name = 'dev-blue-3' AND level = 'ERROR' AND logtime BETWEEN '2019-06-27 13:50:00' AND '2019-06-29 14:30:00'
GROUP BY log_message
ORDER BY COUNT(log_message) DESC
LIMIT 10;
Chaos Data Generation
The chaos data generation process makes up a bulk of this project as well is the most important. It stems from the process of chaos testing to experiment on software and infrastructure in order to understand the systems ability to withstand unexpected or turbulent conditions. This concept of testing was first introduced by Netflix in 2011. The following pseudocode explains how it works.
Submit a normal job through an API on a specific cluster
Create a list of IP addresses for all the testable nodes in that cluster (such as the workers nodes).
Once we have all associated nodes, inject failures into them (stress test memory or network)
While the job is not done
Let the job run
At this point, the job has either failed or succeeded
Stop all stress tests
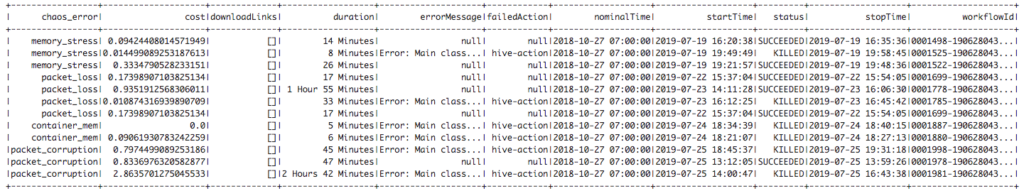
Gather the job details such as start time, end time, status, and most importantly its associated stress test type (memory, packet_corruption, etc.).
Store job details and its report in JSON formatJob Report Example
{
"duration":"45 Minutes",
"nominalTime":"2018-10-27 07:00:00",
"cost":0.7974499089253186,
"downloadLinks":[],
"errorMessage":"Error: Main class [org.apache.oozie.action.hadoop.Hive2Main], exit code [2]",
"startTime":"2019-07-25 18:45:37",
"stopTime":"2019-07-25 19:31:18","failedAction":"hive-action",
"chaos_error":"packet_corruption",
"workflowId":"0001998-190628043141230-oozie-oozi-W",
"status":"KILLED"
}
We followed the same process to generate chaos data on different types of injected failures such as:
- High Memory Utilization on the Host
- Packet Corruption
- Packet Loss
- High Memory Util on a Container
While there are certainly more errors the model is capable of learning and classifying, for the purpose of prototyping we kept the type of failures to 2-3 categories.
Diagnostic Message Classification
In this section, we explore 2 types of error classification methods, a simple regex and supervised learning.
Short Term Solution with Regex
There are many ways to analyze text for different patterns. One of these ways is called Regular Expression Matching (regex). Regex is “special strings representing a pattern to be matched in search operation”. One use of regex is finding a keyword like “partition”. When a job fails due to missing partitions its error message usually looks something like this “Not all partitions are available even after 16 attempts“. The regex for this specific case would look like \W*((?i)partition(?-i))\W* .
A regex log parser could easily be able to identify this error and do what is necessary to fix the problem. However, the power of regex is very limiting when it comes to analyzing complex log messages and stack traces. When we find a new error, we would have to manually hardcode a new regular expression to pattern match the new error type which is very error-prone and tedious in the long run.
Since the Hadoop eco-system includes many components, there are many combinations of log messages that can be produced; a simple regex parser would be difficult to work here because it can not process general similarities between different sentences. This is where natural language processing helps.
Long Term Solution with Supervised Learning
The idea behind this solution is to use natural language processing to process log messages and supervised learning to learn and classify errors. This model should work well with log data vs. normal language due since machine logs are more structured and low in entropy. You can think of entropy as a measure of how unstructured or random a set of data is. The English language tends to have high entropy relative to machine logs due to its sometimes illogical sentence structure. On the other hand, machine-generated log data is very repetitive which makes it easier to model and classify.
Our model required pre-processing of logs which are called tokenization. Tokenization is the process of taking a set of text and breaking it up into its individual words or tokens. Next, the set of tokens were used to model their relationship in high dimensional space using Word2Vec. Word2Vec is a widely popular model used for learning vector representation of words called, “word embeddings” (word2vec). Finally, we use the vector representation to train a simple logistic regression classifier using the chaos data generated earlier. The diagram below shows a similar training processing from Experience Report: Log Mining using Natural Language Processing and Application to Anomaly Detection by Christophe Bertero, Matthieu Roy, Carla Sauvanaud and Gilles Tredan.
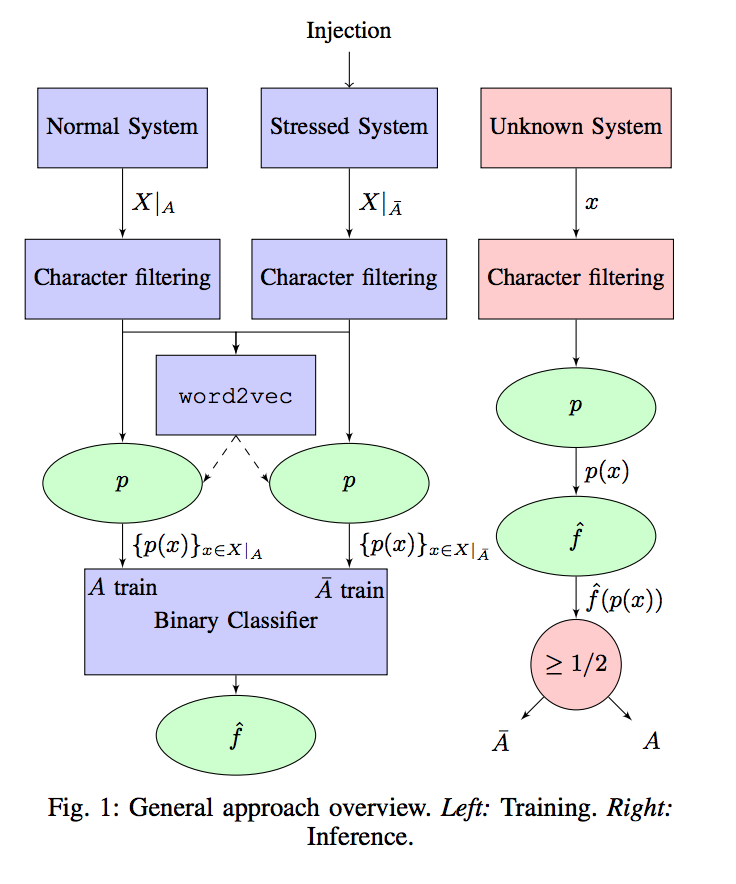
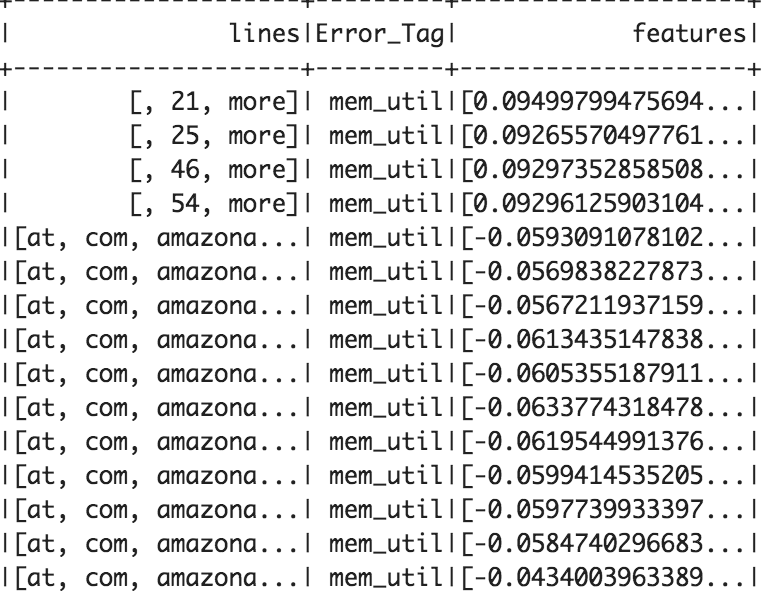
In contrast to the diagram above, since we only trained the classifier on error logs, it was not possible to classify a normal system as it should produce no error logs. Instead, we trained the data on different types of stressed systems. Using the dataset generated by chaos testing, we were able to identify the root cause for each of the error message for each failed job. This allowed us to make our training dataset as shown below. We split our dataset into a simple 70% training and 30% for testing.
Subsequently, each log message was tokenized to create a word vector. All the tokens were inputted into a pre-trained word2vec model which mapped out each word in a vector space, creating a word embedding. Each line was represented as a list of vectors and an average of all the vectors in a log message represents the feature vector in high dimensional space. We then inputted each feature vector and its labels into a classification algorithm such as logistic regression or random forest to create a model that could predict the root cause error from a logline. However, since failure often contains multiple error log messages, it would not be logical to simply reach a root cause conclusion from just a single line of the log from a long error log. A simple way to tackle this problem would be to window the log and input the individual lines from the window into the model and output the final error as the most common error outputted by all the lines in a window. This is a very naive way of breaking apart long error log so more research would have to be done to process error logs without losing the valuable insight of their dependent messages.
Below are a few examples of error log messages and their tokenized version.
Example Raw Log
java.lang.RuntimeException: org.apache.thrift.transport.TSaslTransportException: No data or no sasl data in the stream at org.apache.thrift.transport.TSaslServerTransport$Factory.getTransport(TSaslServerTransport.java:219)
    at org.apache.thrift.server.TThreadPoolServer$WorkerProcess.run(TThreadPoolServer.java:269)
    at java.util.concurrent.ThreadPoolExecutor.runWorker(ThreadPoolExecutor.java:1149)
    at java.util.concurrent.ThreadPoolExecutor$Worker.run(ThreadPoolExecutor.java:624)
    at java.lang.Thread.run(Thread.java:748) [?:1.8.0_191] Caused by: org.apache.thrift.transport.TSaslTransportException: No data or no sasl data in the stream at org.apache.thrift.transport.TSaslTransport.open(TSaslTransport.java:328)
    at org.apache.thrift.transport.TSaslServerTransport.open(TSaslServerTransport.java:41) ~[hive-exec-3.1.0.3.1.0.0-78.jar:3.1.0-SNAPSHOT] at org.apache.thrift.transport.TSaslServerTransport$Factory.getTransport(TSaslServerTransport.java:216)
Tokenized Raw Log
[java,lang,RuntimeException,org,apache,thrift,transport,TSaslTransportException,No,data,no,sasl,data,stream,org,apache,thrift,transport,TSaslServerTransport,Factory,getTransport,TSaslServerTransport,java219]
[org,apache,thrift,server,TThreadPoolExecutor,WorkerProcess,run,TThreadPoolServer,java,269]
...
Results
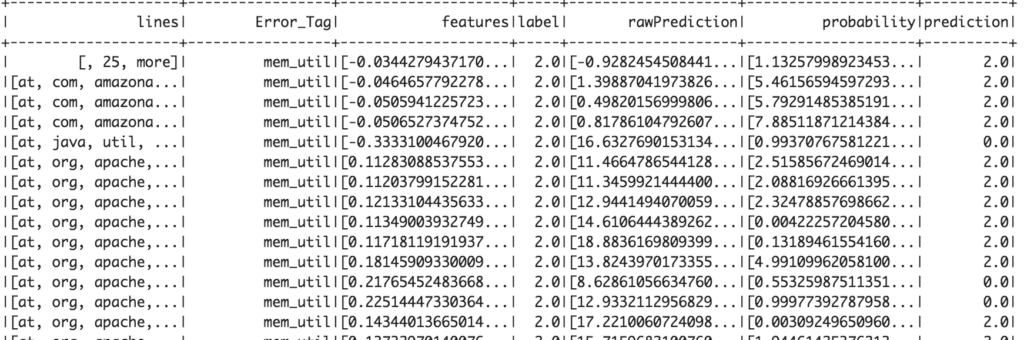
The model accurately predicted the root cause of failed job with 99.3% accuracy in our test dataset. At an initial glance, the metrics calculated on the test data look very promising. However, we still need to evaluate its efficiency in production to get a more accurate picture. The initial success in this proof of concept warrants further experimentation, testing, and investigation for using NLP to classify errors.
Training Data 70% (Top 20 Rows)
Test Data Results 30% (Top 20 Rows)
Conclusion
In order to implement this tool in production, data engineers will have to automate certain aspects of the data aggregation and model building pipeline
Self Reporting Errors
A machine learning model is only as good as its data. For this tool to be robust and accurate, any time engineers encounter a new error or an error that the model does not know about, they should report their belief of the root cause so the corresponding errors logs get tagged with the specific root cause error. For instance, when a job fails for a similar reason, the model will be able to diagnose and classify its error type. This can be done through a simple API, form, Hive query that takes in the job id and its assumed root_cause. The idea behind is this that by creating a form, we could manual label log messages and errors in case the classifier fails to correctly diagnose the true problem.
The self-reported error should take the form of the chaos error to ensure the existing pipeline will work.

Automating Chaos Data Generation
The chaos tests should run on a regular basis in order to keep the model up to date. This could be done by creating a Jenkins job that automatically runs on a regular cadence. Often times, running a stress test will make certain nodes to be unhealthy. It causes our automation to be unable to SSH into the nodes again to stop the stress test such as when the stress test is interfering with connectivity to the node (see the error below). This can be solved by creating a time limit for the stress test, so the script does not have to ssh again once the job has finished. In the long run, as the self-reported errors grow, the model should rely on chaos test generated test less. Chaos tests produce logs for very extreme situations which could be not typical for a normal production environment.
java.lang.RuntimeException: Unable to setup local port forwarding to 10.8.100.144:22
    at com.bazaarvoice.rook.infra.util.remote.Gateway.connect(Gateway.java:103)
    at com.bazaarvoice.rook.infra.regress.yarn.RootCauseTest.kill_memory_stress_test(RootCauseTest.java:174)