Conversations API Deprecation for Versions 5.2 and 5.3

Today we are announcing an important change to our Conversations API service:

  • On April 30, 2017 service will end for Conversations API versions 5.2 and 5.3

By deprecating older versions of our API service, we can refocus our energies on the current and future API services, which we feel offer the most benefits to our customers. Please visit our Upgrade Guide to learn more about the Conversations API, our API versioning, and the steps necessary to support the upgrade.

We understand that this change will require effort on your part. Bazaarvoice is committed to making this transition easy for you. We are prepared to assist you in a number of ways:

  • Pre-notification: You have more than 12 months to plan for and implement the change.
  • Documentation: We have specific documentation to help you.
  • Support: Our support team is ready to address any questions you may have.
  • Services: Our services teams are available to provide additional assistance.

In summary, on April 30, 2017, Conversations API versions released before 5.4 will no longer be available. Applications and websites using versions before 5.4 will no longer function properly after April 30, 2017. If your custom application or website is making API calls to Conversations API versions 5.2 or 5.3 you will need to upgrade to the current Conversations API (5.4). Applications using Conversations API versions 5.4 and later will continue to receive uninterrupted API service.

If you have any questions about this notice, please submit a case in Spark. We will periodically update this blog and our developer Twitter feed (@BazaarvoiceDev) as we move closer to the change of service date.

Visit the following page Coversations API 2017 Deprecation to learn more.

Thank you for your partnership,
Chris Kauffman
Manager, Product Management

What does a data scientist do?

More and more companies and industries are grappling with the challenges of extracting value from large amounts of data. Data scientists, the people whose job it is to overcome these challenges, are becoming more prominent, yet what it is they do, and how they’re different than software engineers, is still a mystery to a lot of people. The goal of this article is to explain one of the most important tools that data scientists use: machine learning (ML). The bottom-line is: using ML is slow, costly, and error-prone, but it allows companies to achieve business objectives that are unattainable any other way.

Just like a software engineer, the goal of a data scientist is to develop programs that perform business functions. In software engineering, the engineer writes a program that encodes all of the “rules” for what the program is supposed to do, based on the requirements. For example, take the task of returning all of the product reviews for a given product ID. The rules here include things like how to make sure the product ID is valid (and what to do when it’s not), how to query a database of reviews with the product ID, and how to format the reviews to be returned. A reasonably skilled software engineer can easily write a program that encodes all of these rules.

However, there are many problems where it is not feasible for anyone to write down all of the rules required for a software program to perform some task. Sometimes this is because the rules are simply not known, and other times it’s because there are way too many rules. Several good example of the latter type come from natural language processing (NLP), like the problem of predicting the sentiment of movie reviews (i.e. did the reviewer like the movie or not?). Like nearly all NLP problems, this is something that a human could do reasonably well, but it doesn’t mean that a person could easily write down a set of rules for how they made their decisions. If you had to, you’d probably start by listing key words or phrases that would indicate the reviewer’s sentiment, like “great”, “liked”, “smash hit”, “boring” and “terrible”, and use their appearance in a review to judge the sentiment. This will only work so far, because language is much more complex than that. You’d need additional rules to get around the fact that many of the key words can mean different things in different contexts, more rules to cover all of they ways that you can express sentiment without using a key word, and even more rules to detect when sentiment gets flipped by a negating phrase. Add to this the fact that people don’t actually write in perfect English, and you’d end up with a seemingly endless list of rules and an impossible software engineering problem.

ML has completely different approach: instead of writing out the rules in a top-down fashion, ML attempts to infer the rules in a bottom-up way, from data. For the problem of predicting the sentiment of movie reviews, you’d take a set of movie reviews with the actual sentiment of each, and feed them into a ML program. This ML program then literally outputs another program that takes in a movie review and outputs a prediction of its sentiment (with some expected accuracy). One reason that ML can work (not perfectly) on NLP problems is because where a human would have a very hard time creating millions and millions of rules, a computer has no such limitation.

Of course, there are a few catches to using ML. First, the data is not always cheap. Sentiment analysis of movie reviews has been popular topic only because many movie reviews online come with ratings (usually on a scale of 1 to 5), which tell you the answer — the term for this in ML is “ground truth”. For many problems, the ground truth is not readily available and can be very costly to figure it out. A recent Kaggle competition on this topic used a dataset of 50,000 movie reviews — imagine needing to read every single one of these to determine the ground truth sentiment.

Another catch, which I’ve already mentioned, is that ML will rarely produce a program with perfect accuracy. This is because for most real-world problems, it’s impossible to provide the ML program with all of the relevant information. For NLP problems, humans have a wealth of knowledge about what words mean, while computers do not. Many other real-world problems involve predicting human behavior, but it’s impossible to observe everything that’s going on in people’s heads. While ML algorithms are designed to make the most out of limited information, they’re only viable as a solution when the business objectives can tolerate some amount of error.

ML solutions are also slow to develop, even more so than standard software engineering solutions. As mentioned earlier, ML solutions need to work with limited information, which means that it’s impossible to know whether ML will meet the business’s requirements beforehand. Effective data scientists will make educated guesses about the data, ML algorithms, and algorithm parameters that are most likely to succeed based on the problem, but experimentation is always required. This can mean multiple iterations refining the data, algorithms, and parameters before a definitive answer can be reached about whether an ML solution will work.

Last, ML solutions in production are costly to maintain. Their performance needs to be continuously monitored, because their performance can change over time as the characteristics of the data they’re analyzing changes. In the case of predicting the sentiment of movie reviews, just changes in writing style could drop the accuracy significantly. Processes and instrumentation are required to evaluate a statistically significant sample of the solution’s predictions, and take actions to improve performance whenever it drops such as creating a new program using newer data.

I hope this de-mystifies some of what data scientists do, and explains one of the important tools they use to extract value from large amounts of data.

Holiday season preparation

Preparing for the Holiday season is a year round task for all of us here at Bazaarvoice.  This year we saw many retailers extending their seasonal in-store specials to their websites as well. We also saw retailers going as far as closing physical stores on Thanksgiving (Nordstrom, Costco, Home Depot, etc.) and Black Friday (REI).  Regardless of which of the above strategies were taken,  the one common theme amongst retailers  was the increase in online sales.

This trend is not new. Online sales are catching up to in stores sales (http://www.usnews.com/news/business/articles/2015/11/28/black-friday-store-sales-fall-as-americans-buy-more-online) over the holiday season.  Along with the demand in online sales was the increase in demand on the Bazaarvoice network.

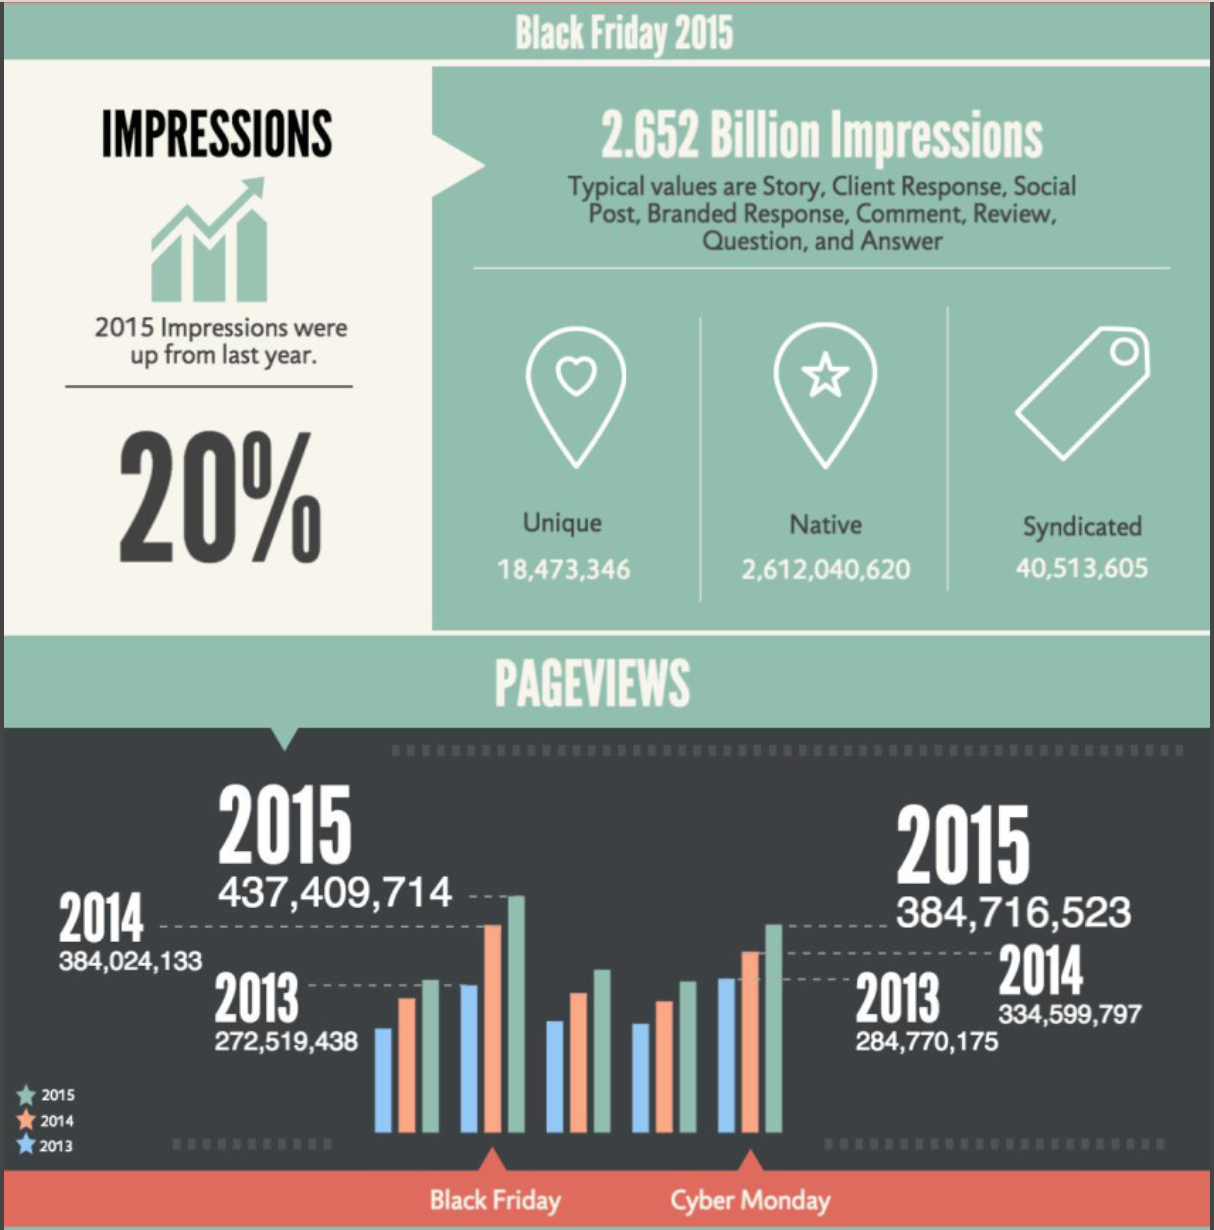
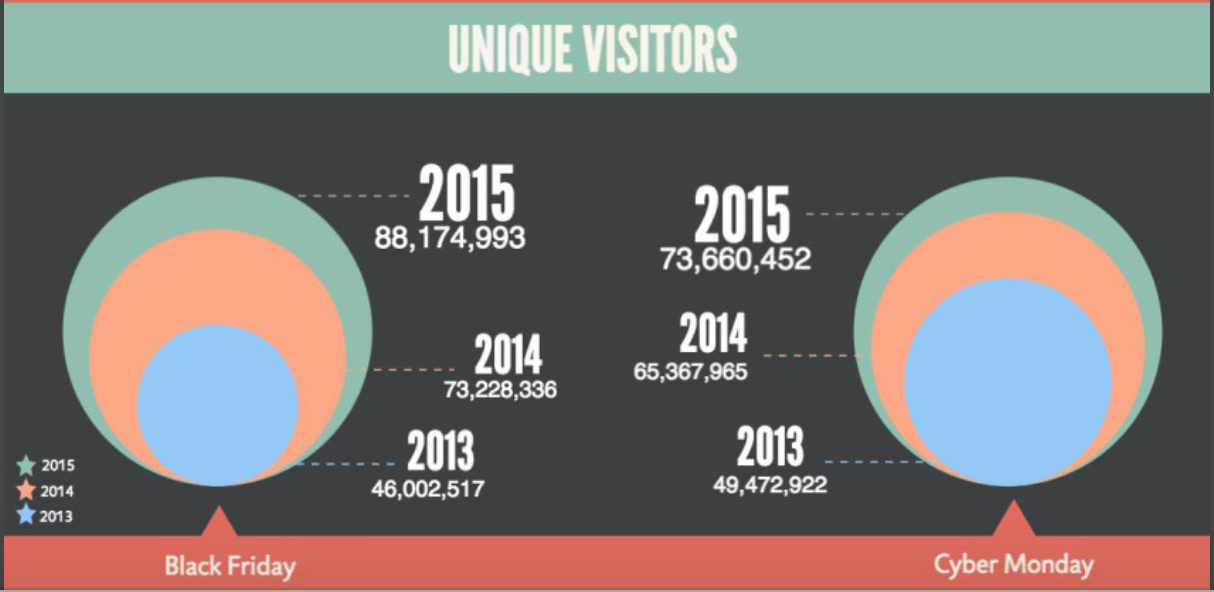
So here are just a few of the metrics that the Bazaarvoice network saw in the busiest week of online shopping:

blog_unique_visitors

Unique Visitors throughout 2013-2015

blog_impressions

Pageviews and Impressions 2013-2015

So how does the Bazzarvoice team prepare the Holiday Season?

As soon as the online traffic settles from the peak levels, the R&D team begins preparing for the next  year’s Holiday Season.  First by looking back at the numbers and how we did as a team through various retrospectives. Taking inventory of what went well and what we can improve upon for the next year. Before you know it the team gets together in June to being preparations for the next years efforts. I want to touch on just a few of the key areas the team focused on this past year to prepare for a successful Holiday Season:

  1. Client communication
  2. Disaster Recovery
  3. Load/Performance Testing
  4. Freeze Plan

Client Communication

One key improvement this year was client communication both between R&D and other internal teams as well as externally to clients. This was identified as an area we could improve from last year.  Internally a response communication plan was developed. This plan makes sure that key representatives in R&D and support teams were on call at all times and everyone understands escalation paths and procedures should an issue occur. It was then the responsibility of the  on call representative to communicate any needs with the different engineers and client support staff. The on call period lasted from November 24th to Tuesday December the 1st.

A small focused team was identified for creation and delivery of all client communication.  As early as August, “Holiday Preparedness” communications were delivered to clients informing them of our service level objectives. Monthly client communications followed containing load target calculations, freeze plans, disaster recover preparations, as well as instructions on how to contact Bazaarvoice in the event of an issue as well as how we would communicate current status of our network during this critical holiday season.

Internally there was also an increased emphasis on the creation and evaluation of runbooks. Runbooks are ‘play by play’ instructions which engineers should carry out for different scenarios. The collection of procedures and operations were vital in the teams disaster recovery planning.

Disaster Recovery

To improve our operational excellence, we needed to ensure our teams were conducting exploratory disaster scenario testing to know for certain how our apps/service behaved and improve our Dev Ops code, monitoring/alerting, runbooks, etc.  Documenting the procedures was completed in the late summer.  That quickly moved into evaluating our assumptions and correcting where necessary.

All teams were responsible for:

  • documentation the test plan
  • documentation of the results
  • capture the MTTR (mean time to recovery) when appropriate

Sign off was required for all test plans and results shared amongst the teams.  We also executed a full set of Disaster Recovery scenarios and performed additional Green Flag fire drills to ensure all systems and personnel were prepared for any contingencies during the holiday season.

Load/Performance Testing

For an added layer of insurance, we pre scaled our environment ahead of the anticipated holiday load profile.  Analysis of 3 years of previous holiday traffic showed a predictable increase of approximately 2.5x the highest load average over the past 10 months. For this holiday season we tested at 4x the highest load average over that time period to ensure we were covered. The load test allowed the team to test beyond expected target traffic profile to ensure all systems would execute above expected levels.

Load testing initially was isolated per each system.  Conducting tests in such environment helped quickly identify any failure points. As satisfactory results were obtain, complexities were introduced by running systems in tandem. This simulated a environments more representative of what would be encountered in the holiday season.

One benefit experienced through this testing was the identification and evaluation of other key metrics to ensure the systems are operating and performing successfully. Also, a predictive model was created to evaluate our expected results.  The accuracy of the daily model was within 5% of the expected daily results and overall, for the 2015 season, was within 3%. This new model will be a essential tool when preparing for the next holiday season.

Freeze Plan

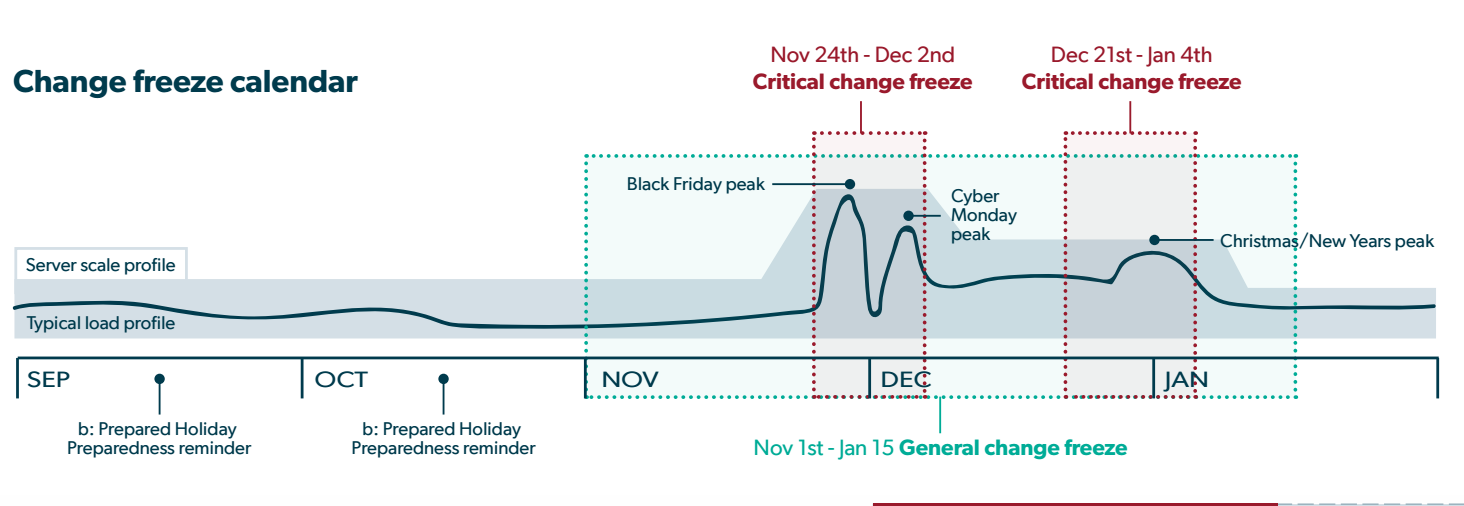
Once again, we locked down the code prior to the holiday season. Limiting the number of ‘moving parts’ and throughly testing the code in place increased our confidence that we would not experience any major issues.  As the image below demonstrates, two critical time periods were identified:

  • critical change freeze – code change to be introduced only if sites were down.
  • general change freeze – priority one bug fixes were accepted. Additional risk assessments performed on all changes.

As you can see the critical times coincide with the times we see increased online traffic.

blog_change_freeze

Summary

A substantial amount of the work was all completed in the months prior to Black Friday and Cyber Monday. The team’s coordinated efforts prior to the holiday season ensured that our client’s online operations ran smoothly.  Over half of the year was spent ensuring performance and scalability for these critical times in the holiday season.  Data, as far back as three years, was also used to predict web traffic forecasts and ensure we would scale appropriately. This metric perspective also provided new insightful models to be used in future year’s forecasts.

The preparation paid off, and Bazaarvoice was able to handle 8.398 Billion impressions over Black Friday thru Cyber Monday (11/27-11/30), a new record for the our network.

BVIO 2015 Summary and Presentations

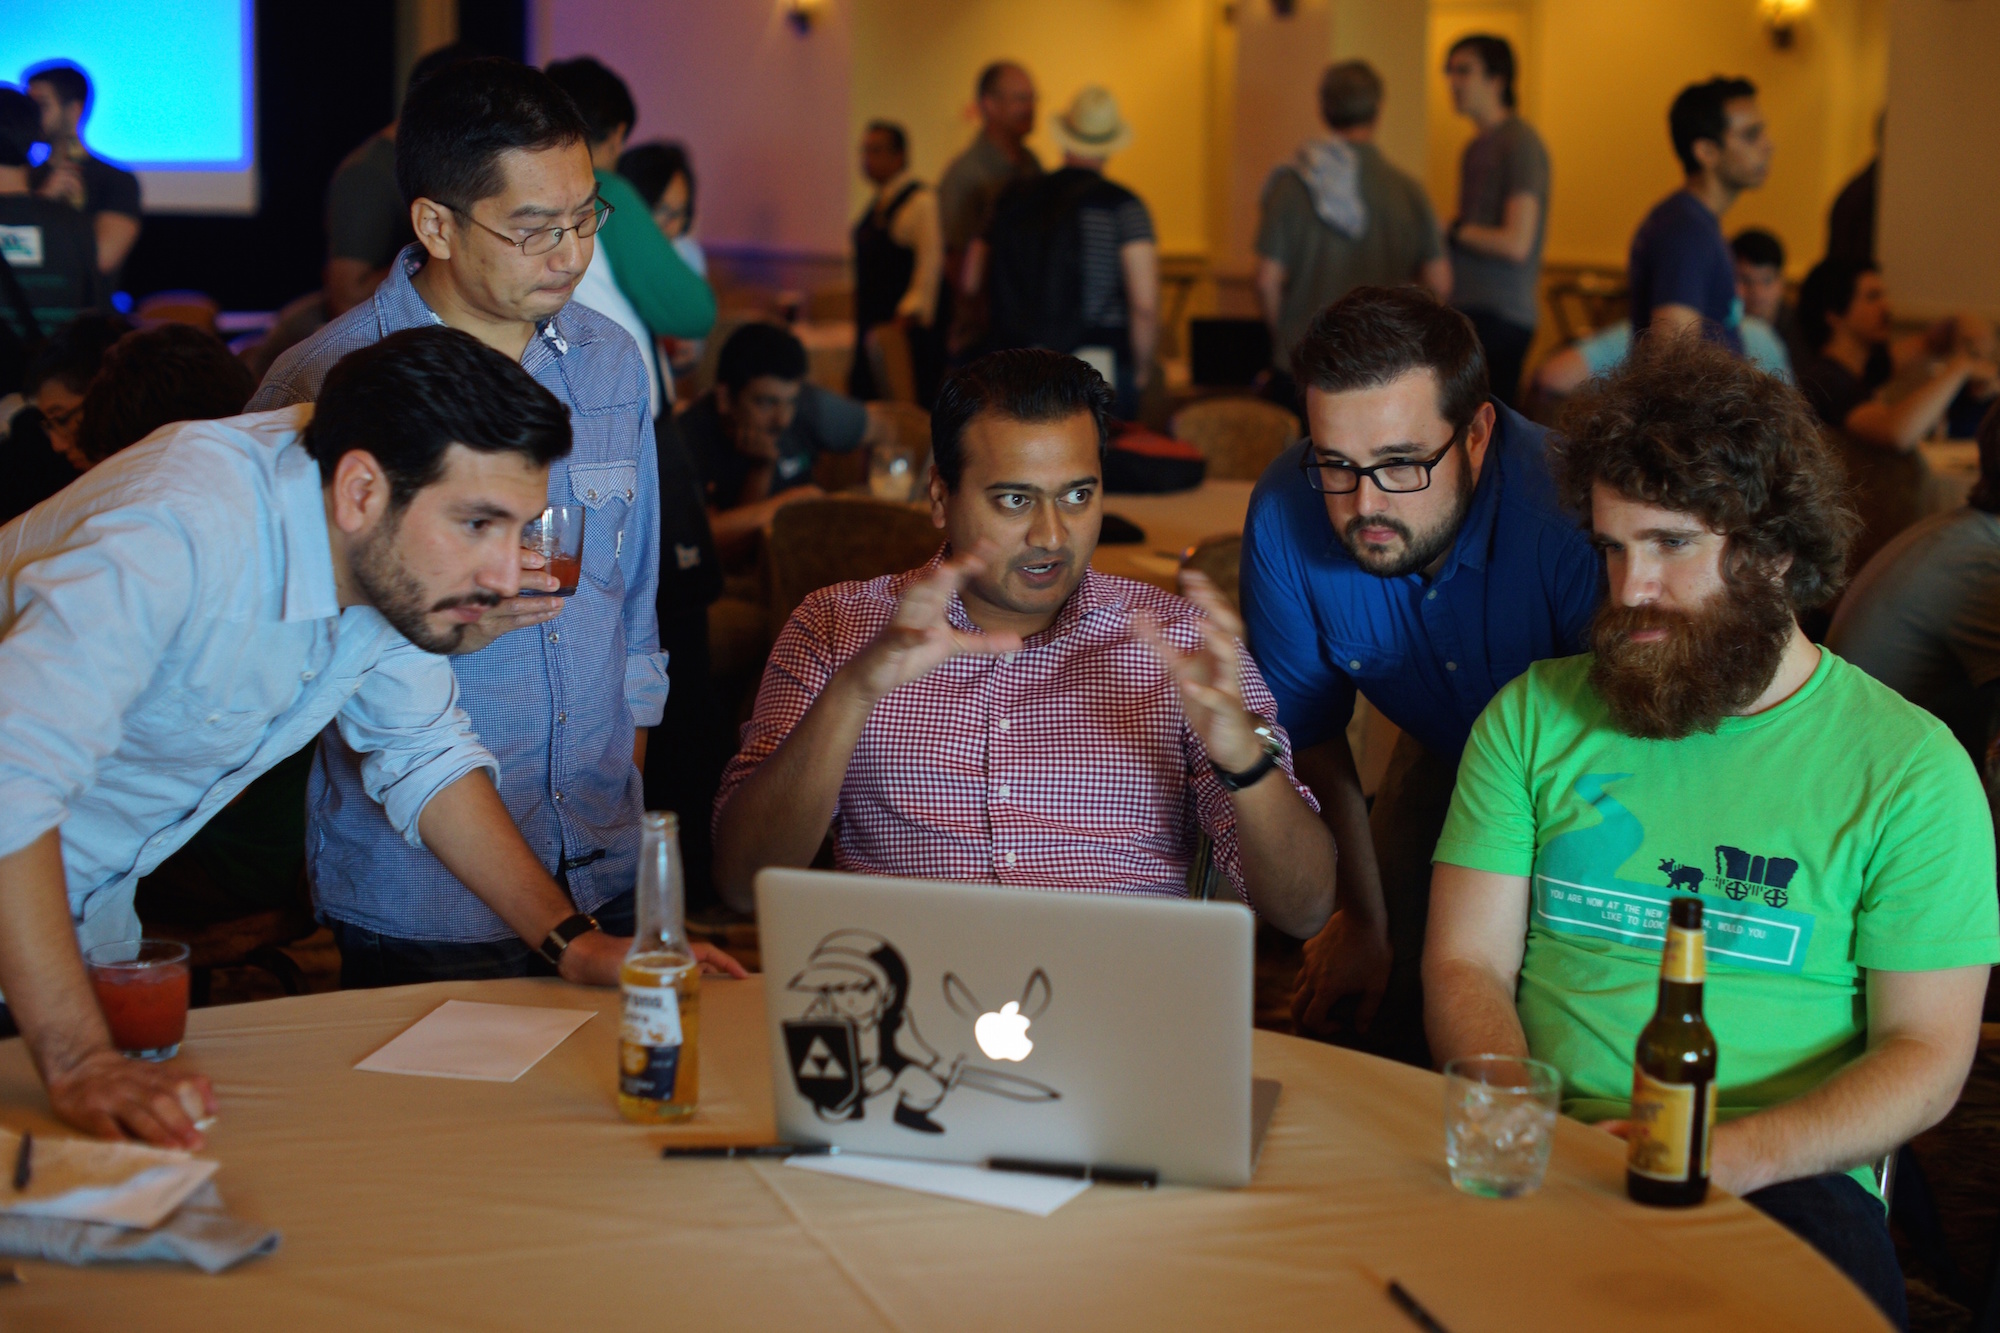
Every year Bazaarvoice R&D throws BVIO, an internal technical conference followed by a two-day hackathon. These conferences are an opportunity for us to focus on unlocking the power of our network, data, APIs, and platforms as well as have some fun in the process. We invite keynote speakers from within BV, from companies who use our data in inspiring ways, and from companies who are successfully using big data to solve cool problems. After a full day of learning we engage in an intense, two-day hackathon to create new applications, visualizations, and insights into our extensive our data.

Continue reading for pictures of the event and videos of the presentations.

bvio-logo

This year we held the conference at the palatial Omni Barton Creek Resort in one of their well-appointed ballrooms.

omni

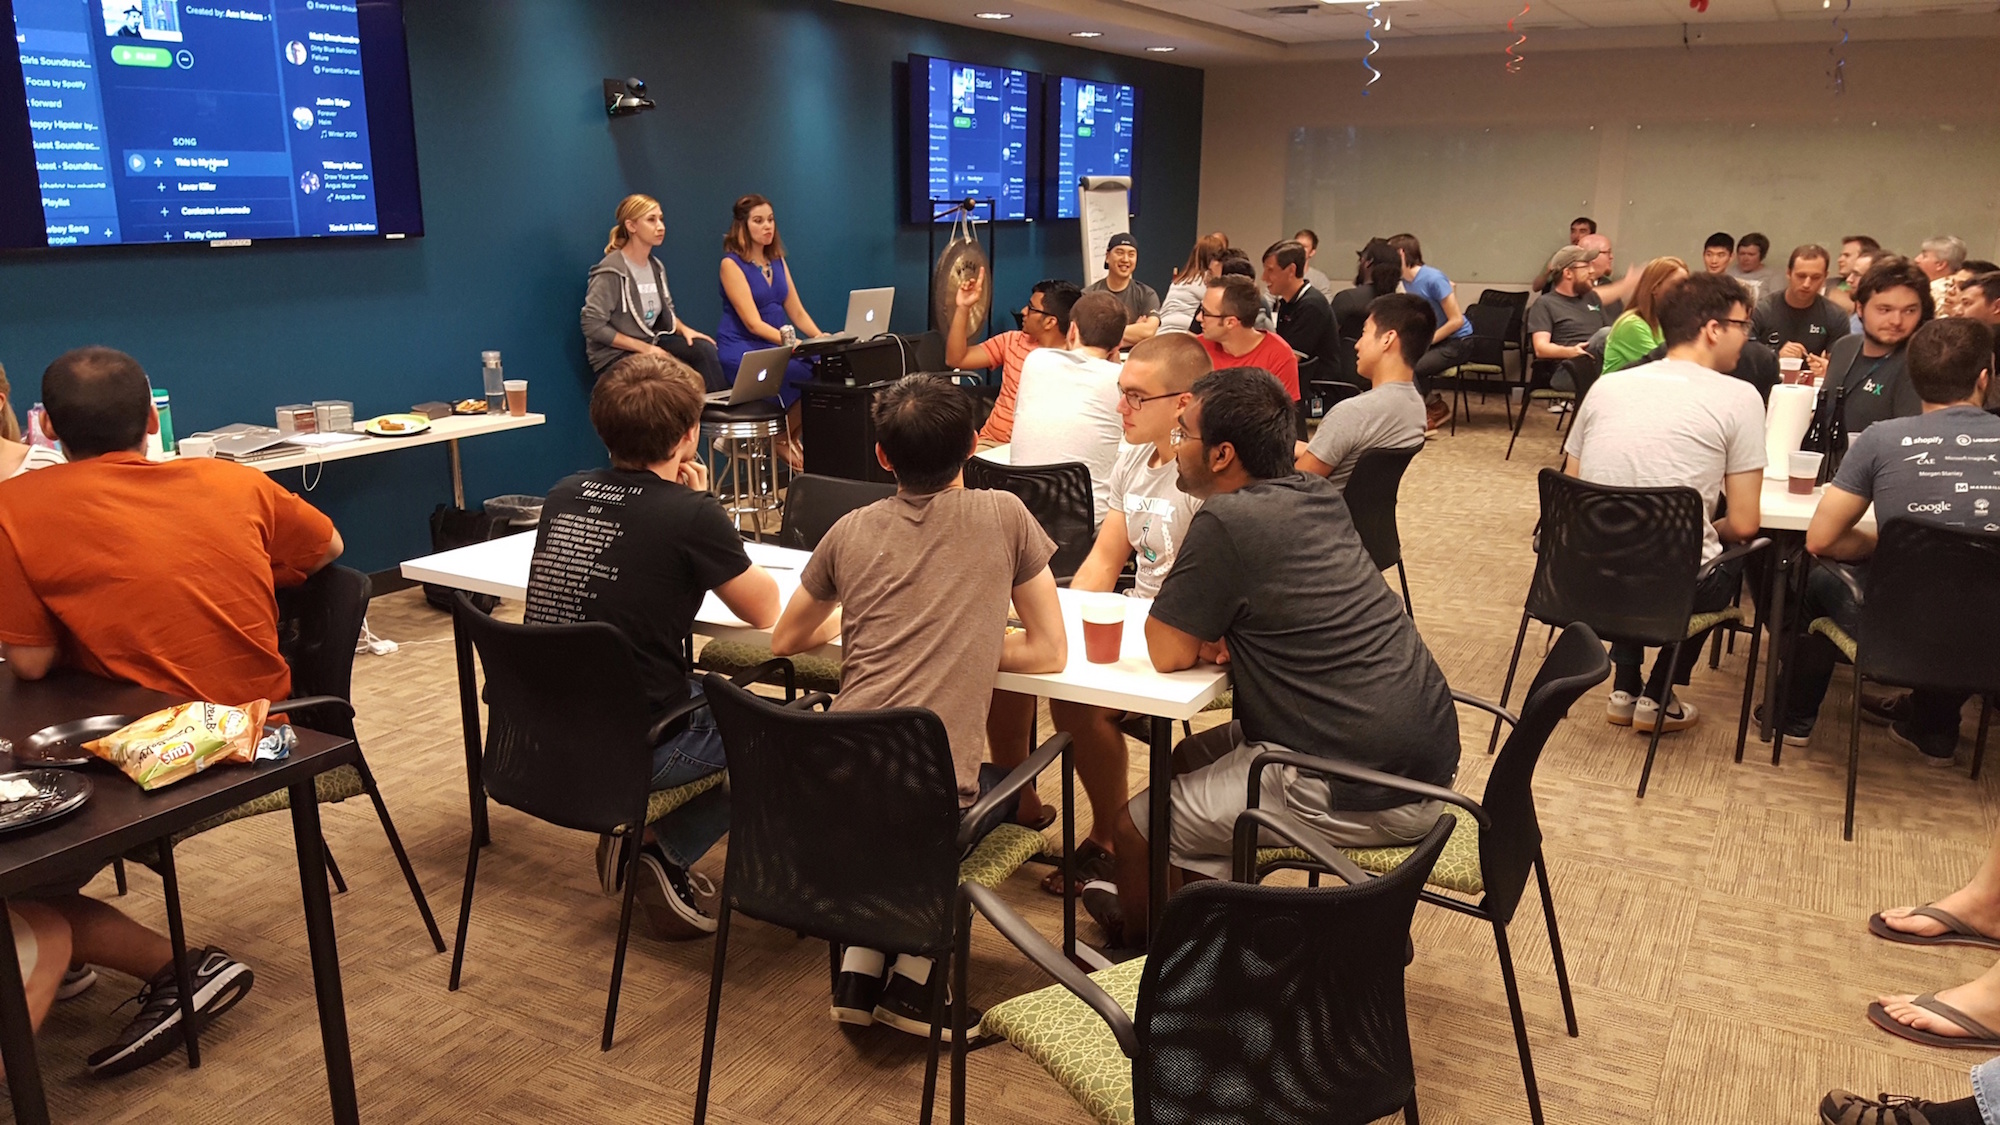
Participants arrived around 9am (some of us a little later). After breakfast, provided by Bazaarvoice, we got started with the speakers followed by lunch, also provided by Bazaarvoice, followed by more speakers.

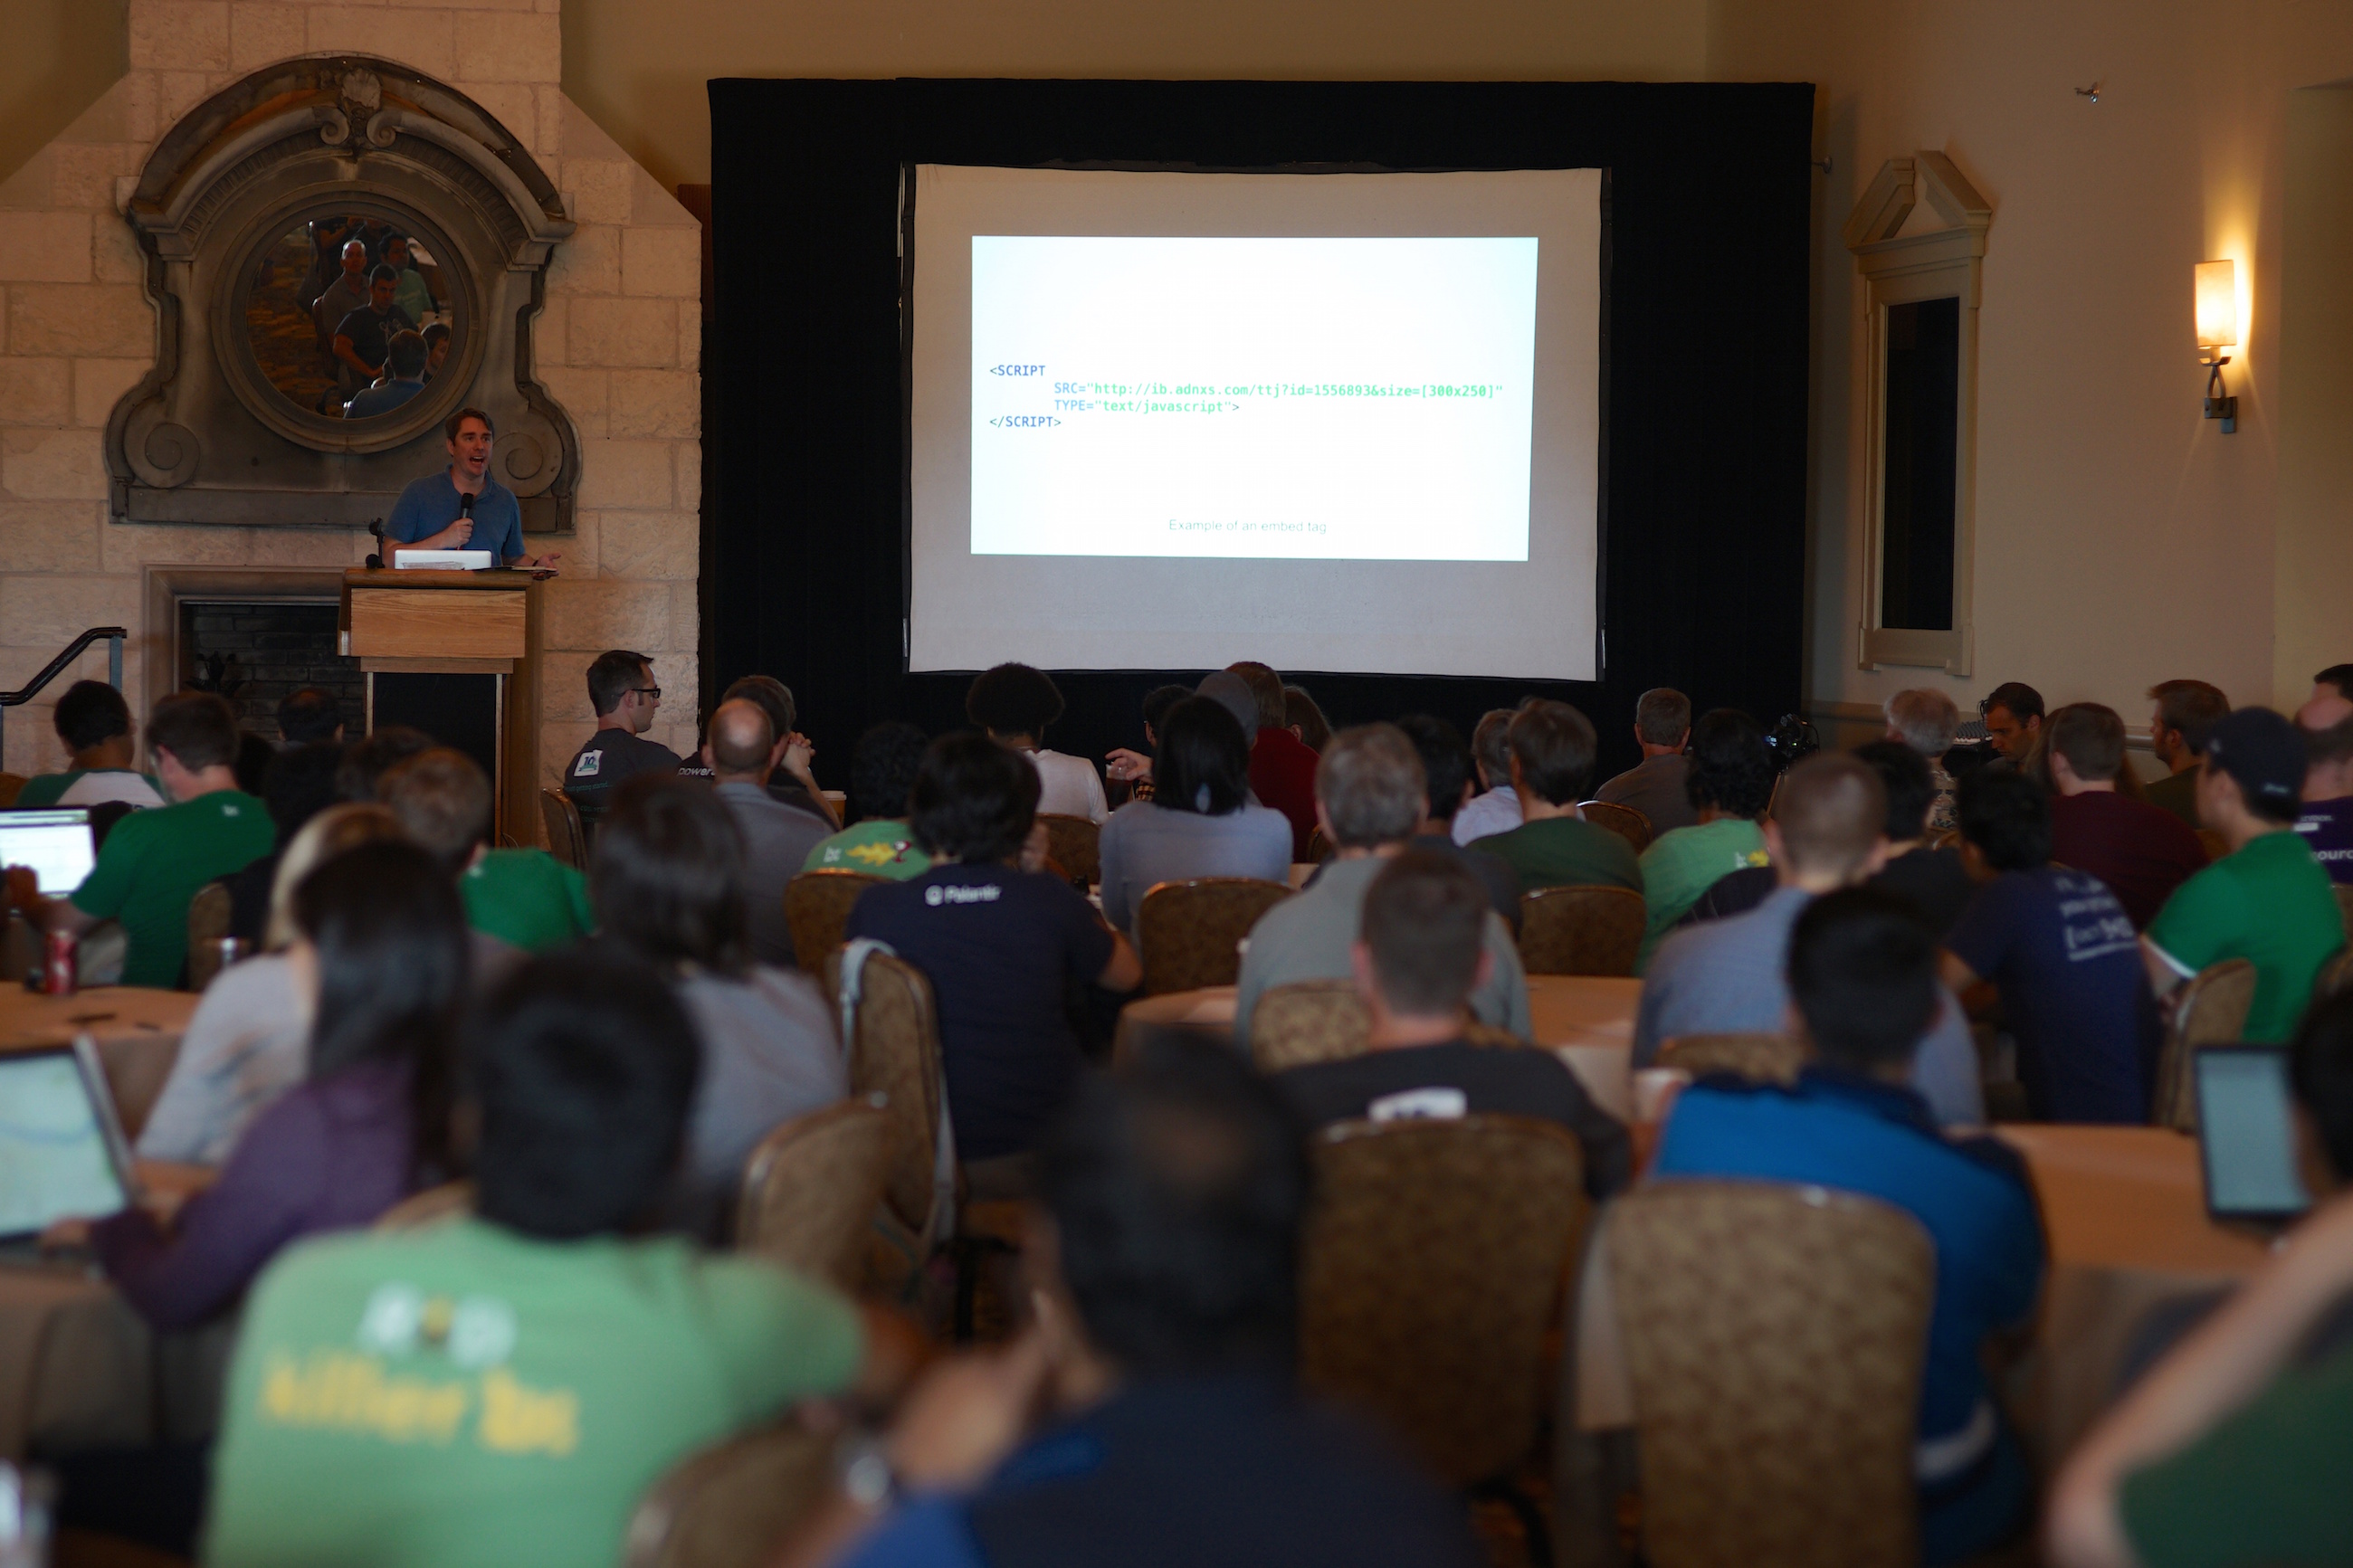
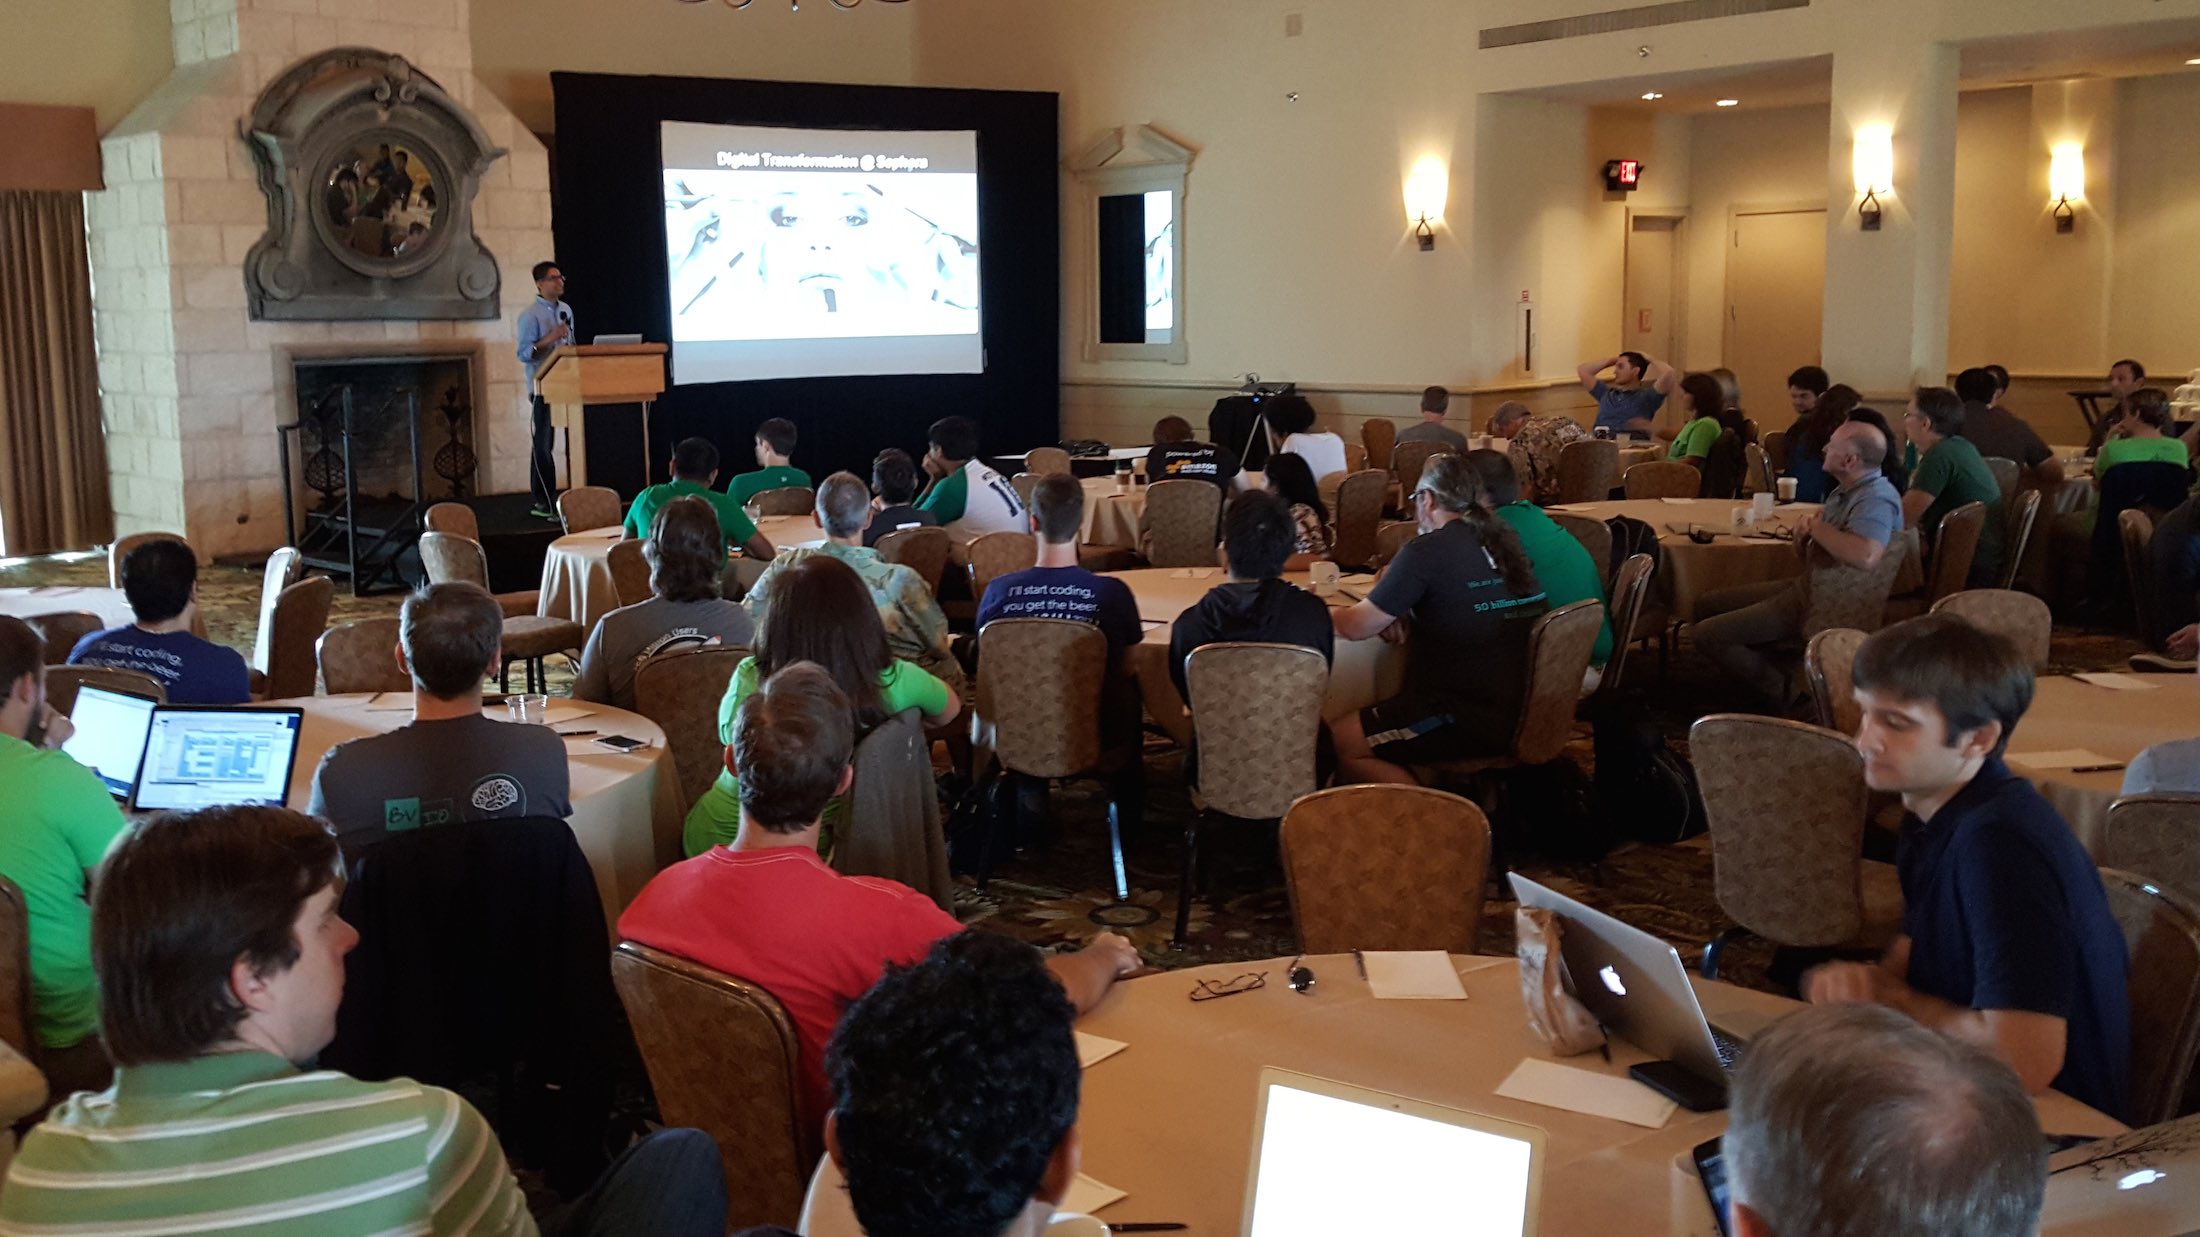
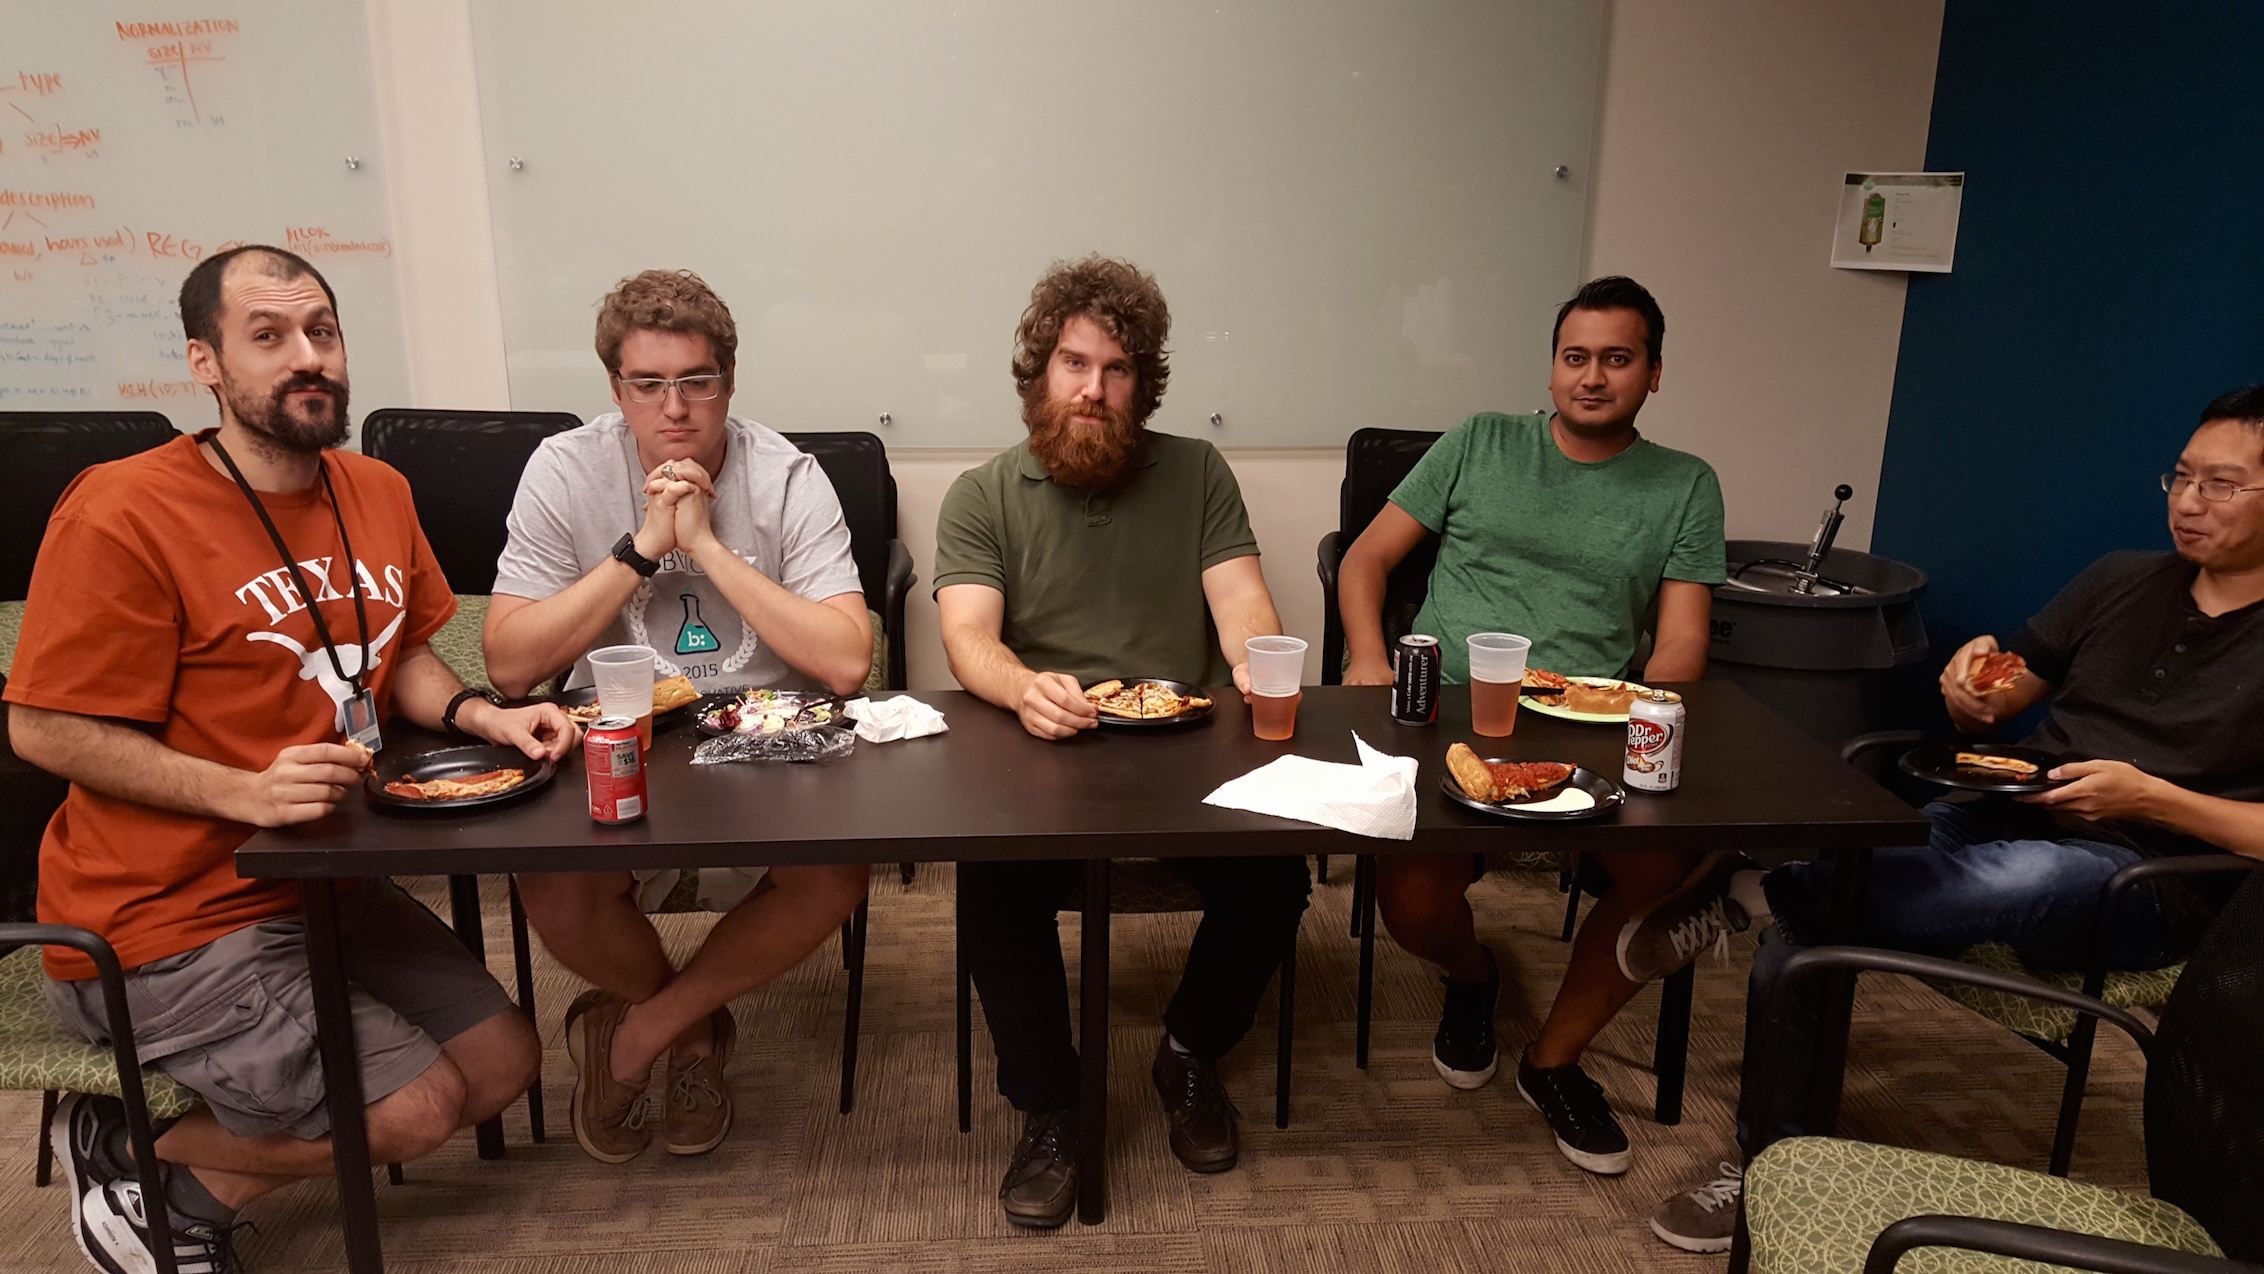
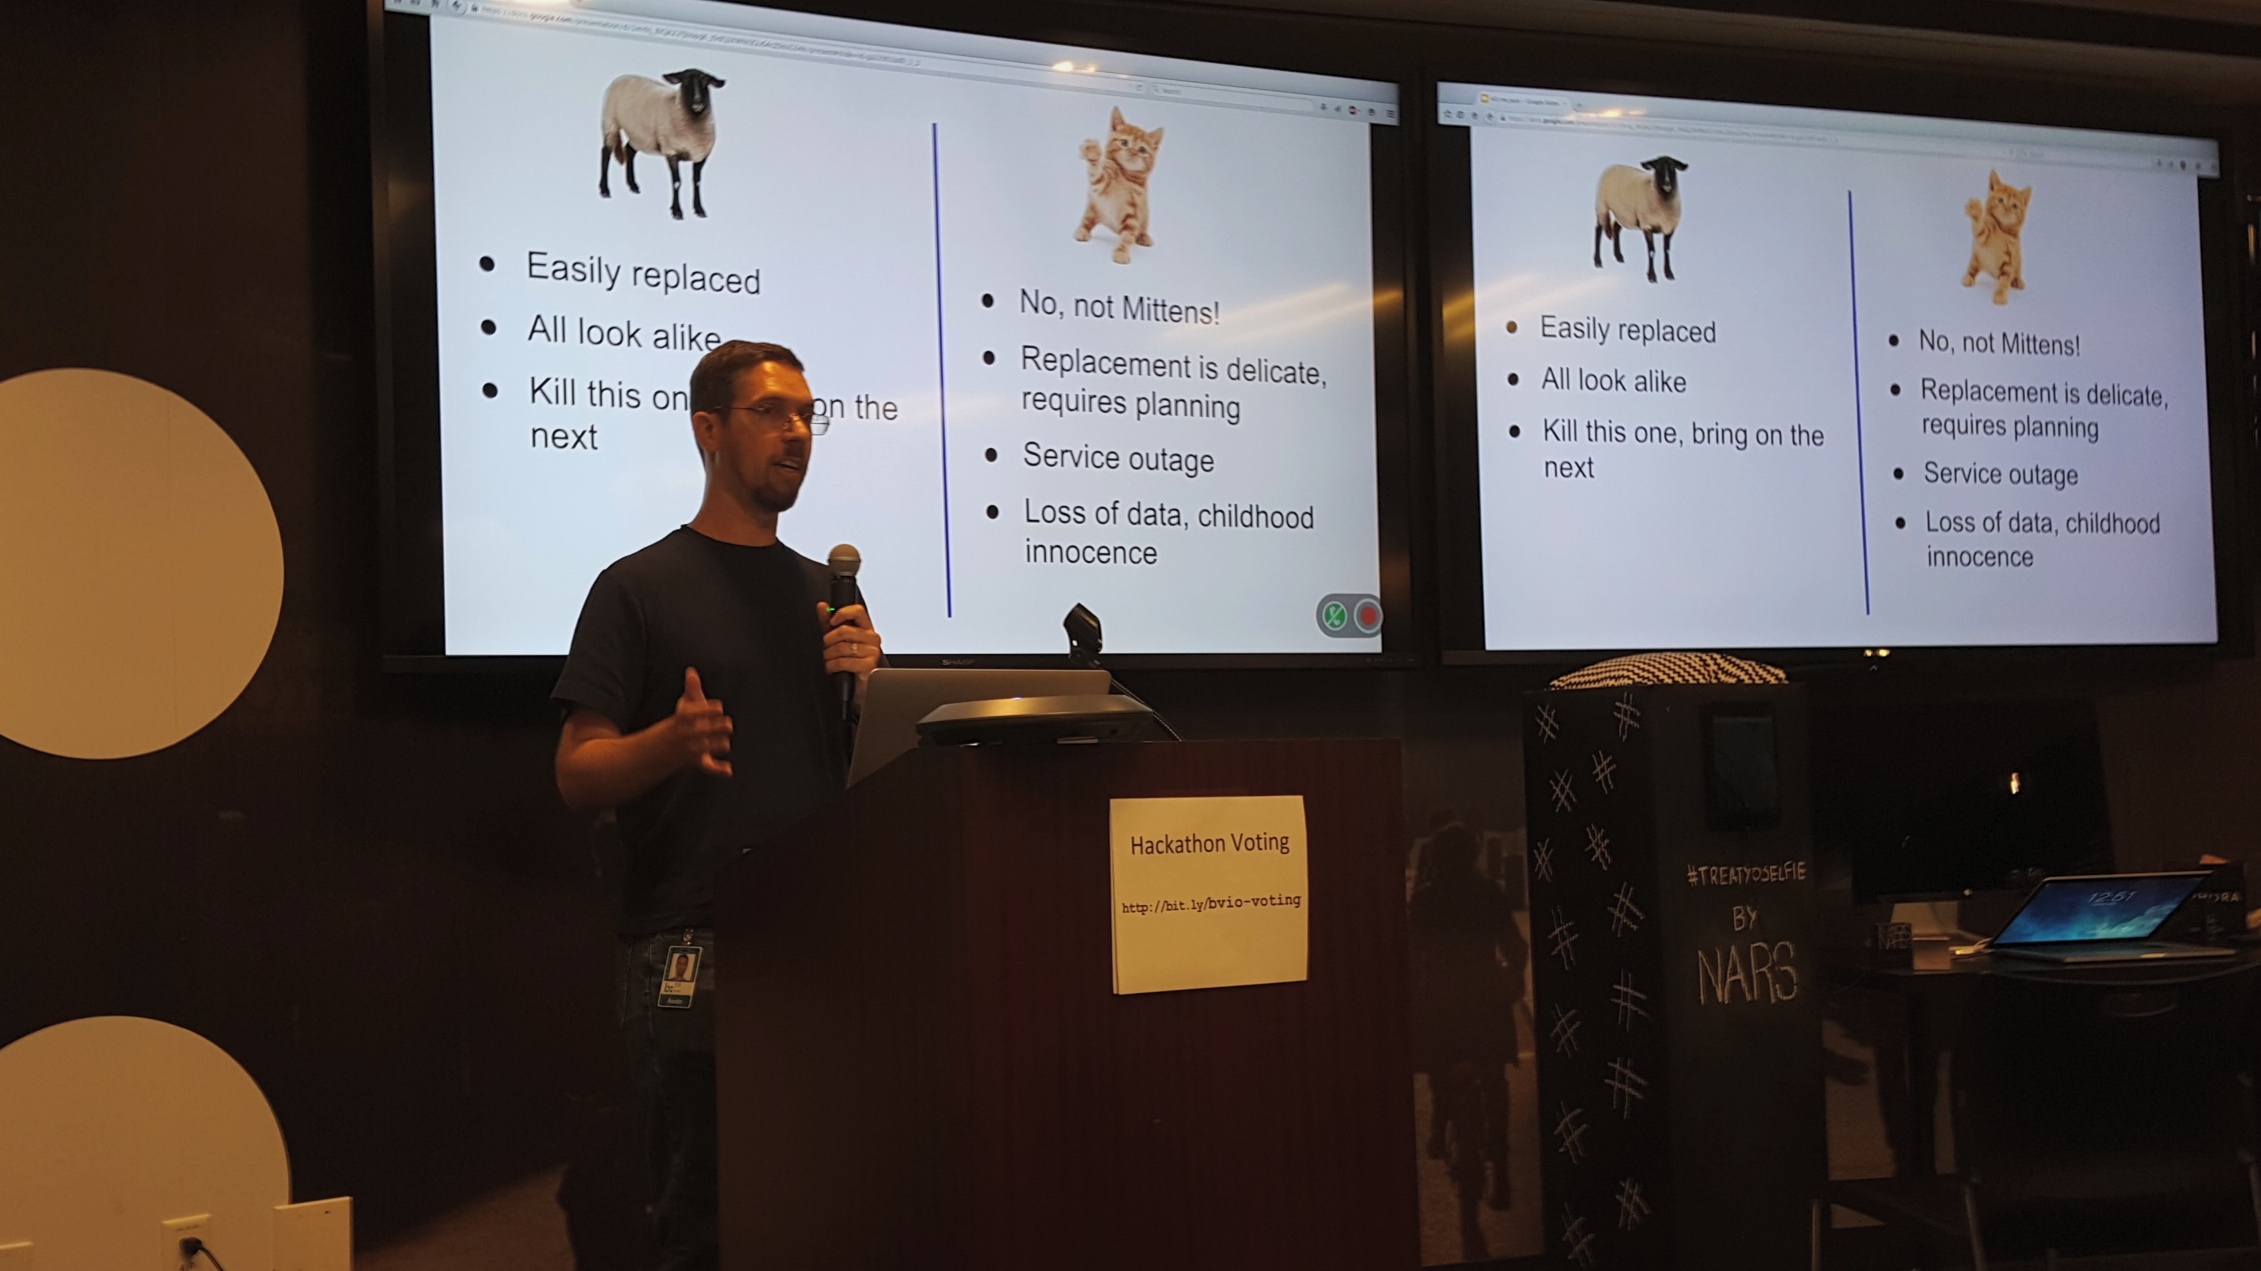
bvio2015_presentation2 bvio2015_presentation

After the speakers came a “pitchfest” during which our Product team presented hackathon ideas and participants started forming teams and brainstorming.

bvio2015_bigidea bvio2015_bigidea2

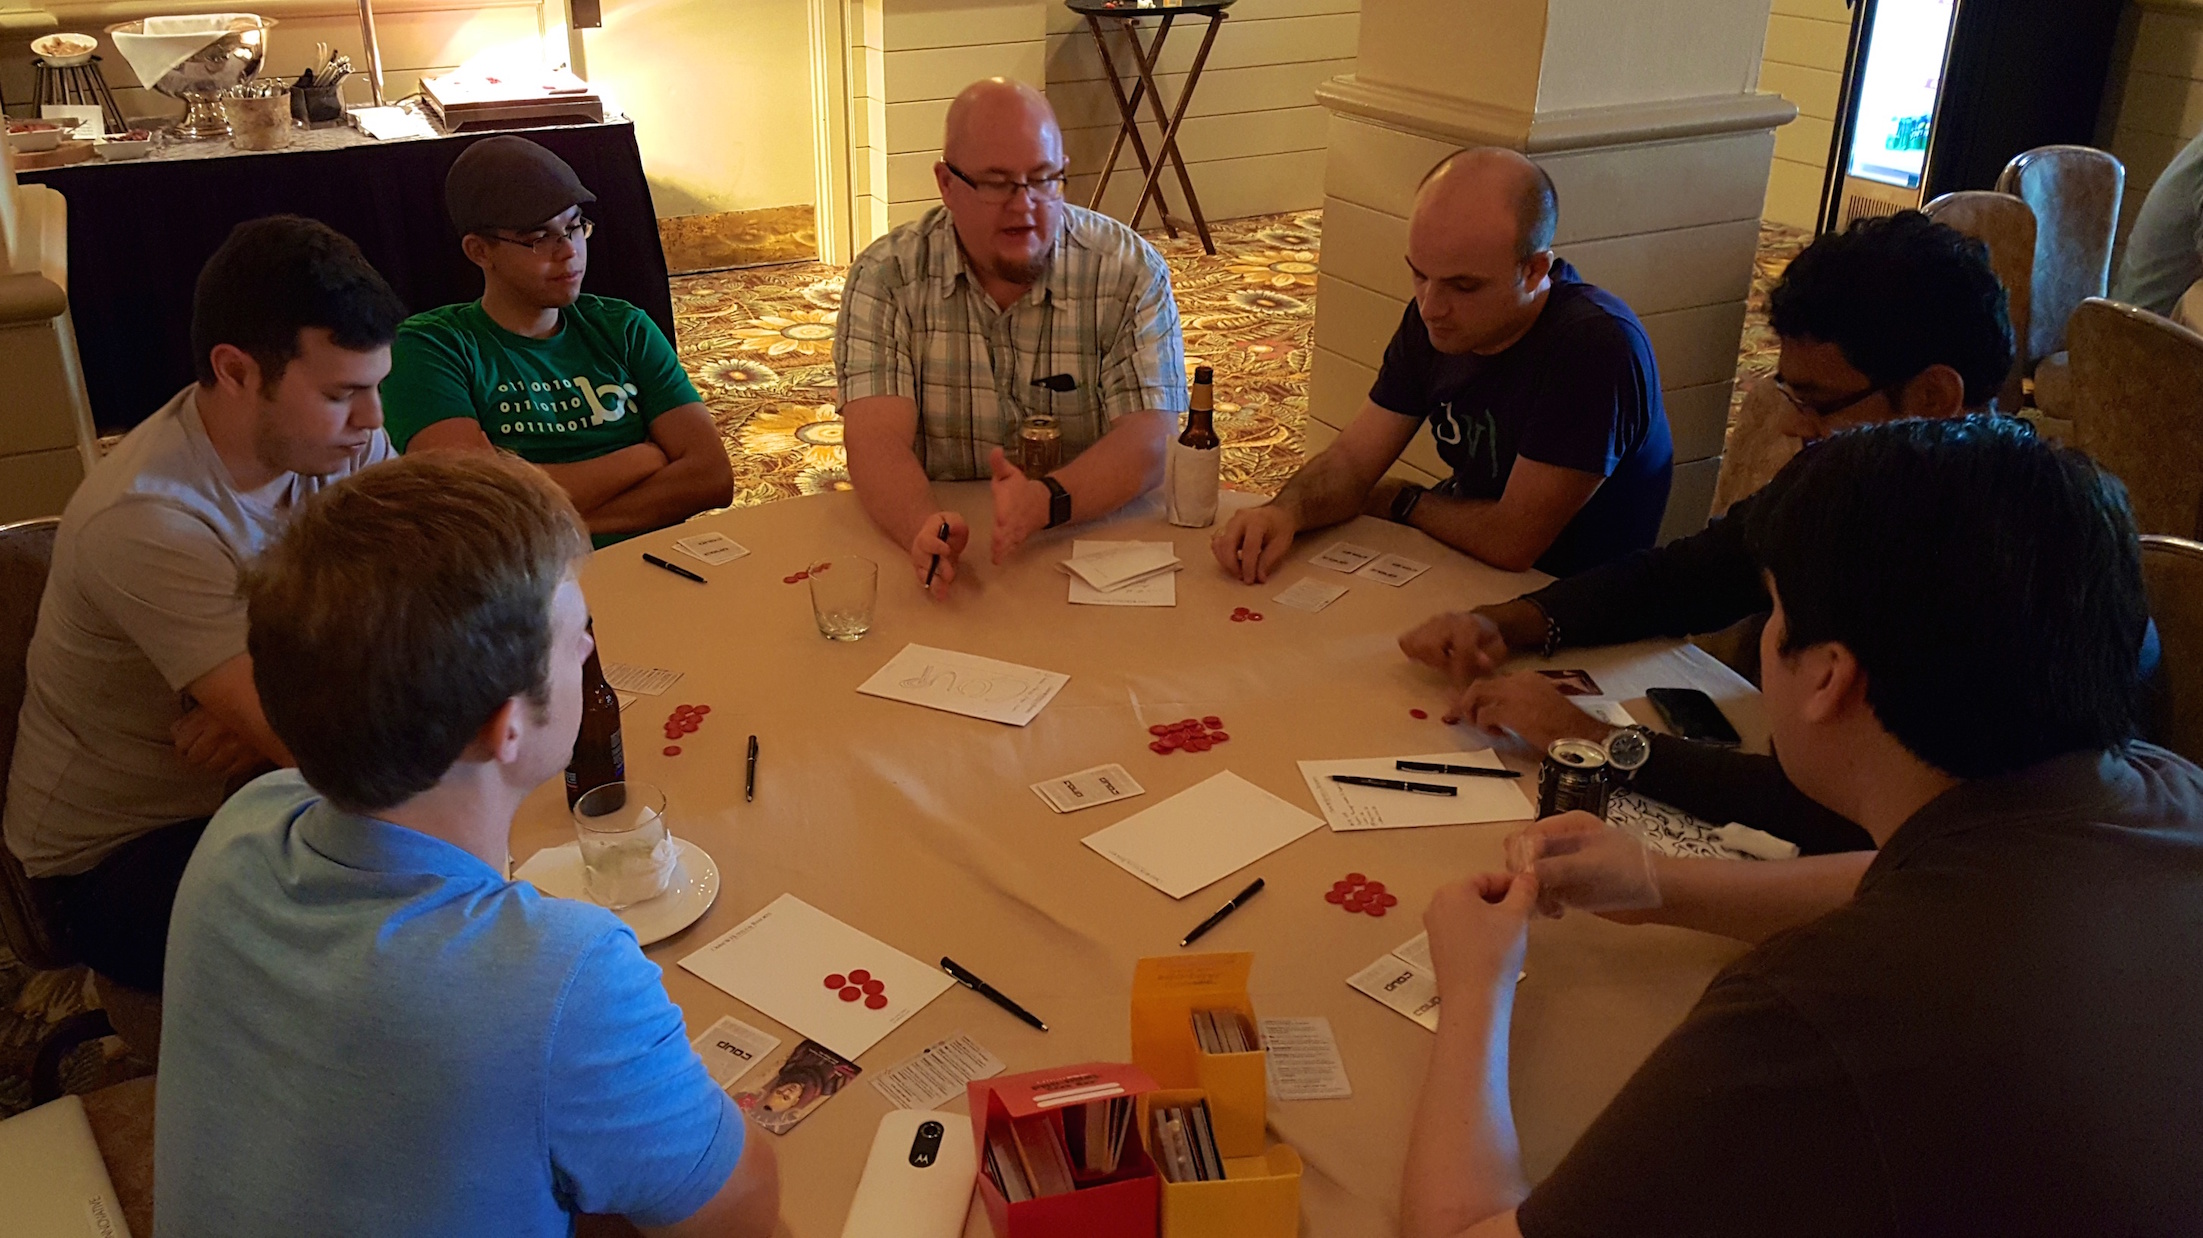
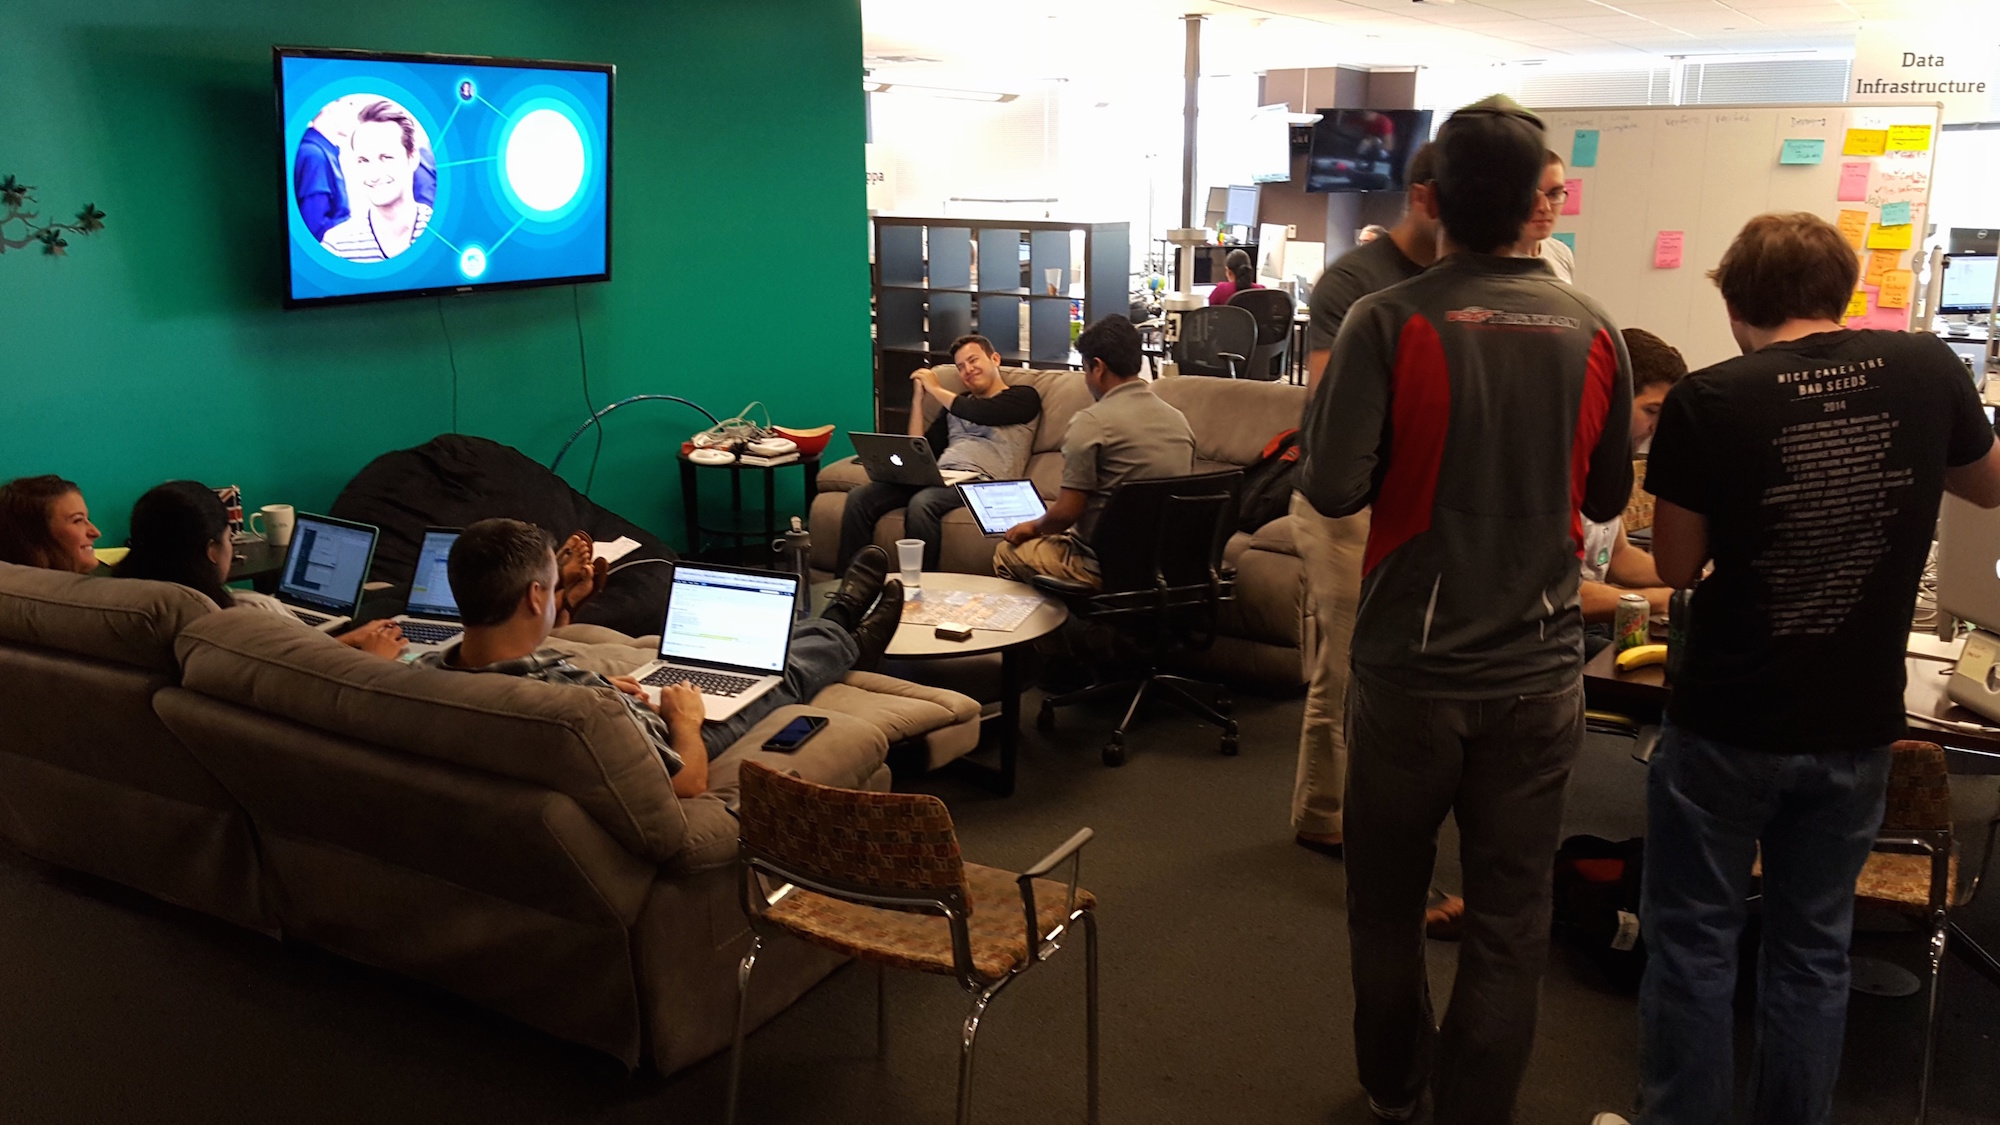
Finally it was time for 48 hours of hacking, eating, and gaming (not necessarily in that order) culminating in project presentations and prizes.

bvio2015_hacking bvio2015_hacking2 bvio2015_gaming bvio2015_eating bvio2015_demo bvio2015_demo2

Presentations

Sephora: Consumer Targeted Content

Venkat Gopalan
Director of Architecture & Devops @ Sephora.com

Venkat presented on the work Sephora is doing around serving relevant, targeted content to their consumers in both the mobile and in-store space. It was a fascinating speech and we love to see our how our clients are innovating with us. Unfortunately due to technical difficulties we don’t have a recording 🙁

Philosophy & Design of The BV System of Record

John Roesler & Fahd Siddiqui
Bazaarvoice Engineers

This talk was about the overarching design of Bazaarvoice’s innovative data architecture. According to them there are aspects to it that may seem unexpected at first glance (especially not coming from a big data background), but are actually surprisingly powerful. The first innovation is the separation of storage and query, and the second is choosing a knowledge-base-inspired data model. By making these two choices, we guarantee that our data infrastructure will be robust and durable.

Realtime Bidding: Predicting the future, 10,000 times per second

Ian Clarke
Co-Founder and CTO at OneSpot

Ian has built and manages a team of world-class software engineers as well as data scientists at OneSpot™s. In his presentation he discusses how he applied machine learning and game theory to architect a sophisticated realtime bidding engine for OneSpot™ capable of predicting the behavior of tens of thousands of people per second.

New Amazon Machine Learning and Lambda architectures

Jeff Nun
Amazon Solutions Architect

In his presentation Jeff discusses the history of Amazon Machine Learning and the Lambda architecture, how Amazon uses it and you can use it. This isn’t just a presentation; Ian walks us through the AWS UI for building and training a model.

Thanks to Sharon Hasting, Dan Heberden, and the presenters for contributing to this post.

Partner Integrations: Do’s and Don’ts

In this blog post , a Senior Product Manager on our Product team, discusses challenges to building and maintaining technical partnerships between organizations as well as provides advice on how to overcome those challenges.

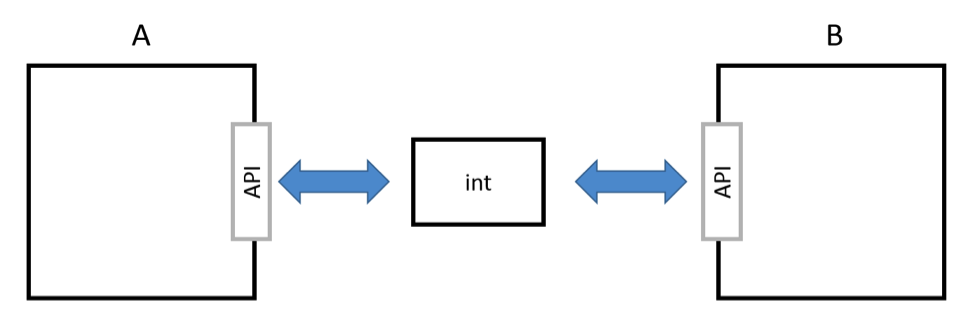
Every company comes to a point, early or late, where it realizes that it must partner with other companies to drive value in the market. Partnerships always start with conversations, handshakes, and NDAs. At some point, unlocking the value of partnership may hinge upon establishing a formal integration between the two companies. These integrations constitute a technical “bridge” between companies. They can unlock otherwise inaccessible value, allow for one company to OEM the other, and/or can accelerate work that otherwise is “re-invented” each time the companies engage each other.

Integrations can be amazing vehicles to create value that only comes from combining capabilities from separate entities, while simultaneously allowing each entity to focus on what each one does best. They can be the perfect manifestation of the all too often promised “complimentary” value. Integrations can offer consistency, repeatability, and reduced friction in the activities involved in unlocking that value.

Unfortunately, integrations are often approached in manner in which all parties involved are not setup for success. Why?

Integrations aren’t just some “code.” They are product. They require an organized effort to build, including technical staff and non-technical staff to build (engineers, architects, project manager, product manager, partnership manager). They require support, assigned owners, subject matter experts, marketing, documentation, and proper roadmap vision. Integrations demand the same attention and focus that any first class “product” requires.

Integrations require both more and different types of communication. Because the value of the integration is typically not front-and-center to the core value of each org, there must be additional effort to communicate the existence of the integration and the value it brings within each org. Sales, onboarding support, post-live support organizations all need ways to communicate with the other integrated party (who calls who when something stops working?). The two product organizations must communicate ahead of any changes to dependent technologies such as APIs. A classic communication gap happens when one entity changes their APIs and doesn’t let the other party know soon enough or not at all. Problems are only discovered when something breaks.

Integrations are usually birthed by the wrong part of the org. The challenge with integrations is that the impetus to create them usually originates from one or both of the company’s business development/partnerships team – a group that typically has little appreciation for the discipline of product management. Their priority is on “relationships” that historically focus on non-technical efforts. Additionally, the ADD-like attention span of most partnerships teams results in a great desire to create an “integration” with a partner for marketing and sales-driven reasons, but very little attention, effort, and commitment to the long-term requirements of a properly supported product. It is quite easy to just stop communicating with a partner who is no longer deemed valuable, but such an about-face cannot be made when an integration is in place with paying customers. Most often, partnerships orgs do not have technical resources within their structure, but rather rely on borrowing technical resources from wherever they can be found (“Hey, I have a partner company who just trying to do this thing, and they have a quick technical question…”). This is a great approach for proof-of-concept initiatives, but certainly not for something that companies/customers must trust to deliver value. The product organizations at each company must be responsible for bringing an integration to life. Regardless of whether the product org has enough resources to service an integration like a first-class product citizen, at least the owner will have an understanding of what is and isn’t getting handled properly and can mitigate the potentially negative outcomes that arise from under-served products.

Correctly structured incentives are crucial to the short and long-term success of integrations. There must be something in it for all concerned parties. Direct compensation and rev share are two good options. You should be cautious of such benefits as “stickiness” (as in, the assumption that giving an integration free-of-charge to an existing customer makes that customer less likely to debook your core service) or the halo effect associated with integrating with a company (i.e. “Do you know we’re integrated with Facebook?”). Many integrations have been built on the promise of return. Once that promise begins to fade (from any one or more of the parties), so does the motivation of the affected party to keep up their end of the technical bargain. The technology world’s version of “he’s just not that into you (anymore).” Once an integration is no longer properly attended to from one party, the integration becomes a liability. It’s not enough for the bridge to be secured to just one side of the river.

People love to build stuff. But, they hate to support it. There must be something in it for the platform to properly prioritize integration maintenance efforts. Be wary of agreements that lack commitments, SLAs, etc. (often termed that they will do any needed work within the bounds of “best efforts”) as these agreements allow the company responsible for the integration (“code”) to elect to not invest in the support and roadmap development, should their interest wane. If the agreement lacks commitments, then the partnership will likely as well. They will acknowledge the maintenance effort, but it will always get pushed to the next dev cycle. Which leads us to…

The Challenge of Opportunity Cost

The assumption here is that these companies contemplating an integration are predominantly product organizations. Their company mandate is to bring products to market at scale. This is dramatically different than a service organization who essentially trades dollars for hours.
This means that the cost of the technical/engineering effort at a product organization is different than that of a service organization. Not in that engineers get paid more at product organizations, but rather the additional opportunity cost of engineering effort at a product organization often introduces an impossibly high hurdle rate for putting those engineers on non-core “integration work.” Even just the existence of opportunity cost, albeit uncalculated, is all that a dissenting product or engineering leader needs to de-prioritize seemingly less important “integration work” that doesn’t deliver core value.

One innovative approach to solve this dilemma is to use outsourced engineering resources from a service organization to avoid the challenges that comes with opportunity cost. It makes good business sense: let your in-house engineering staff concentrate on doing things that drive core value at scale. The downside of this approach is that there is a very clear and visible cost (hrs * hourly rate) that is attached to all effort associated with the integration. A similar cost analysis is rarely thought about when utilizing internal resources, so the integration product manager should be prepared. Getting things done is always more expensive than you thought.

Of course, another solution is to simply make integration work of the same perceived class of value as that of the core product org’s core solution. However, as we describe above, this can be a big challenge.

The technical approach must be at the convergence of correctly structured incentives and technical viability. How open or closed a platform is can dictate how an integration can be executed. The associated partnership incentive structure can dictate how an integration should be executed. The resulting integration will result from the intersection of these two perspectives.

Closed platforms force the work on that platform. Open platforms allow for more options – either or both entities, possibly even a third-party, can contribute to the integration development.

Let’s look at a few scenarios.

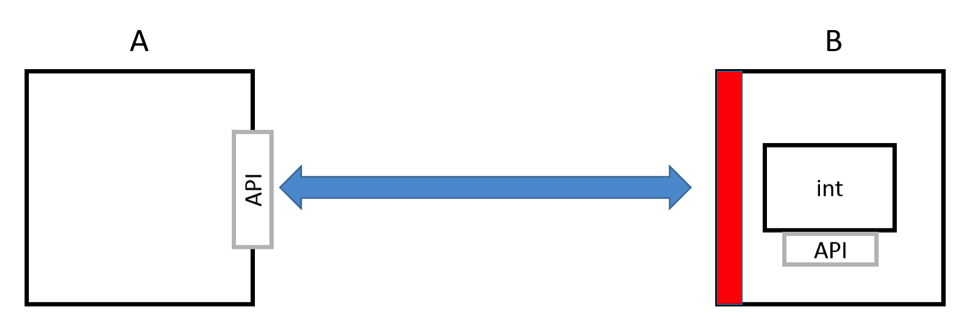
Scenario 1: B is a “closed” platform

b_is_closed_platform

“Closed” here means that the platform does not allow for integration (read: code) to be hosted by that platform and that the platform does not have externally accessible APIs to utilize from outside the platform. The closed platform may have internally accessible APIs, but those do an external party little good.

Closed platforms force that platform to do the integration work. Thus, there must be incentives for the closed platform to both build and support the integration long-term. The effort to build the integration is often simply the result of the opportunistic convergence of both parties being sold on (at least) the promise of value and some available engineering capacity within the close platform. Without the proper incentives for platform B, this becomes a classic example of the issue of the Challenge of Opportunity Cost, discussed above. The engineer who had some free time to build the integration is suddenly no longer available to fix a bug or build a new feature. There must be motivation in some form to continue to maintain the integrity of the integration.

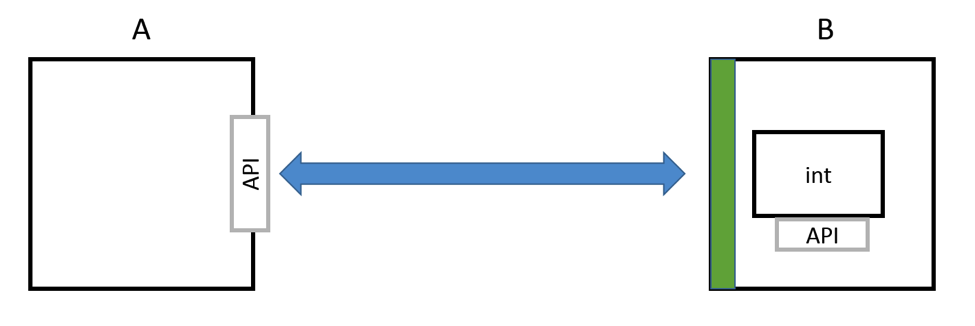
Scenario 2: B is open

b_is_open_platform

Open platforms present more options. In scenario 2, B is no longer the only entity who can develop the integration. A, B, or a third-party org can build the integration. There are more alternative incentive structures as well. Since the engineering effort can be executed by a non-B entity, there doesn’t need to be much in it for B (there can be, but it is not near the necessity). There will certainly need to be knowledge of the B platform (documentation, sandboxes, API keys, deployment directions, etc.) on the part of the developing entity, but this effort on the part of B has a much lower hurdle rate than that which is required to get something into B’s engineering roadmap. Typically, B will have some form of partner “program” by where such assets and knowledge are available for a predetermined fee. Even in absence of such a program, the needs are significantly less than if the development effort required engineers from platform B to do the build work.

Scenario 3: Middle-ware Solution

middleware_solution

Scenario 3 is just a derivative of Scenario 2. Options are abundant. A, B, or a third-party can build the integration. In most cases, any of those entities can bring the integration to market. A major decision will be how and where to host the middle-ware solution and how to provide production-ready support, specifically beyond the initial build phase (which can just leverage cloud hosting services like Amazon, etc. to quickly get up and running). The trade-off is that such a middle-man solution removes any challenges that come with the need to host the integration within the B platform, which can range from simple plug-n-play effort to per-instance customizations required for each integration incarnation.

Incentive options are very similar to Scenario 2. One exception is that there is a clear opportunity for a third-party to bring the integration to market with an associated price tag.

Summary

Integrations are powerful and often hugely valuable, but their success is directly tied the ability to structure them for the long-term. Integrations are a special kind of “product” requiring different types of communication and can benefit from the use of outsourced resources to execute and maintain.

A successful integration is the result of a technical and non-technical relationship that is structured in a way that provides benefit to both parties that can adequately compensate for the often underestimated level of involvement required across both organizations.

Automating a Git Rebase Workflow

When I started on the Firebird team at Bazaarvoice, I was happy to learn that they host their code on GitHub and review and land changes via pull requests. I was less happy to learn that they merged pull requests with the big green button. I was able to convince the team to try out a new, rebase-oriented, workflow that keeps the mainline branch linear and clean. While the new workflow was a hit with the team, it was much more complicated than just clicking a button, so I automated the workflow with a simple git extension, git land, which we have released as an open source tool.

What’s Wrong With the Big Green Button?

The big green button is the “Merge pull request” button that GitHub provides to merge pull requests. Clicking it prompts the user to enter a commit message (or accept a default provided by GitHub) and then confirm the merge. When the user confirms the merge, the pull request branch is merged using the –no-ff option, which always creates a merge commit. Finally, GitHub closes the pull request.

For example, given a master branch like this:

git log of an example master branch with three commits

An example master branch


…and a feature branch that diverges from the second commit:

An example feature branch started from the second commit

A feature branch started from the second commit


…this is the result of doing a –no-ff merge:

The result of merging the examples with the --no-ff option

The result of merging the examples with the –no-ff option. Note that the third commit on master is interleaved with the merge commit and the feature branch commits.


Merging with the big green button is frowned upon by many; for detailed discussions of why this is, see Isaac Z. Schlueter and Benjamin Sandofsky. In addition to the problems with merge commits that Isaac and Benjamin point out, the big green button has another downside: it merges the pull request without an opportunity to squash commits or otherwise clean up the branch.

This causes a couple of problems. First, because only the pull request author can clean up the PR branch, merging often became a tedious and drawn out process as reviewers cajoled the author to update their branch to a state that would keep `master`’s history relatively clean. Worse, sometimes messy pull requests were hastily or mistakenly merged.

As a result, the team was encouraged to keep their pull requests squashed into one or two clean commits at all times. This solved one problem, but introduced another: when an author responds to comments by pushing up a new version of the pull request, the latest changes are squashed together into one or two commits. As a result, reviewers had to hunt through the entire diff to ensure that their comments were fully addressed.

An Alternate Workflow

After some lively discussion, the team adopted a new workflow centered on fast-forward merging squashed and rebased pull request branches. Developers create topic branches and pull requests as before, but when updating their pull request, they never squash commits. This preserves detailed history of the changes the author makes in response to review feedback.

When the PR is ready to be merged, the merger interactively rebases it on the latest master, squashes it down to one or two commits, and does a fast-forward merge. The result is a clean, linear, and atomic history for `master`.

The result of merging the example feature branch into master by rebasing and doing a --ff-only merge

The result of merging the example feature branch into master using the described workflow.

One hiccup is that GitHub can’t easily tell that the rebased and squashed commit contains the changes in the pull request, so it doesn’t close the PR automatically. Fortunately, GitHub will close pull requests that contain special keywords. So, the merger has a final task: adding “[closes #<PR number>]” to one of the squashed commit’s message.

git-land

The biggest downside to the new workflow is that it transformed merging a PR from a simple operation (pushing a button) to a somewhat tricky multi-step process:

  • update local master to latest from upstream
  • check out pull request branch
  • do an interactive rebase on top of master, squashing down to one or two commits
  • add “[closes #<PR number>]” to the last commit message for the most recent squashed commit
  • do a fast-forward merge of the pull request branch into master
  • push local master to upstream

This process was too lengthy and error-prone to be reliable unless automated. To address this problem, I created a simple git extension: git-land. The Firebird team has been using this tool for a little over a year with very few problems. In fact, it has spread to other teams at Bazaarvoice. We are excited to release it as an open source tool for the public to use.

Front End Application Testing with Image Recognition

One of the many challenges of software testing has always been cross-browser testing. Despite the web’s overall move to more standards compliant browser platforms, we still struggle with the fact that sometimes certain CSS values or certain JavaScript operations don’t translate well in some browsers (cough, cough IE 8).

In this post, I’m going to show how the Curations team has upgraded their existing automation tools to allow for us to automate spot checking the visual display of the Curations front end across multiple browsers in order to save us time while helping to build a better product for our clients.

The Problem: How to save time and test all the things

The Curations front end is a highly configurable product that allows our clients to implement the display of moderated UGC made available through the API from a Curations instance.

This flexibility combined with BV’s browser support guidelines means there are a very large number ways Curations content can be rendered on the web.

Initially, rather than attempt to test ‘all the things’, we’ve codified a set of possible configurations that represent general usage patterns of how Curations is implemented. Functionally, we can test that content can be retrieved and displayed however, when it comes whether that the end result has the right look-n-feel in Chrome, Firefox and other browsers, our testing of this is largely manual (and time consuming).

How can we better automate this process without sacrificing consistency or stability in testing?

Our solution: Sikuli API

Sikuli is an open-source Java-based application and API that allows users to automate web, mobile and OS applications across multiple platforms using image recognition. It’s platform based and not browser specific, so it enables us to circumvent limitations with screen capture and compare features in other automation tools like Webdriver.

Imagine writing a test script that starts with clicking the home button within an iOS simulator, simply by providing the script a .png of the home button itself. That’s what Sikuli can do.

You can read more about Sikuli here. You can check out their project here on github.

Installation:

Sikuli provides two different products for your automation needs – their stand-alone scripting engine and their API. For our purposes, we’re interested in the Sikuli API with the goal to implement it within our existing Saladhands test framework, which uses both Webdriver and Cucumber.

Assuming you have Java 1.6 or greater installed on your workstation, from Sikuli.org’s download page, follow the link to their standalone setup JAR

http://www.sikuli.org/download.html

Download the JAR file and place it in your local workstation’s home directory, then open it.

Here, you’ll be prompted by the installer to select an installation type. Select option 3 if wish to use Sikuli in your Java or Jython project as well as have access to its command line options. Select option 4 if you only plan on using Sikuli within the scope of your Java or Jython project.

Once the installation is complete, you should have a sikuli.jar file in your working directory. You will want to add this to your collection of external JARs for your installed JRE.

For example, if you’re using Eclipse, go to Preferences > Java > Installed JREs, select your JRE version, click Edit and add Sikuli.jar to the collection.

Alternately, if you are using Maven to build your project, you can add Sikuli’s API to your project by adding the following to your POM.XML file:

<dependency>
    <groupId>org.sikuli</groupId>
    <artifactId>sikuli-api</artifactId>
    <version>1.2.0</version>
</dependency>

Clean then build your project and now you’re ready to roll.

Implementation:

Ultimately, we wanted a method we could control using Cucumber that allows us to articulate a web application using Webdriver that could take a screen shot of a web application (in this case, an instance of Curations) and compare it to a static screen shot of specific web elements (e.g. Ratings and Review stars within the Curations display).

This test method would then make an assumption that either we could find a match to the static screen element within the live web application or have TestNG throw an exception (test failure) if no match could be found.

First, now that we have the ability to use Sikuli, we created a new helper class that instantiates an object from their API so we can compare screen output.

import org.sikuli.api.*;
import java.io.IOException;
import java.io.File;
/**
* Created by gary.spillman on 4/9/15.
*/
public class SikuliHelper {

public boolean screenMatch(String targetPath) {
new ImageTarget(new File(targetPath));

Once we import the Sikuli API, we create a simple class with a single class method. In this case, screenMatch is going to accept a path within the Java project relative to a static image we are going to compare against the live browser window. True or false will be returned depending on if we have a match or not.

//Sets the screen region Sikuli will try to match to full screen
ScreenRegion fullScreen = new DesktopScreenRegion();

//Set your taret to compare from
Target target = new ImageTarget(new File(targetPath));

The main object type Sikuli wants to handle everything with is ScreenRegion. In this case, we are instantiating a new screen region relative to the entire desktop screen area of whatever OS our project will run on. Without passing any arguments to DesktopScreenRegion(), we will be defining the region’s dimension as the entire viewable area of our screen.

double fuzzPercent = .9;

try {
    fuzzPercent = Double.parseDouble(PropertyLoader.loadProperty(&quot;fuzz.factor&quot;));
}
catch (IOException e) {
    e.printStackTrace();
}
new ImageTarget(new File(targetPath));

Sikuli allows you to define a fuzzing factor (if you’ve ever used ImageMagick, this should be a familiar concept). Essentially, rather than defining a 1:1 exact match, you can define a minimal acceptable percentage you wish your screen comparison to match. For Sikuli, you can define this within a range from 0.1 to 1 (ie 10% match up to 100% match).

Here we are defining a default minimum match (or fuzz factor) of 90%. Additionally, we load in from a set of properties in Saladhand’s test.properties file a value which, if present can override the default 90% match – should we wish to increase or decrease the severity of test criteria.

target.setMinScore(fuzzPercent);
new ImageTarget(new File(targetPath));

Now that we know what fuzzing percentage we want to test with, we use target’s setMinScore method to set that property.

ScreenRegion found = fullScreen.find(target);

//According to code examples, if the image isn't found, the screen region is undefined
//So... if it remains null at this point, we're assuming there's no match.

if(found == null) {
    return false;
}
else {
    return true;
}
new ImageTarget(new File(targetPath));

This is where the magic happens. We create a new screen region called found. We then define that using fullScreen’s find method, providing the path to the image file we will use as comparison (target).

What happens here is that Sikuli will take the provided image (target) and attempt to locate any instance within the current visible screen that matches target, within the lower bound of the fuzzing percentage we set and up to a full, 100% match.

The find method either returns a new screen region object, or returns nothing. Thus, if we are unable to find a match to the file relative to target, found will remain undefined (null). So in this case, we simply return false if found is null (no match) or true of found is assigned a new screen region (we had a match).

Putting it all together:

To completely incorporate this behavior into our test framework, we write a simple cucumber step definition that allows us to call our Sikuli helper method, and provide a local image file as an argument for which to compare it against the current, active screen.

Here’s what the cucumber step looks like:

public class ScreenShotSteps {

    SikuliHelper sk = new SikuliHelper();

    //Given the image &quot;X&quot; can be found on the screen
    @Given(&quot;^the image \&quot;([^\&quot;]*)\&quot; can be found on the screen$&quot;)
    public void the_image_can_be_found_on_the_screen(String arg1) {

        String screenShotDir=null;

        try {
            screenShotDir = PropertyLoader.loadProperty(&quot;screenshot.path&quot;).toString();
        }
        catch (IOException e) {
            e.printStackTrace();
        }

        Assert.assertTrue(sk.screenMatch(screenShotDir + arg1));
    }
    new ImageTarget(new File(targetPath));
}

We’re referring to the image file via regex. The step definition makes an assertion using TestNG that the value returned from our instance of SikuliHelper’s screen match method is true (Success!!!). If not, TestNG throws an exception and our test will be marked as having failed.

Finally, since we already have cucumber steps that let us invoke and direct Webdriver to a live site, we can write a test that looks like the following:

Feature: Screen Shot Test
As a QA tester
I want to do screen compares
So I can be a boss ass QA tester

Scenario: Find the nav element on BV's home page
Given I visit &quot;http://www.bazaarvoice.com&quot;
Then the image &quot;screentest1.png&quot; can be found on the screen
new ImageTarget(new File(targetPath));

In this case, the image we are attempting to find is a portion of the nav element on BV’s home page:

screentest1

Considerations:

This is not a full-stop solution to cross browser UI testing. Instead, we want to use Sikuli and tools like it to reduce overall manual testing as much as possible (as reasonably as possible) by giving the option to pre-warn product development teams of UI discrepancies. This can help us make better decisions on how to organize and allocate testing resources – manual and otherwise.

There are caveats to using Sikuli. The most explicit caveat is that tests designed with it cannot run heedlessly – the test tool requires a real, actual screen to capture and manipulate.

Obviously, the other possible drawback is the required maintenance of local image files you will need to check into your automation project as test artifacts. How deep you will be able to go with this type of testing may be tempered by how large of a file collection you will be able to reasonably maintain or deploy.

Despite that, Sikuli seems to have a large number of powerful features, not limited to being able to provide some level of mobile device testing. Check out the project repository and documentation to see how you might be able to incorporate similar automation code into your project today.

Predictively Scaling EC2 Instances with Custom CloudWatch Metrics

One of the chief promises of the cloud is fast scalability, but what good is snappy scalability without load prediction to match? How many teams out there are still manually switching group sizes when load spikes? If you would like to make your Amazon EC2 scaling more predictive, less reactive and hopefully less expensive it is my intention to help you with this article.

Problem 1: AWS EC2 Autoscaling Groups can only scale in response to metrics in CloudWatch and most of the default metrics are not sufficient for predictive scaling.

For instance, by looking at the CloudWatch Namespaces reference page we can see that Amazon SQS queues, EC2 Instances and many other Amazon services post metrics to CloudWatch by default.

From SQS you get things like NumberOfMessagesSent and SentMessageSize. EC2 Instances post metrics like CPUUtilization and DiskReadOps. These metrics are helpful for monitoring. You could also use them to reactively scale your service.

The downside is that by the time you notice that you are using too much CPU or sending too few messages, you’re often too late. EC2 instances take time to start up and instances are billed by the hour, so you’re either starting to get a backlog of work while starting up or you might shut down too late to take advantage of an approaching hour boundary and get charged for a mostly unused instance hour.

More predictive scaling would start up the instances before the load became business critical or it would shut down instances when it becomes clear they are not going to be needed instead of when their workload drops to zero.

Problem 2: AWS CloudWatch default metrics are only published every 5 minutes.

In five minutes a lot can happen, with more granular metrics you could learn about your scaling needs quite a bit faster. Our team has instances that take about 10 minutes to come online, so 5 minutes can make a lot of difference to our responsiveness to changing load.

Solution 1 & 2: Publish your own CloudWatch metrics

Custom metrics can overcome both of these limitations, you can publish metrics related to your service’s needs and you can publish them much more often.

For example, one of our services runs on EC2 instances and processes messages off an SQS queue. The load profile can vary over time; some messages can be handled very quickly and some take significantly more time. It’s not sufficient to simply look at the number of messages in the queue as the average processing speed can vary between 2 and 60 messages per second depending on the data.

We prefer that all our messages be handled within 2 hours of being received. With this in mind I’ll describe the metric we publish to easily scale our EC2 instances.

ApproximateSecondsToCompleteQueue = MessagesInQueue / AverageMessageProcessRate

The metric we publish is called ApproximateSecondsToCompleteQueue. A scheduled executor on our primary instance runs every 15 seconds to calculate and publish it.

private AmazonCloudWatchClient _cloudWatchClient = new AmazonCloudWatchClient();
_cloudWatchClient.setRegion(RegionUtils.getRegion("us-east-1"));

...

PutMetricDataRequest request = new PutMetricDataRequest()
  .withNamespace(CUSTOM_SQS_NAMESPACE)
  .withMetricData(new MetricDatum()
  .withMetricName("ApproximateSecondsToCompleteQueue")
  .withDimensions(new Dimension()
                    .withName(DIMENSION_NAME)
                    .withValue(_queueName))
  .withUnit(StandardUnit.Seconds)
  .withValue(approximateSecondsToCompleteQueue));

_cloudWatchClient.putMetricData(request);

In our CloudFormation template we have a parameter calledDesiredSecondsToCompleteQueue and by default we have it set to 2 hours (7200 seconds). In the Auto Scaling Group we have a scale up action triggered by an Alarm that checks whether DesiredSecondsToCompleteQueue is less than ApproximateSecondsToCompleteQueue.

"EstimatedQueueCompleteTime" : {
  "Type": "AWS::CloudWatch::Alarm",
  "Condition": "HasScaleUp",
  "Properties": {
    "Namespace": "Custom/Namespace",
    "Dimensions": [{
      "Name": "QueueName",
      "Value": { "Fn::Join" : [ "", [ {"Ref": "Universe"}, "-event-queue" ] ] }
    }],
    "MetricName": "ApproximateSecondsToCompleteQueue",
    "Statistic": "Average",
    "ComparisonOperator": "GreaterThanThreshold",
    "Threshold": {"Ref": "DesiredSecondsToCompleteQueue"},
    "Period": "60",
    "EvaluationPeriods": "1",
    "AlarmActions" : [{
      "Ref": "ScaleUpAction"
    }]
  }
}


Visualizing the Outcome

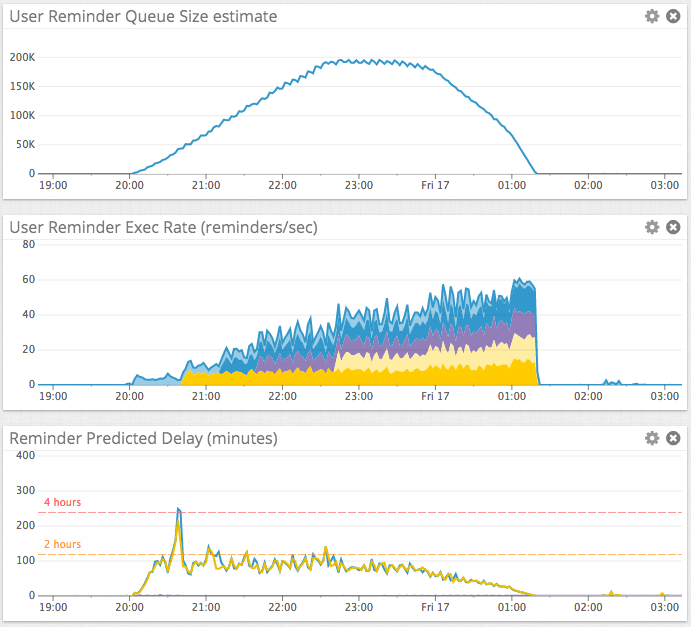
What’s a cloud blog without some graphs? Here’s what our load and scaling looks like after implementing this custom metric and scaling. Each of the colors in the middle graph represents a service instance. The bottom graph is in minutes for readability. Note that our instances terminate themselves when there is nothing left to do.

Screen Shot 2015-04-17 at 11.37.21 AM

I hope this blog has shown you that it’s quite easy to publish your own CloudWatch metrics and scale your EC2 AutoScalingGroups accordingly.

Upgrading Dropwizard 0.6 to 0.7

At Bazaarvoice we use Dropwizard for a lot of our java based SOA services. Recently I upgraded our Dropwizard dependency from 0.6 to the newer 0.7 version on a few different services. Based on this experience I have some observations that might help any other developers attempting to do the same thing.

Package Name Change
The first change to look at is the new package naming. The new io.dropwizard package replaces com.yammer.dropwizard. If you are using codahale’s metrics library as well, you’ll need to change com.yammer.metrics to com.codahale.metrics. I found that this was a good place to start the migration: if you remove the old dependencies from your pom.xml you can start to track down all the places in your code that will need attention (if you’re using a sufficiently nosy IDE).

- com.yammer.dropwizard -> io.dropwizard
- com.yammer.dropwizard.config -> io.dropwizard.setup
- com.yammer.metrics -> com.codahale.metrics

Class Name Change
aka: where did my Services go?

Something you may notice quickly is that the Service interface is gone, it has been moved to a new name: Application.

- Service -> Application

Configuration Changes
The Configuration object hierarchy and yaml organization has also changed. The http section in yaml has moved to server with significant working differences.

Here’s an old http configuration:

http:
  port: 8080
  adminPort: 8081
  connectorType: NONBLOCKING
  requestLog:
    console:
      enabled: true
    file:
      enabled: true
      archive: false
      currentLogFilename: target/request.log

and here is a new server configuration:

server:
  applicationConnectors:
    - type: http
      port: 8080
  adminConnectors:
    - type: http
      port: 8081
  requestLog:
    appenders:
      - type: console
      - type: file
        currentLogFilename: target/request.log
        archive: true

There are at least two major things to notice here:

  1. You can create multiple connectors for either the admin or application context. You can now serve several different protocols on different ports.
  2. Logging is now appender based, and you can configure a list of appenders for the request log.

Speaking of appender-based logging, the logging configuration has changed as well.

Here is an old logging configuration:

logging:
  console:
    enabled: true
  file:
    enabled: true
    archive: false
    currentLogFilename: target/diagnostic.log
  level: INFO
  loggers:
    "org.apache.zookeeper": WARN
    "com.sun.jersey.spi.container.servlet.WebComponent": ERROR

and here is a new one:

logging:
  level: INFO
  loggers:
    "org.apache.zookeeper": WARN
    "com.sun.jersey.spi.container.servlet.WebComponent": ERROR
  appenders:
    - type: console
    - type: file
      archive: false
      currentLogFilename: target/diagnostic.log

Now that you can configure a list of logback appenders, you can write your own or get one from a library. Previously this kind of logging configuration was not possible without significant hacking.

Environment Changes
The whole environment API has been re-designed for more logical access to different components. Rather than just making calls to methods on the environment object, there are now six component specific environment objects to access.

JerseyEnvironment jersey = environment.jersey();
ServletEnvironment servlets = environment.servlets();
AdminEnvironment admin = environment.admin();
LifecycleEnvironment lifecycle = environment.lifecycle();
MetricRegistry metrics = environment.metrics();
HealthCheckRegistry healthCheckRegistry = environment.healthChecks();

AdminEnvironment extends ServletEnvironment since it’s just the admin servlet context.

By treating the environment as a collection of libraries rather than a Dropwizard monolith, fine-grained control over several configurations is now possible and the underlying components are easier to interact with.

Here is a short rundown of the changes:

Lifecycle Environment
Several common methods were moved to the lifecycle environment, and the build pattern for Executor services has changed.

0.6:

     environment.manage(uselessManaged);
     environment.addServerLifecycleListener(uselessListener);
     ExecutorService service = environment.managedExecutorService("worker-%", minPoolSize, maxPoolSize, keepAliveTime, duration);
     ExecutorServiceManager esm = new ExecutorServiceManager(service, shutdownPeriod, unit, poolname);
     ScheduledExecutorService scheduledService = environment.managedScheduledExecutorService("scheduled-worker-%", corePoolSize);

0.7:

     environment.lifecycle().manage(uselessManaged);
     environment.lifecycle().addServerLifecycleListener(uselessListener);
     ExecutorService service = environment.lifecycle().executorService("worker-%")
             .minThreads(minPoolSize)
             .maxThreads(maxPoolSize)
             .keepAliveTime(Duration.minutes(keepAliveTime))
             .build();
     ExecutorServiceManager esm = new ExecutorServiceManager(service, Duration.seconds(shutdownPeriod), poolname);
     ScheduledExecutorService scheduledExecutorService = environment.lifecycle().scheduledExecutorService("scheduled-worker-%")
             .threads(corePoolSize)
             .build();

Other Miscellaneous Environment Changes
Here are a few more common environment configuration methods that have changed:

0.6

environment.addResource(Dropwizard6Resource.class);

environment.addHealthCheck(new DeadlockHealthCheck());

environment.addFilter(new LoggerContextFilter(), "/loggedpath");

environment.addServlet(PingServlet.class, "/ping");

0.7

environment.jersey().register(Dropwizard7Resource.class);

environment.healthChecks().register("deadlock-healthcheck", new ThreadDeadlockHealthCheck());

environment.servlets().addFilter("loggedContextFilter", new LoggerContextFilter()).addMappingForUrlPatterns(EnumSet.allOf(DispatcherType.class), true, "/loggedpath");

environment.servlets().addServlet("ping", PingServlet.class).addMapping("/ping");

Object Mapper Access

It can be useful to access the objectMapper for configuration and testing purposes.

0.6

ObjectMapper objectMapper = bootstrap.getObjectMapperFactory().build();

0.7

ObjectMapper objectMapper = bootstrap.getObjectMapper();

HttpConfiguration
This has changed a lot, it is much more configurable and not quite as simple as before.
0.6

HttpConfiguration httpConfiguration = configuration.getHttpConfiguration();
int applicationPort = httpConfiguration.getPort();

0.7

HttpConnectorFactory httpConnectorFactory = (HttpConnectorFactory) ((DefaultServerFactory) configuration.getServerFactory()).getApplicationConnectors().get(0);
int applicationPort = httpConnectorFactory.getPort();

Test Changes
The functionality provided by extending ResourceTest has been moved to ResourceTestRule.
0.6

import com.yammer.dropwizard.testing.ResourceTest;

public class Dropwizard6ServiceResourceTest extends ResourceTest {
  @Override
  protected void setUpResources() throws Exception {
    addResource(Dropwizard6Resource.class);
    addFeature("booleanFeature", false);
    addProperty("integerProperty", new Integer(1));
    addProvider(HelpfulServiceProvider.class);
  }
}

0.7

import io.dropwizard.testing.junit.ResourceTestRule;
import org.junit.Rule;

public class Dropwizard7ServiceResourceTest {

  @Rule
  ResourceTestRule resources = setUpResources();

  protected ResourceTestRule setUpResources() {
    return ResourceTestRule.builder()
      .addResource(Dropwizard6Resource.class)
      .addFeature("booleanFeature", false)
      .addProperty("integerProperty", new Integer(1))
      .addProvider(HelpfulServiceProvider.class)
      .build();
  }
}

Dependency Changes

Dropwizard 0.7 has new dependencies that might affect your project. I’ll go over some of the big ones that I ran into during my migrations.

Guava
Guava 18.0 has a few API changes:

  • Closeables.closeQuietly only works on objects implementing InputStream instead of anything implementing Closeable.
  • All the methods on HashCodes have been migrated to HashCode.

Metrics
Metric 3.0.2 is a pretty big revision to the old version, there is no longer a static Metrics object available as the default registry. Now MetricRegistries are instantiated objects that need to be managed by your application. Dropwizard 0.7 handles this by giving you a place to put the default registry for your application: bootstrap.getMetricRegistry().

Compatible library version changes
These libraries changed versions but required no other code changes. Some of them are changed to match Dropwizard dependencies, but are not directly used in Dropwizard.

Jackson
2.3.3

Jersey
1.18.1

Coursera Metrics-Datadog
1.0.2

Jetty
9.0.7.v20131107

Apache Curator
2.4.2

Amazon AWS SDK
1.9.21

Future Concerns
Dropwizard 0.8
The newest version of Dropwizard is now 0.8, once it is proven stable we’ll start migrating. Hopefully I’ll find time to write another post when that happens.

Thank You For Reading
I hope this article helps.

Conversations API Deprecation for Versions 4.9, 5.0 and 5.1, and Custom Domains

This blog post only applies to the Conversations API and does not apply to any other Bazaarvoice product. You are able to identify the Bazaarvoice Conversations API by the following:

  • Path includes ‘data’: http://api.bazaarvoice.com/data/reviews.json?

Code related to the Bazaarvoice Hosted Display does not need modification. It can be identified by the following:

  • References ‘bvapi.js’: http://display.ugc.bazaarvoice.com/static/ClientName/en_US/bvapi.js

Still unsure if this applies to you? Learn more.

Today we are announcing two important changes to our Conversations API services:

  • Deprecation of Conversations API versions older than 5.2 (4.9, 5.0, 5.1)
  • Ending Conversations API service using custom domains

Both of these changes will go into effect on April 30, 2016.

Our newer APIs and universal domain system offer you important advantages in both features and performance. In order to best serve our customers, Bazaarvoice is focusing its API efforts on the latest, highest performing API services. By deprecating older versions, we can refocus our energies on the current and future API services, which we feel offer the most benefits to our customers. Please visit our Upgrade Guide to learn more about the Conversations API, our API versioning, and the steps necessary to support the upgrade.

We understand that this news may be surprising. This is your first notification of this change. In the months and weeks ahead, we will continue to remind you that this change is coming.

We also understand that this change will require effort on your part. Bazaarvoice is committed to making this transition easy for you. We are prepared to assist you in a number of ways:

  • Pre-notification: You have 12 months to plan for and implement the change.
  • Documentation: We have specific documentation to help you.
  • Support: Our support team is ready to address any questions you may have.
  • Services: Our services teams are available to provide additional assistance.

In summary, on April 30, 2016, Conversations API versions released before 5.2 will no longer be available. Applications and websites using versions before 5.2 will no longer function properly after April 30, 2016. In addition, all Conversations API calls, regardless of version, made to a custom domain will no longer respond. Applications and websites using custom domains (such as “ReviewStarsInc.ugc.bazaarvoice.com”) will no longer function properly after April 30, 2016. If your application or website is making API calls to Conversations API versions 4.9, 5.0 and 5.1 you will need to upgrade to the current Conversations API (5.4) and use the universal domain (“api.bazaarvoice.com.”). Applications using Conversations API versions 5.2 and later (5.2, 5.3, 5.4) with the universal domain will continue to receive uninterrupted API service.

If you have any questions about this notice, please submit a case in Spark. We will periodically update this blog and our developer Twitter feed (@BazaarvoiceDev) as we move closer to the change of service date.

Thank you for your partnership,
Chris Kauffman
Sr. Product Manager