
One of the chief promises of the cloud is fast scalability, but what good is snappy scalability without load prediction to match? How many teams out there are still manually switching group sizes when load spikes? If you would like to make your Amazon EC2 scaling more predictive, less reactive and hopefully less expensive it is my intention to help you with this article.
Problem 1: AWS EC2 Autoscaling Groups can only scale in response to metrics in CloudWatch and most of the default metrics are not sufficient for predictive scaling.
For instance, by looking at the CloudWatch Namespaces reference page we can see that Amazon SQS queues, EC2 Instances and many other Amazon services post metrics to CloudWatch by default.
From SQS you get things like NumberOfMessagesSent and SentMessageSize. EC2 Instances post metrics like CPUUtilization and DiskReadOps. These metrics are helpful for monitoring. You could also use them to reactively scale your service.
The downside is that by the time you notice that you are using too much CPU or sending too few messages, you’re often too late. EC2 instances take time to start up and instances are billed by the hour, so you’re either starting to get a backlog of work while starting up or you might shut down too late to take advantage of an approaching hour boundary and get charged for a mostly unused instance hour.
More predictive scaling would start up the instances before the load became business critical or it would shut down instances when it becomes clear they are not going to be needed instead of when their workload drops to zero.
Problem 2: AWS CloudWatch default metrics are only published every 5 minutes.
In five minutes a lot can happen, with more granular metrics you could learn about your scaling needs quite a bit faster. Our team has instances that take about 10 minutes to come online, so 5 minutes can make a lot of difference to our responsiveness to changing load.
Solution 1 & 2: Publish your own CloudWatch metrics
Custom metrics can overcome both of these limitations, you can publish metrics related to your service’s needs and you can publish them much more often.
For example, one of our services runs on EC2 instances and processes messages off an SQS queue. The load profile can vary over time; some messages can be handled very quickly and some take significantly more time. It’s not sufficient to simply look at the number of messages in the queue as the average processing speed can vary between 2 and 60 messages per second depending on the data.
We prefer that all our messages be handled within 2 hours of being received. With this in mind I’ll describe the metric we publish to easily scale our EC2 instances.
ApproximateSecondsToCompleteQueue = MessagesInQueue / AverageMessageProcessRate
The metric we publish is called ApproximateSecondsToCompleteQueue. A scheduled executor on our primary instance runs every 15 seconds to calculate and publish it.
private AmazonCloudWatchClient _cloudWatchClient = new AmazonCloudWatchClient();
_cloudWatchClient.setRegion(RegionUtils.getRegion("us-east-1"));

...

PutMetricDataRequest request = new PutMetricDataRequest()
  .withNamespace(CUSTOM_SQS_NAMESPACE)
  .withMetricData(new MetricDatum()
  .withMetricName("ApproximateSecondsToCompleteQueue")
  .withDimensions(new Dimension()
                    .withName(DIMENSION_NAME)
                    .withValue(_queueName))
  .withUnit(StandardUnit.Seconds)
  .withValue(approximateSecondsToCompleteQueue));

_cloudWatchClient.putMetricData(request);
In our CloudFormation template we have a parameter calledDesiredSecondsToCompleteQueue and by default we have it set to 2 hours (7200 seconds). In the Auto Scaling Group we have a scale up action triggered by an Alarm that checks whether DesiredSecondsToCompleteQueue is less than ApproximateSecondsToCompleteQueue.
"EstimatedQueueCompleteTime" : {
  "Type": "AWS::CloudWatch::Alarm",
  "Condition": "HasScaleUp",
  "Properties": {
    "Namespace": "Custom/Namespace",
    "Dimensions": [{
      "Name": "QueueName",
      "Value": { "Fn::Join" : [ "", [ {"Ref": "Universe"}, "-event-queue" ] ] }
    }],
    "MetricName": "ApproximateSecondsToCompleteQueue",
    "Statistic": "Average",
    "ComparisonOperator": "GreaterThanThreshold",
    "Threshold": {"Ref": "DesiredSecondsToCompleteQueue"},
    "Period": "60",
    "EvaluationPeriods": "1",
    "AlarmActions" : [{
      "Ref": "ScaleUpAction"
    }]
  }
}
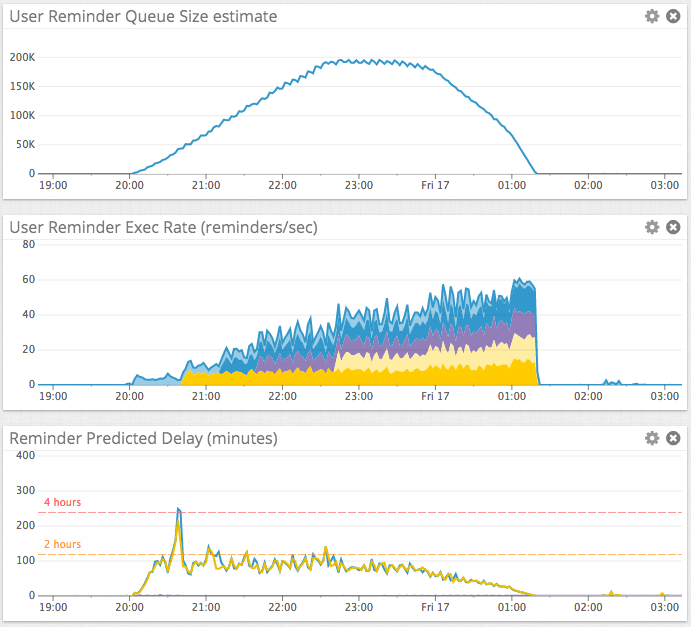
Visualizing the Outcome
What’s a cloud blog without some graphs? Here’s what our load and scaling looks like after implementing this custom metric and scaling. Each of the colors in the middle graph represents a service instance. The bottom graph is in minutes for readability. Note that our instances terminate themselves when there is nothing left to do.
I hope this blog has shown you that it’s quite easy to publish your own CloudWatch metrics and scale your EC2 AutoScalingGroups accordingly.