How to seamlessly move 300 Million shoppers to a highly scalable architecture, part 2

Divide and Conquer

As Engineers, we often like nice clean solutions that don’t carry along what we like to call technical debt.  Technical debt literally is stuff that we have to go back to fix/rewrite later or that requires significant ongoing maintenance effort.  In a perfect world, we fire up the the new platform and move all the traffic over.  If you find that perfect world, please send an Uber for me. Add to this the scale of traffic we serve at Bazaarvoice, and it’s obvious it would take time to harden the new system.

The secret to how we pulled this off lies in the architecture choices to break apart the challenge into two parts: frontend and backend.  While we reengineered the front-end into the the new javascript solution, there were still thousands of customers using the template-based front end.  So, we took the original server side rendering code and turned it into a service talking to our new Polloi service.  This enabled us to handle request from client sites exactly like the Classic original system.

Also, we created a service improved upon the original API but was compatible from a specific version forward.  We chose to not try to be compatible for all version for all time, as all APIs go through evolution and deprecation.  We naturally chose the version that was compatible with the new Javascript front end.  With these choices made, we could independently decide when and how to move clients to the new backend architecture irrespective of the front-end service they were using.

A simplified view of this architecture looks like this:

Divide_Conquer_arch

With the above in place, we can switch a Javascript client to use the new version of the API through just changing the endpoint of the API key.  For a template-based client, we can change the endpoint to the new referring service through a configuration in our CDN Akamai.

Testing for compatibility is a lot of work, though not particularly difficult. API compatibility is pretty straight forward, which testing whether a template page renders correctly is a little more involved especially since those pages can be highly customized.  We found the most effective way to accomplish the later since it was a one time event was with manual inspection to be sure that the pages rendered exactly the same on our QA clusters as they did in the production classic system.

Success we found early on was based on moving cohorts of customers together to the new system. At first we would move a few at a time, making absolutely sure the pages rendered correctly, monitoring system performance, and looking for any anomalies.  If we saw a problem, we could move them back quickly through reversing the change in Akamai. At first much of this was also manual, so in parallel, we had to build up tooling to handle the switching of customers, which even included working with Akamai to enhance their API so we could automate changes in the CDN.

From moving a few clients at a time, we progressed to moving over 10s of clients at a time. Through a tremendous engineering effort, in parallel we improved the scalability of our ElasticSearch clusters and other systems which allowed us to move 100s of clients at a time, then 500 clients at time. As of this writing, we’ve moved over 5,000 sites and 100% of our display traffic is now being served from our new architecture.

More than just serving the same traffic as before, we have been able to move over display traffic for new services like our Curations product that takes in and processes millions of tweets, Instagram posts, and other social media feeds.  That our new architecture could handle without change this additional, large-scale use case is a testimony to innovative engineering and determination by our team over the last 2+ years. Our largest future opportunities are enabled because we’ve successfully been able to realize this architectural transformation.

Rearchitecting the Team

In addition to rearchitecting the service to scale, we also had to rearchitect our team. As we set out on this journey to rebuild our solution into a scalable, cloud based service oriented architecture, we had to reconsider the very way our teams are put together.  We reimagined our team structure to include all the ingredients the team needs to go fast.  This meant a big investment in devops – engineers that focus on new architectures, deployment, monitoring, scalability, and performance in the cloud.

A critical part of this was a cultural transformation where the service is completely owned by the team, from understanding the requirements, to code, to automated test, to deployment, to 24×7 operation.  This means building out a complete monitoring and alerting infrastructure and that the on-call duty rotated through all members of the team.  The result is the team becomes 100% aligned around the success of the service and there is no “wall” to throw anything over – the commitment and ownership stays with the team.

For this team architecture to succeed, the critical element is to ensure the team has all the skills and team players needed to succeed.  This means platform services to support the team, strong product and program managers, talented QA automation engineers that can build on a common automation platform, gifted technical writers, and of course highly talented developers.  These teams are built to learn fast, build fast, and deploy fast, completely independent of other teams.

Supporting the service-oriented teams, a key element is our Platform Infrastructure team we created to provide a common set of cloud services to support all our teams.  Platform Infrastructure is responsible for the virtual private cloud (VPC) supporting the new services running in amazon web services. This team handles the overall concerns of security, network, service discovery, and other common services within the VPC. They also set up a set of best practices, such as ensuring all cloud instances are tagged with the name of the team that started them.

To ensure the best practices are followed, the platform infrastructure team created “Beavers” (a play on words describing a engineer at Bazaarvoice, a “BVer”). An idea borrowed from Netflix’s chaos monkeys, these are automated processes that run and examine our cloud environment in real time to ensure the best practices are followed.  For example, the “Conformity Beaver” runs regularly and checks to make sure all instances and buckets are tagged with team names. If it finds one that is not, it infers the owner and emails team aliases of the problem.  If not corrected, Conformity Beaver can terminate the instance.  This is just one example of the many Beavers we have created to help maintain consistency in a world where we have turned teams lose to move as quickly as possible.

An additional key common capability created by the Platform Infrastructure team is our Badger monitoring services. Badger enables teams to easily plug in a common healthcheck monitoring capability and can automatically discover nodes as they are started in the cloud. This service enables teams to easily implement these healthcheck that is captured in a common place and escalated through a notification system in the event of a service degradation.

The Proof is in the Pudding

The Black Friday and Holiday shopping season of 2015 was one of the smoothest ever in the history of Bazaarvoice while serving record traffic. From Black Friday to Cyber Monday, we saw over 300 million visitors.  At peak on Black Friday, we were seeing over 97,000 requests per second as we served up over 2.6 billion review impressions, a 20% increase over the year before.  There have been years of hard work and innovation that preceded this success and it is a testimony to what our new architecture is capable of delivering.

Keys to success

A few ingredients we’ve found to be important to successfully pull off a large scale rearchitecture such as described here:

  • Brilliant people. There is no replacement for brilliant engineers who are fearless in adopting new technologies and tackling what some will say can’t be done.
  • Strong leaders – and the right leaders at the right time. Often the leaders that sell the vision and get an undertaking like this going will need to be supplemented with those that can finish strong.
  • Perseverance and Determination – building a new platform using new technologies is going to be a much bigger challenge than you can estimate, requiring new skills, new approaches, and lots of mistakes. You must be completely determined and focused on the end game.
  • Tie back to business benefit – keep business informed of the benefits and ensuring that those benefits can be delivered continuously rather than a big bang. It will be a large investment and it is important that the business see some level of return as quickly as possible.
  • Make space for innovation – create room for engineers to learn and grow. We support this through organizing hackathons and time for growth projects that benefit the individual, team, and company.

Reachitecture is a Journey

One piece of advice: don’t be too critical of yourself along the way; celebrate each step of the reachitecture journey. As software engineers, we are driven to see things “complete”, wrapped up nice and neat, finished with a pretty bow. When replacing an existing system of significant complexity, this ideal is a trap because in reality you will never be complete.  It has taken us over 3 years of hard work to reach this point, and there are more things we are in the process of moving to newer architectures. Once we complete the things in front of us now, there will be more steps to take since we live in an ever evolving landscape. It is important to remember that we can never truly be complete as there will be new technologies, new architectures that deliver more capabilities to your customers, faster, and at a lower cost. Its a journey.

Perhaps that is the reason many companies can never seem to get started. They understandably want to know “When will it be done?” “What is it going to cost?”, and the unpopular answers are of course, never and more than you could imagine.  The solution to this puzzle is to identify and articulate the business value to be delivered as a step in the larger design of a software platform transformation.  Trouble is of course, you may only realistically be able to design the first few steps of your platform rearchitecture, leaving a lot of technical uncertainty ahead. Get comfortable with it and embrace it as a journey.  Engineer solid solutions in a service oriented way with clear interfaces and your customers will be happy never knowing they were switched to the next generation of your service.

authored by Gary Allison

How to seamlessly move 300 Million shoppers to a highly scalable architecture, part 1

At Bazaarvoice, we’ve pulled off an incredible feat, one that is such an enormous task that I’ve seen other companies hesitate to take on. We’ve learned a lot along the way and I wanted to share some of these experiences and lessons in hopes they may benefit others facing similar decisions.

The Beginning

Our original Product Ratings and Review service served us well for many years, though eventually encountered severe scalability challenges. Several aspects we wanted to change: a monolithic Java code base, fragile custom deployment, and server-side rendering. Creative use of tenant partitioning, data sharding and horizontal read scaling of our MySQL/Solr based architecture allowed us to scale well beyond our initial expectations. We’ve documented how we have accomplished this scaling on our developer blog in several past posts if you’d like to understand more. Still, time marches on and our clients have grown significantly in number and content over the years. New use cases have come along since the original design: emphasis on the mobile user and responsive design, accessibility, the emphasis on a growing network of consumer generated content flowing between brands and retailers, and the taking on of new social content that can come in floods from Twitter, Instagram, Facebook, etc.

As you can imagine, since the product ratings and reviews in our system are displayed on thousands of retailer and brand websites around the world, the read traffic from review display far outweighs the write traffic from new reviews being created. So, the addition of clusters of Solr servers that are highly optimized for fast queries was a great scalability addition to our solution.

A highly simplified diagram of our classic architecture:

Highly simplified view of our Classic Architecture

However, in addition to fast review display when a consumer visited a product page, another challenge started emerging out of our growing network of clients. This network is comprised of Brands like Adidas and Samsung who collect reviews on their websites from consumers who purchased the product and then want to “syndicate” those reviews to a set of retailer ecommerce sites where shoppers can benefit from them. Aside from the challenges of product matching which are very interesting, under the MySQL architecture this could mean the reviews could be copied over and over throughout this network. This approach worked for several years, but it was clear we needed a plan for the future.

As we grew, so did the challenge of an expanding volume of data in the master databases to serve across an expanding network of clients. This, together with the need to deliver more front-end web capability to our customers, drove us to what I hope you will find is a fascinating story of rearchitecture.

The Journey Begins

One of the first things we decided to tackle was to start moving analytics and reporting off the existing platform so that we could deliver new insights to our clients showing how reviews are used by shoppers in their purchase decisions. This choice also enabled us to decouple the architecture and spin up parallel teams to speed delivery. To deliver these capabilities, we adopted big data architectures based on Hadoop and HBase to be able to assimilate hundreds of millions of web visits into analytics that would paint the full shopper journey picture for our clients. By running map reduce over the large set of review traffic and purchase data, we are able to give our clients insight into these shopper behaviors and help our clients better understand the return on investment they receive from consumer generated content. As we built out this big data architecture, we also saw the opportunity to offload reporting from the review display engine. Now, all our new reporting and insight efforts are built off this data and we are actively working to move existing reporting functionality to this big data architecture.

On the front end, flexibility and mobile was a huge driver in our rearchitecture. Our original template-driven, server-side rendering can provide flexibility, but that ultimate flexibility is only required in a small number of use cases. For the vast majority, a client-side rendering via javascript with behavior that can be configured through a simple UI would yield a better mobile-enabled shopping experience that’s easier for clients to control. We made the call early on not to try to force migration of clients from one front end technology to another. For one thing, it’s not practical for a first version of a product to be 100% feature function capable to the predecessor. For another, there was just simply no reason to make clients choose. Instead, as clients redesigned their sites and as new clients were onboard, they opt’ed in to the new front end technology.

We attracted some of the top javascript talent in the country to this ambitious undertaking. There are some very interesting details of the architecture we built that have been described on our developer blog and that are available as open source projects on in our bazaarvoice github organization. Look for the post describing our Scoutfile architecture in March of 2015. The BV team is committed to giving back to the Open Source community and we hope this innovation helps you in your rearchitecure journey.

On the backend, we took inspiration from both Google and Netflix. It was clear that we needed to build an elastic, scalable, reliable, cloud-based data store and query layer. We needed to reorganize our engineering team into autonomous service oriented teams that could move faster. We needed to hire and build new skills in new technologies. We needed to be able to roll this out as transparently as possible to our clients while serving live shopping traffic so no one knows its happening at all. Needless to say, we had our work cut out for us.

For the foundation of our new architecture, we chose Cassandra, an Open Source NoSQL data solution based on influence of ideas from Google and their BigTable architecture. Cassandra had been battle hardened at Netflix and was a great solution for a cloud resilient, reliable storage engine. On this foundation we built a service we call Emo, originally intended for sentiment analysis. As we made progress towards delivery, we began to understand the full potential of Cassandra and its NoSQL based architecture as our primary display storage.

With Emo, we have solved the potential data consistency issues of Cassandra and guarantee ACID database operations. We can also seamlessly replicate and coordinate a consistent view of all the rating and review data across AWS availability zones worldwide, providing a scalable and resilient way to serve billions of shoppers. We can also be selective in the data that replicates for example from the European Union (EU) so that we can provide assurances of privacy for EU based clients. In addition to this consistency capability, Emo provides a databus that allows any Bazaarvoice service to listen for the kinds of changes the service particularly needs, perfect for a new service oriented architecture. For example, a service can listen for the event of a review passing moderation which would mean that it should now be visible to shoppers.

While Emo/Cassandra gave us many advantages, its NoSQL query capability is limited to what Cassandra’s key-value paradigm. We learned from our experience with Solr that having a flexible, scalable query layer on top of the master datastore resulted in significant performance advantages for calculating on-demand results of what to display during a shopper visit. This query layer naturally had to provide the distributed advantages to match Emo/Cassandra. We chose ElasticSearch for our architecture and implemented a flexible rules engine we call Polloi to abstract the indexing and aggregation complexities away from engineers on teams that would use this service. Polloi hooks up to the Emo databus and provides near real time visibility to changes flowing into Cassandra.

The rest of the monolithic code base was reimplemented into services as part of our service oriented architecture. Since your code is a direct reflection of the team, as we took on this challenge we formed autonomous teams that owned everything full cycle from initial conception to operation in production. We built the teams with all the skills needed for success: product owners, developers, QA engineers, UX designers (for front end), DevOps engineers, and tech writers. We built services that managed the product catalog, UI Configuration, syndication edges, content moderation, review feeds, and many more. We have many of these rearchitected services now in production and serving live traffic. Some examples include services that perform the real time calculation of what Brands are syndicating consumer generated content to which Retailers, services that process client product catalog feeds for 100s of millions of products, new API services, and much more.

To make all of the above more interesting, we also created this service-oriented architecture to leverage the full power of Amazon’s AWS cloud. It was clear we had the uncommon opportunity to build the platform from the ground up to run in the cloud with monitoring, elastic resiliency, and security capabilities that were unavailable in previous data center environments. With AWS, we can take advantage of new hardware platforms with a push of a button, create multi datacenter failover capabilities, and use new capabilities like elastic MapReduce to deliver big data analytics to our clients. We build auto-scaling groups that allow our services to automatically add compute capacity as client traffic demands grow. We can do all of this with a highly skilled team that focuses on delivering customer value instead of hardware procurement, configuration, deployment, and maintenance.

So now after two plus years of hard work, we have a modern, scalable service-oriented solution that can mirror exactly the original monolithic service. But more importantly, we have a production hardened new platform that we will scale horizontally for the next 10 years of growth. We can now deliver new services much more quickly leveraging the platform investment that we have made and deliver customer value at scale faster than ever before.

So how did we actually move 300 million shoppers without them even knowing?  We’ll take a look at this in an upcoming post!

authored by Gary Allison


Quick and Easy Web Service Load Testing with JMeter

What is Load Testing and Why Should I Care?

Somewhere between the disciplines of Dev Operations, Database Management, Software Design and Testing, there’s a Venn diagram where at its crunchy, peanut-butter filled center lies the discipline of performance testing.

crunky
 Herein lies the performant (sic)

Which is to say, professional performance testers have a very specific set of skills (that they have acquired over many years) that make them a nightmare for non-performing web services. This helps them to answer the following question from our clients:

“Just what is the level of performance we can expect from your service”?

What if your project team doesn’t have access to anyone with a background in perf testing? What if you suddenly find yourself needing to answer the above question but don’t know where to begin?

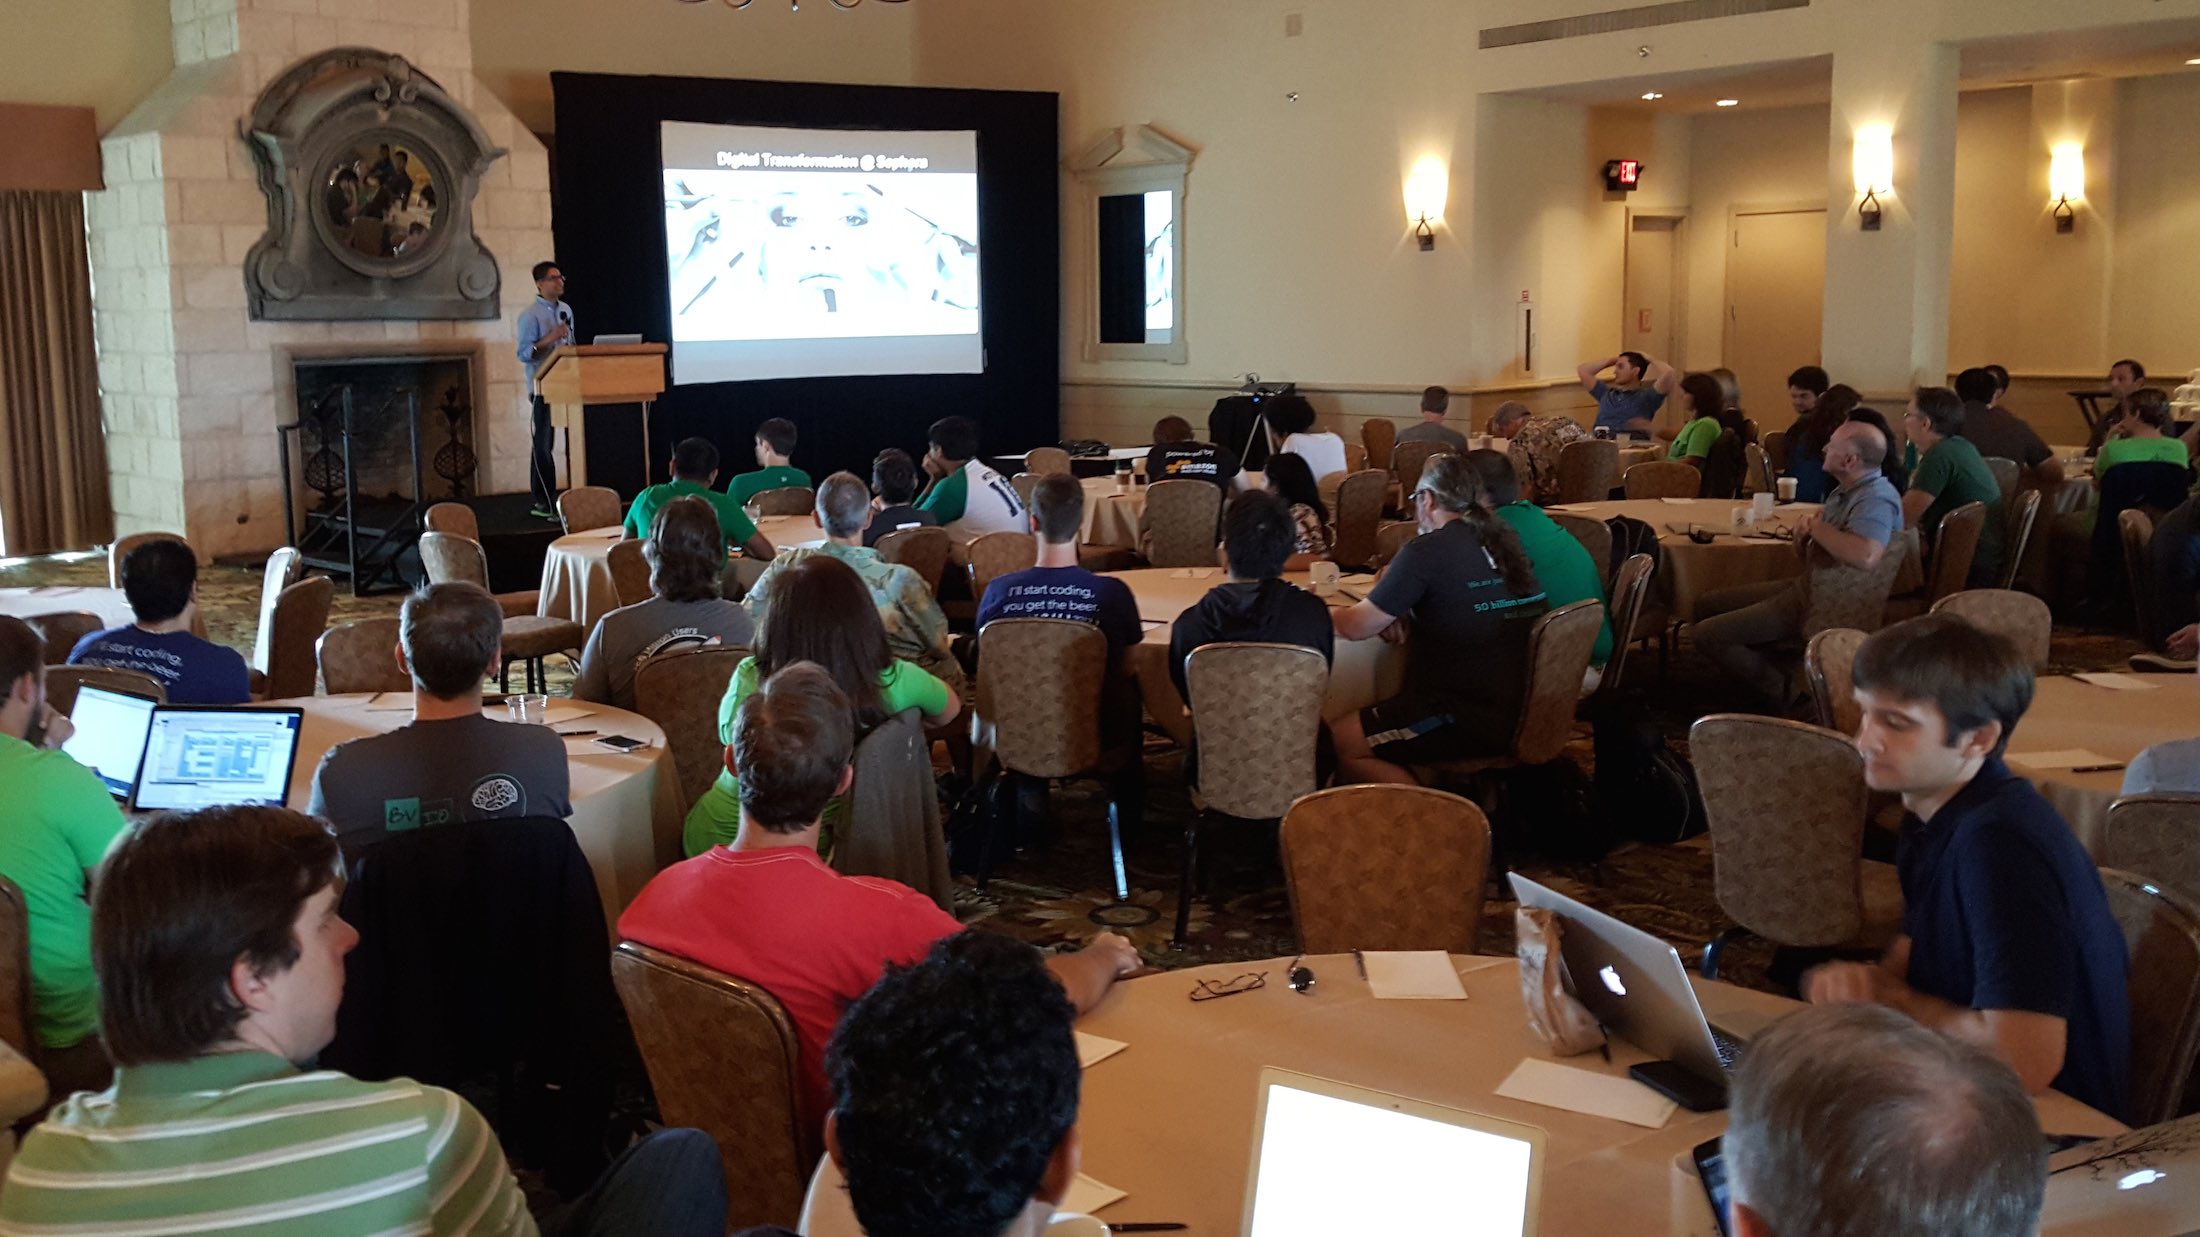
Scary, right? Bazaarvoice’s Shopper Marketing team recently found itself in this exact situation (they weren’t being hunted by Liam Neeson so they had that going for them though).

takentester


The point of this article is not to bootstrap you, the reader, into a perf-testing, dev-ops version of the dude from Taken. Instead, it’s to show how a small team can quickly (and cheaply) performance test a web service in order to insure they can meet a client’s needs.

Approach:

If you’ve never been involved in any sort of performance testing for web services before, there are essentially two different tracks performance testing can begin from:

Targeted Testing – you have a pre-defined level of service/latency that you need to reach. Generally, you already have an understanding of what your service’s current performance baseline is.

Exploratory Testing – The current performance baseline isn’t really known. Here, the goal is to find out at what point and how quickly performance degrades.

Typically, with small-team oriented projects, you’ll find often that the team starts with the latter path in order to then progress to the former – as was the case with Shopper Marketing’s efforts here.

Our Setup:

We have a RESTful web API (built in Java) which handles requests for shopper profile information stored and sorted across multiple types of data stores. This API will service a JavaScipt based front end widget deployed to a client’s home page to display product data. The client’s home page receives approximately 20 simultaneous unique views per second on average. Can our API service the client at that level?

To test this, we constructed a load test in JMeter that would do the following:

  1. Execute a series of continuous requests to the API that mimic those that will come from the client front end.
  2. Enable the test to run parallel requests to simulate a specific user load
  3. Use real, sampled data so that the requests and responses will be as close to real-world as possible
  4. Measure the response time of the API over time
  5. Measure the number of successful responses vs failures from the API while under load

Why JMeter:

So why are we conducting our test using JMeter? Isn’t that thing two days older than dirt?

_original


Dirt: its old.

Well, for one, JMeter is free.

jmeter


Jmeter: Its older and free-er

We could just leave it at that but wait, there’s more:

JMeter is a load testing tool that has been around for many years. It isn’t just developed and maintained by the same group responsible for Apache Web Server, JMeter is a modified version of Apache itself.  It specializes not only in sending and receiving HTTP requests (you know, like a web server) but with monitoring and reporting tools available for it as well as a wealth of plugins.

50_banner

Sure, there are better (cough! more expensive cough!) tools out there that specialize in load testing but in our case, we needed to determine metrics quickly and with a tool that could be easily set up and re-run numerous times (heavy emphasis on quick and cheap).

Performance testing is a very repetitive process. You will be executing tests, reporting findings, then modifying your service in order to improve performance – followed by a lot of washing, rinsing and repeating to further refine performance. Whatever load testing tool you choose, make sure it is one that allows you to quickly and easily modify, re-run and re-report findings as you will be living your own form of dev-ops Groundhog Day when you take on this endeavor.

Groundhog_Day_(movie_poster)
 A thought provoking documentary on the life and times
 of a performance tester

But enough memes – lets get down to how we programmed Jmeter to show us pretty performance graphs!

Downloading the Application:

You can download JMeter from the Apache Software Foundation here: http://jmeter.apache.org/download_jmeter.cgi

Note – Jmeter requires Java 6 or above (you are using Java 8+ right?) and you should have your Java HOME environment variables set up on your local environment (or wherever you plan on deploying and executing your load tests from).

Latest Java download:
http://java.com/en/download/

Setting up your local Java environment:
https://docs.oracle.com/cd/E19182-01/820-7851/inst_cli_jdk_javahome_t/

Once the JMeter binary package is downloaded and unzipped to your test machine, start JMeter by running ./jmeter from the command line within the application’s bin/ directory.

Configuring Jmeter:

Regardless of what load testing tool you prefer to use; its technical merits will always be tied to its reporting capability. JMeter’s default reporting capabilities are pretty limited. However, there are a wealth of plugins to augment this. Before going any further you will want to install JMeter Plugins Extras and JMeter Plugins Extras Lib in order to get the results you’ll want from JMeter.

http://jmeter-plugins.org/downloads/all/

68263351

Unarchive the contents of these files and place them in the lib/ext directory within your JMeter installation.

Once finished, re-start JMeter.

Note – you can install, update and manage plugins for JMeter using the JMeter plugin manager. This feature is in Beta so your mileage may vary. More on the JMeter plugin manager here: http://jmeter-plugins.org/wiki/PluginsManager/

Designing a Test:

For those new to JMeter, setting up a test is rather simple but there’s a little bit of jargon to explain. A basic JMeter test consists of the following:

Test Plan – A collection of all of the elements that make up your load test

Thread Group – Controls the number of threads and their ramp-up/ramp-down time. Think of each thread as a unique visitor to your site/request to your service.

Listeners – These will be attached to your thread group and will generate your reports

Config Elements – These contain a variety of base information required to execute the test – mainly domain, IP or port information related to the service’s location. Optionally, some config elements can be used to handle situations like having to authenticate through LDAP during tests.

Samplers – These elements are used to generate and handle data as well as options and arguments during test (e.g. request payloads and arguments).

Building the Test – Step by Step:

1. Click on your test plan and assign it a name and check the Run Teardown option
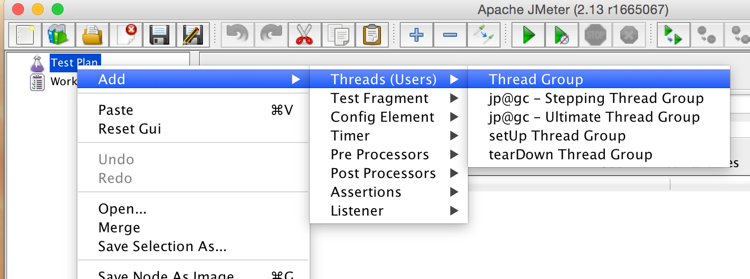
2. Right click on the test plan and select Add > Threads > Thread Group

jm1

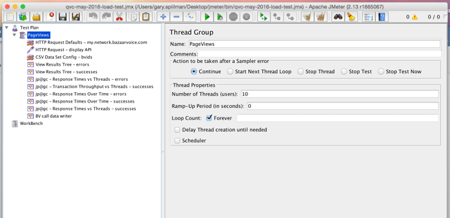
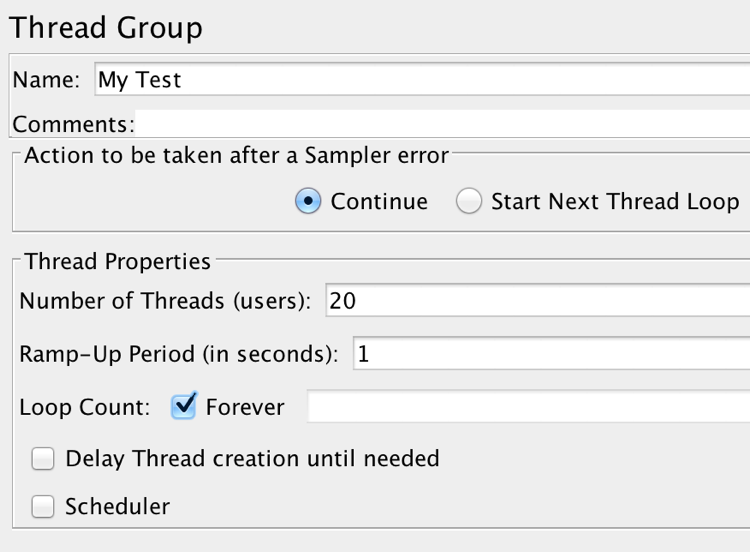
3. Enter a name for the thread group (e.g. load test 1)
a. Set the number of threads option to the maximum desired number of requests you want to field         to the API per second (simultaneously)
b. Set the ramp-up period option to the number of seconds you wish the test to take before it                 reaches the maximum number of threads set above (e.g. setting thread count to 100 and the             ramp-up to 60 will start the test with 1 thread and add an additional thread per second. After 1           minute, the test will be at a maximum of 100 concurrent requests per second).
c. Set the Loop option for the number of cycles of maximum requests you wish the test to repeat           once it reaches is maximum number of threads. Once this loop finishes, the test will end.
d. Check the forever option if you wish the test to continue to execute at its max thread count                 indefinitely. Note – this will require you to manually shut the test down.

jm2

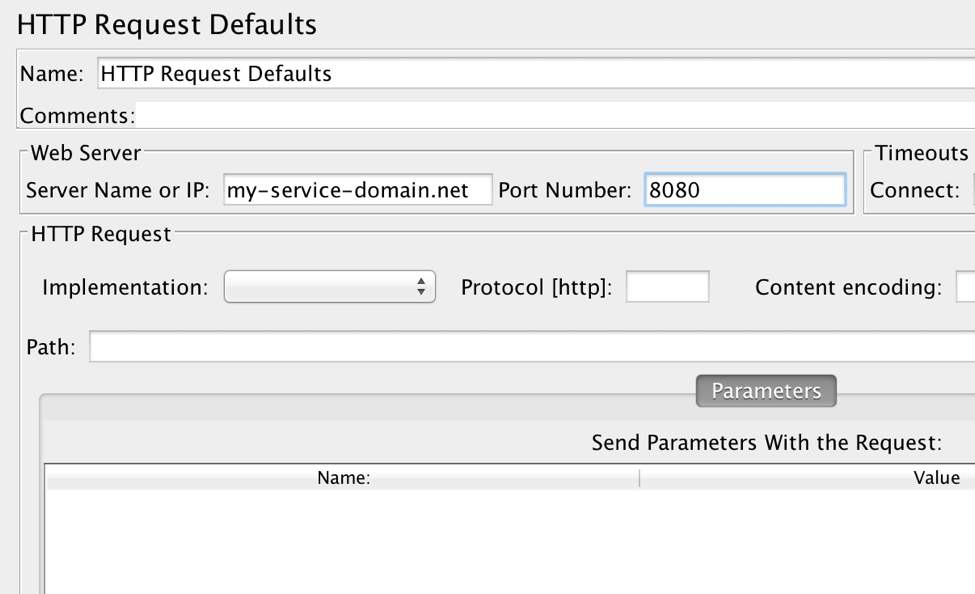
4. Right click on the Thread Group and select Add > Config Element > HTTP Request Defaults
5. Set the Server Name or IP Address (and optionally the Port) fields to the domain/IP/port your             service can be reached at (e.g. http://my.network.bazaarvoice.com)

jm3

Now we’re ready to program our test – using the options in the HTTP Request element, we’ll construct what we want each request per each thread to contain.

1. Right click on the thread group and select Add > Sampler > HTTP Request
2. In the HTTP Request config panel, set the implementation to HTTPClient 4
3. Set your protocol (http or https) and your method type (in this place, GET)
4. Set the path option to the endpoint you wish to send your request to – do not include any HTTP         arguments (e.g. /path/sub-path1/sub-path2/endpoint)
5. Next, we’ll configure each and every HTTP argument we need to pass within our request.
6. Do this by clicking into the first line of the send parameters table.
7. Enter your first argument name into the name field, the value into the value field, click the include       equals option and, if need be, click the encode option if your argument value needs to be HTTP         encoded.
8. Click Add and repeat this process for each key-value pair you need to send with your request

jm4
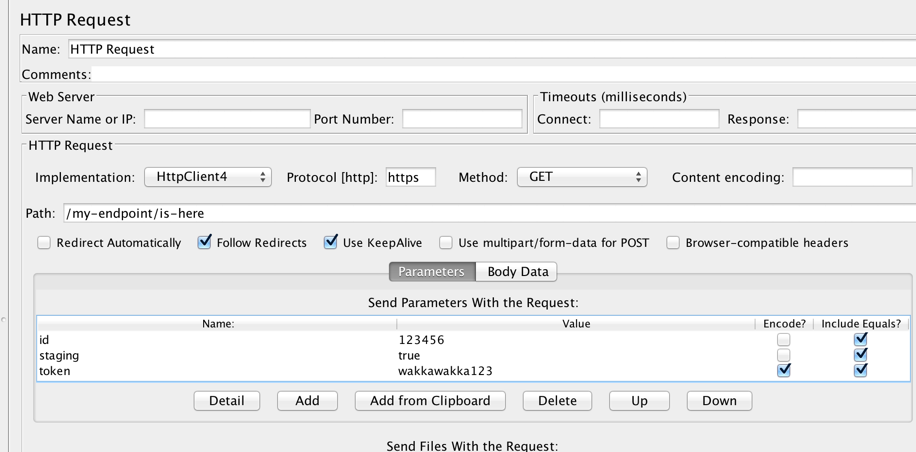
 Your HTTP Request sampler should look something like this.

Now would be a good time to save your test!

leo
 Don’t be this man

Adding Listeners:

Next, we need to add listeners (JMeter-speak for report generators) in order to report our findings during and after the load test.

Right click on the thread group and select Add > Listeners > and then pick your choice of listener.

The choice of test listeners is quite deep, especially if you installed the reporting add ons as noted above. You can configure whatever listeners you feel you need, though here some you may want to add to your test:

View Results Tree – This listener will tabulate each request response it receives during the test as well as collect its response type, headers and content. I highly recommend configuring two of these listeners and assigning 1 for successes and 1 for failures. This will help sort your response types, allow you to debug your tests in case of authentication errors, malformed requests or troubleshoot issues if your API should suddenly start returning 500 errors.

Response Times Vs Threads – If you’re configuring your test to ramp up its load over time, this listener will provide a chart which you can use to measure the responsiveness of your API over time as the request load is increased. Again, I recommend configuring multiple instances of this listener – one to record requests and another to record error latency if you choose to use this listener.

Response Times Over Time – If your test is being configured to provide a constant load over a period of time, this listener can help chart performance of the API based on a steady load over time. It’s helpful in helping to spot issues such as inadequate load balancing or rate limiting of your requests depending on if your service architecture is really aggressive when it comes to that aspect (cough, cough – load balancers – cough).

jm5
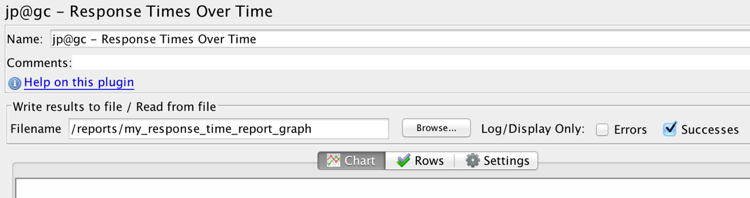
 Example of response time over time graph setup (successful responses only)

Now would be another great time to save your progress.

Kicking off a Test:

OK – the moment you’ve been waiting for (be honest). Let’s kick this pig and bask in the glory of our performant API!

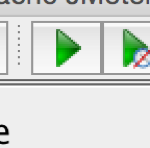
Click the big, green button to start the test. Note on the upper right hand side of the JMeter UI, you’ll have an indicator showing the number of threads currently running (out of the total max to ramp up to) as well as an indicator of any warnings or errors being thrown).

jm6
 GO!

Click on the Results Tree listener to view a table of your responses. If you’re seeing errors, click on an error instance in the results tree to view the error type, body and content.

jm7
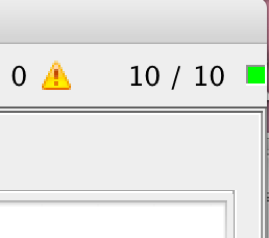
 10 out of 10 threads running, no exceptions

Once you’re ready to stop a test, click the big, red, X icon to shut the test down.
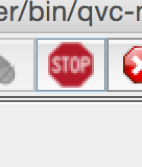
jm8
 STOP!

Modifying a Test:

You’re probably thinking, “Hey, that was easy and oh look! Our test results are coming in and they look pretty good. There’s got to be more to it than this”. …And you would be right. Remember that comment about load balancers above? Well, in most modern web service architectures, you’ll encounter some form of load balancing whether it’s part of the web server’s features or an intermediary. In our case, Mashery would have cached our static request after a few seconds at maximum load. After that, we weren’t even talking to the API directly, rather, Mashery simply sent us the cached response for the request. Our results in Jmeter may have looked good but it was lying to us.

khaled

Fortunately, JMeter allows us to inject some form of randomness into our requests to circumvent this issue.

One way of accomplishing this is to invoke a randomized ID into your HTTP arguments – especially if your API accepts a random, serialized load ID as an argument. Here’s how you can do that:

1. Right click on the thread group and select Add > Config Elements > Random Variable

jm9

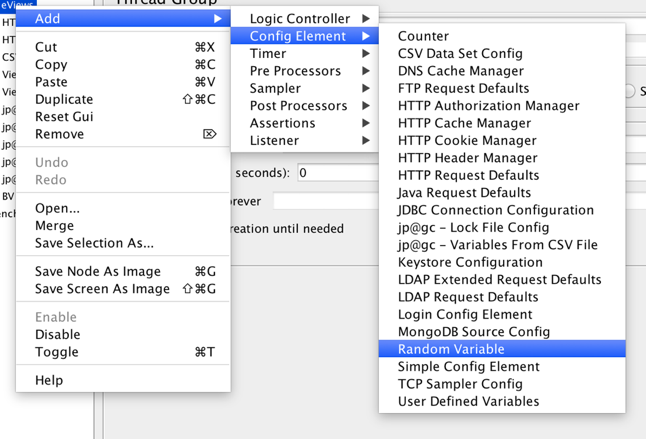
2. On the Random Variable config screen, set a value for in the variable name field (e.g.                         my_random_id)
3. Set a minimum and maximum value to define the range your random variable will take (e.g. 1000       and 9999)

jm10

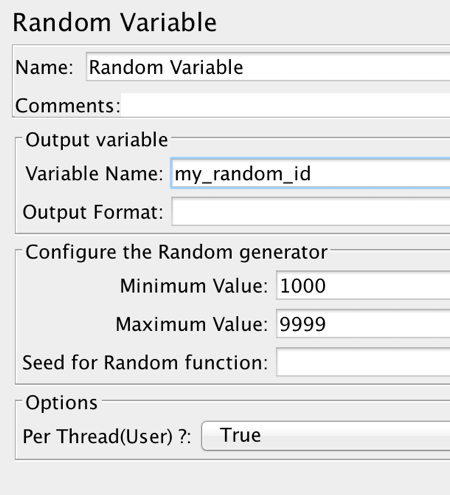
4. Set the Per Thread option to true (this will ensure a random value will be set for each thread.

vegita
 And this joke is over plaaaaaaaaaaayed!!!!

5. Next, we’ll need to click on the HTTP Sampler and include our newly added random variable to         our test. Let’s assume our API accepts an argument called ‘loadId’ which corresponds to a                 random, 5-digit number.

6. In this case, click on the Send Parameters table and add a new key value pair with the name set       to ‘loadId’ and the value set to ‘{$my_random_id}’ (or whatever you’ve named your variable in the       config element screen.

jm11

One of the requirements of our load test request is that we must provide a specific profile ID that relates to a profile to be returned by the API. For our purposes, we exported a list of existing IDs (over 90,000) from the Cassandra database our API reads from and writes to, imported that into our JMeter test and instructed the HTTP Request sampler to randomly grab an ID and include it as the argument for every individual request.

We configured this by doing the following:

1. Right click on the thread group and select Add > Config Element > CSV Data Set Config

jm12

2. In the CSV data set config options, set the file name option to the path to your CSV file that                 contains your working data
3. In the variable name field, provide a name for which the test sampler will refer to each instance of       your data as (e.g. myRandomID)
4. Enter ‘,’ into the delimiter option field
5. Set the Recycle on EoF to true, Stop on EoF to false and Sharing Mode to All Threads

jm13

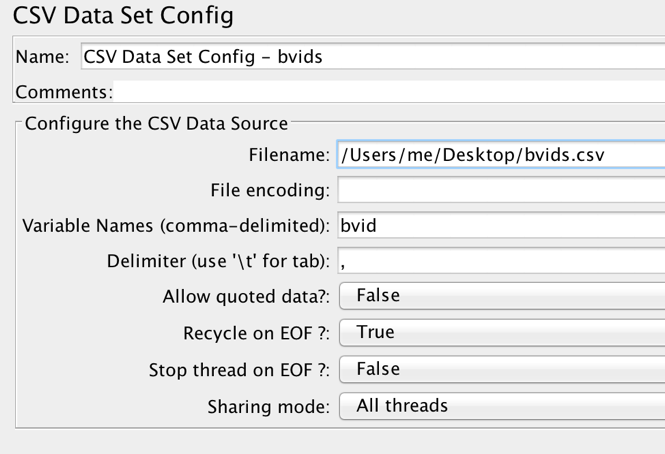
This last set of options will ensure that if the test cycles through all elements in your CSV (which it will use for each and every thread) it will simply start back at the top of the list.

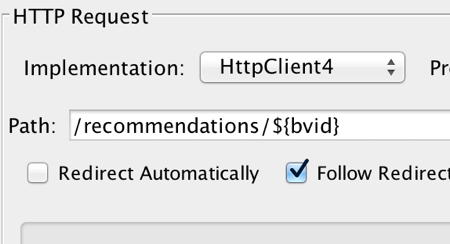
Next, click on your HTTP Sampler. Here you will need to add a bash script style variable to the sampler in order for it to automatically pull the shared data variable from your CSV config element (e.g. if you named your variable in the CSV config element to “myRandomID” you need to inject the value {$myRandomID} into the listener somewhere. This will depend on the nature of your API. In our case, we simply appended this to our API endpoint, setting the ID variable to be called between the API domain/endpoint call and the HTTP arguments in the URI.

jm14

Yup – good time to save your game – I mean test. After that…

giphy-1
 Ratta-tat-tat yo!

Reading Results:

We’ve gone over how to build and run a performance test but once the test has concluded and you have gathered results, you need to understand what you’re looking at.

To view the results of a particular listener, just click on it in the JMeter UI.

The Results Tree reports are self-explanatory but what about the other reports? In particular, lets look at the Threads Over Time listener. Here is the graph output for this listener from our initial performance test:

3-15-16-load-test-2
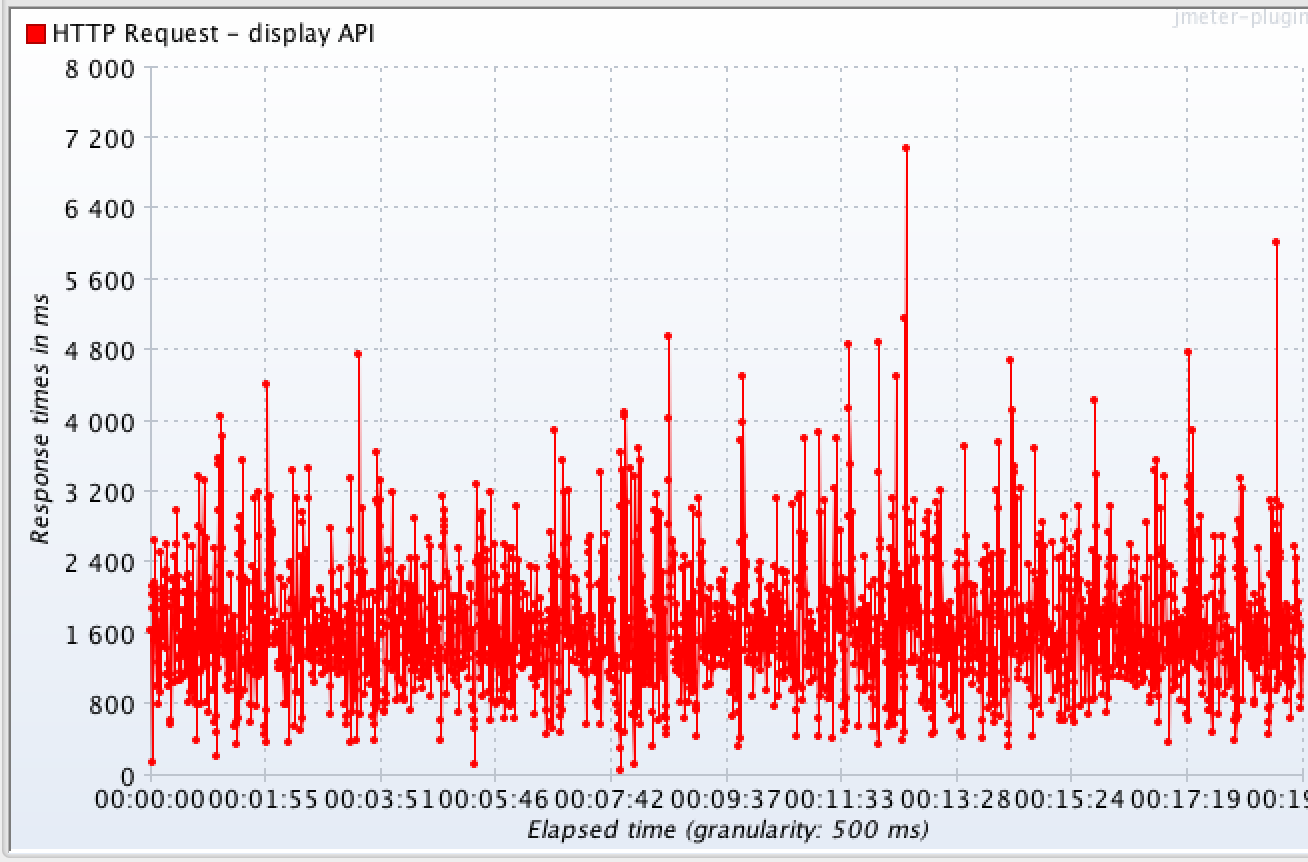
 Average response time for successful requests – 1.6 seconds

This listener was configured to only measure time per successful request in order to obtain more focused results. In the graph you can see that over time, there was a great deal of variance with the majority of requests taking around 1.6 seconds to resolve. Note the highest and lowest points on the graph – these are the outlining deviations for test results as opposed to the concentrated area of red (the average time per request).

Generally speaking, the tighter the graph, the more consistent the API’s performance and of course, the lower the average number, the faster the performance.

Large spikes with pronounced peaks and valleys usually indicate there is an issue with the service’s load balancing features or something “mechanical” getting in the way of the test.

Long periods of plateauing are another indicator to watch for. These may indicate some form of rate limiting or timeout.

Caveats and Next Steps:

Now you’re ready to send off your newly minted beast of a load test to go show that MCP who’s boss. Before you go and press that button – some advice.

On Test Performance:

JMeter is a great tool and all – especially for the price you pay but it is old and not necessarily the most high-performance perf testing tool out there (oh the irony). When launching tests off your local machine or a server – keep in mind that each thread you configure for your test will be another thread your CPU will need to handle. You can quickly and easily create a test that will test your local environments to its limit. Doing so can, at times, crash you test (and dump your results into the ether – engage sad panda face). Start with a small-to-medium performance load and build up from there.

5679299

Starting and Stopping a Test:

When stopping a test, manually or automatically, you might notice a sudden uptick in errors and latency at the very end of the test (and possibly at the beginning as well). This is normal behavior – when a test is started and stopped you can experience some level of thread abandonment (which JMeter will record as an error because those last requests never receive proper responses). These errors can be ignored when viewing results.

Basically, the test results are kind of like a loaf of bread – no one wants the ends.

bread


One of life's great mysteries

A Word of Caution:

JMeter is basically a multi-threaded web request generator and manager. The traffic patterns it generates can resemble those seen during a DoS attack – especially for very large tests. If there are any internal or external web security policies in place within the network you’re testing, be careful as to not set these off (i.e. just because you can run a test on a production server that sends 400,000 simultaneous requests to a google web service – which then gets your whole office IP range banned from said service – doesn’t mean you should and no, the author of this piece has absolutely no knowledge of any similar event ever happening, ever…).

From Latency to Where?

The above performance graph was from the very first performance test against our internal Shopper Marketing recommendations API. Utilizing the test, its results and monitoring tools like DataDog we were able to find where we needed to improve our service from both the code base as well as hosting environment to reach our performance goal.

After several repeated tests along with re-provisioning new Elastic Search clusters and a lot of code refactoring, we eventually arrived at the following test result:

perftestfinal


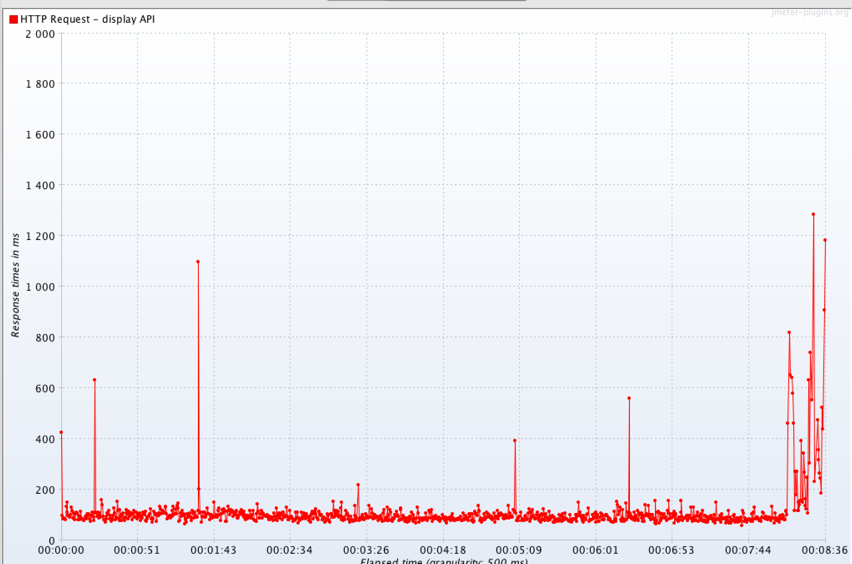
Average response time for successful requests – 100 milliseconds

From and average response rate of 1.6 seconds to 100 milliseconds is a pretty big leap in performance. Ultimately, our client was pretty happy with our answer.

This is by no means an exhaustive method of load testing but merely a way of doing quick and easy exploratory testing that delivered a good deal of value for our team.

Have fun testing!

Conversations API Deprecation for Versions 5.2 and 5.3

Today we are announcing an important change to our Conversations API service:

  • On April 30, 2017 service will end for Conversations API versions 5.2 and 5.3

By deprecating older versions of our API service, we can refocus our energies on the current and future API services, which we feel offer the most benefits to our customers. Please visit our Upgrade Guide to learn more about the Conversations API, our API versioning, and the steps necessary to support the upgrade.

We understand that this change will require effort on your part. Bazaarvoice is committed to making this transition easy for you. We are prepared to assist you in a number of ways:

  • Pre-notification: You have more than 12 months to plan for and implement the change.
  • Documentation: We have specific documentation to help you.
  • Support: Our support team is ready to address any questions you may have.
  • Services: Our services teams are available to provide additional assistance.

In summary, on April 30, 2017, Conversations API versions released before 5.4 will no longer be available. Applications and websites using versions before 5.4 will no longer function properly after April 30, 2017. If your custom application or website is making API calls to Conversations API versions 5.2 or 5.3 you will need to upgrade to the current Conversations API (5.4). Applications using Conversations API versions 5.4 and later will continue to receive uninterrupted API service.

If you have any questions about this notice, please submit a case in Spark. We will periodically update this blog and our developer Twitter feed (@BazaarvoiceDev) as we move closer to the change of service date.

Visit the following page Coversations API 2017 Deprecation to learn more.

Thank you for your partnership,
Chris Kauffman
Manager, Product Management

What does a data scientist do?

More and more companies and industries are grappling with the challenges of extracting value from large amounts of data. Data scientists, the people whose job it is to overcome these challenges, are becoming more prominent, yet what it is they do, and how they’re different than software engineers, is still a mystery to a lot of people. The goal of this article is to explain one of the most important tools that data scientists use: machine learning (ML). The bottom-line is: using ML is slow, costly, and error-prone, but it allows companies to achieve business objectives that are unattainable any other way.

Just like a software engineer, the goal of a data scientist is to develop programs that perform business functions. In software engineering, the engineer writes a program that encodes all of the “rules” for what the program is supposed to do, based on the requirements. For example, take the task of returning all of the product reviews for a given product ID. The rules here include things like how to make sure the product ID is valid (and what to do when it’s not), how to query a database of reviews with the product ID, and how to format the reviews to be returned. A reasonably skilled software engineer can easily write a program that encodes all of these rules.

However, there are many problems where it is not feasible for anyone to write down all of the rules required for a software program to perform some task. Sometimes this is because the rules are simply not known, and other times it’s because there are way too many rules. Several good example of the latter type come from natural language processing (NLP), like the problem of predicting the sentiment of movie reviews (i.e. did the reviewer like the movie or not?). Like nearly all NLP problems, this is something that a human could do reasonably well, but it doesn’t mean that a person could easily write down a set of rules for how they made their decisions. If you had to, you’d probably start by listing key words or phrases that would indicate the reviewer’s sentiment, like “great”, “liked”, “smash hit”, “boring” and “terrible”, and use their appearance in a review to judge the sentiment. This will only work so far, because language is much more complex than that. You’d need additional rules to get around the fact that many of the key words can mean different things in different contexts, more rules to cover all of they ways that you can express sentiment without using a key word, and even more rules to detect when sentiment gets flipped by a negating phrase. Add to this the fact that people don’t actually write in perfect English, and you’d end up with a seemingly endless list of rules and an impossible software engineering problem.

ML has completely different approach: instead of writing out the rules in a top-down fashion, ML attempts to infer the rules in a bottom-up way, from data. For the problem of predicting the sentiment of movie reviews, you’d take a set of movie reviews with the actual sentiment of each, and feed them into a ML program. This ML program then literally outputs another program that takes in a movie review and outputs a prediction of its sentiment (with some expected accuracy). One reason that ML can work (not perfectly) on NLP problems is because where a human would have a very hard time creating millions and millions of rules, a computer has no such limitation.

Of course, there are a few catches to using ML. First, the data is not always cheap. Sentiment analysis of movie reviews has been popular topic only because many movie reviews online come with ratings (usually on a scale of 1 to 5), which tell you the answer — the term for this in ML is “ground truth”. For many problems, the ground truth is not readily available and can be very costly to figure it out. A recent Kaggle competition on this topic used a dataset of 50,000 movie reviews — imagine needing to read every single one of these to determine the ground truth sentiment.

Another catch, which I’ve already mentioned, is that ML will rarely produce a program with perfect accuracy. This is because for most real-world problems, it’s impossible to provide the ML program with all of the relevant information. For NLP problems, humans have a wealth of knowledge about what words mean, while computers do not. Many other real-world problems involve predicting human behavior, but it’s impossible to observe everything that’s going on in people’s heads. While ML algorithms are designed to make the most out of limited information, they’re only viable as a solution when the business objectives can tolerate some amount of error.

ML solutions are also slow to develop, even more so than standard software engineering solutions. As mentioned earlier, ML solutions need to work with limited information, which means that it’s impossible to know whether ML will meet the business’s requirements beforehand. Effective data scientists will make educated guesses about the data, ML algorithms, and algorithm parameters that are most likely to succeed based on the problem, but experimentation is always required. This can mean multiple iterations refining the data, algorithms, and parameters before a definitive answer can be reached about whether an ML solution will work.

Last, ML solutions in production are costly to maintain. Their performance needs to be continuously monitored, because their performance can change over time as the characteristics of the data they’re analyzing changes. In the case of predicting the sentiment of movie reviews, just changes in writing style could drop the accuracy significantly. Processes and instrumentation are required to evaluate a statistically significant sample of the solution’s predictions, and take actions to improve performance whenever it drops such as creating a new program using newer data.

I hope this de-mystifies some of what data scientists do, and explains one of the important tools they use to extract value from large amounts of data.

Holiday season preparation

Preparing for the Holiday season is a year round task for all of us here at Bazaarvoice.  This year we saw many retailers extending their seasonal in-store specials to their websites as well. We also saw retailers going as far as closing physical stores on Thanksgiving (Nordstrom, Costco, Home Depot, etc.) and Black Friday (REI).  Regardless of which of the above strategies were taken,  the one common theme amongst retailers  was the increase in online sales.

This trend is not new. Online sales are catching up to in stores sales (http://www.usnews.com/news/business/articles/2015/11/28/black-friday-store-sales-fall-as-americans-buy-more-online) over the holiday season.  Along with the demand in online sales was the increase in demand on the Bazaarvoice network.

So here are just a few of the metrics that the Bazaarvoice network saw in the busiest week of online shopping:

blog_unique_visitors

Unique Visitors throughout 2013-2015

blog_impressions

Pageviews and Impressions 2013-2015

So how does the Bazzarvoice team prepare the Holiday Season?

As soon as the online traffic settles from the peak levels, the R&D team begins preparing for the next  year’s Holiday Season.  First by looking back at the numbers and how we did as a team through various retrospectives. Taking inventory of what went well and what we can improve upon for the next year. Before you know it the team gets together in June to being preparations for the next years efforts. I want to touch on just a few of the key areas the team focused on this past year to prepare for a successful Holiday Season:

  1. Client communication
  2. Disaster Recovery
  3. Load/Performance Testing
  4. Freeze Plan

Client Communication

One key improvement this year was client communication both between R&D and other internal teams as well as externally to clients. This was identified as an area we could improve from last year.  Internally a response communication plan was developed. This plan makes sure that key representatives in R&D and support teams were on call at all times and everyone understands escalation paths and procedures should an issue occur. It was then the responsibility of the  on call representative to communicate any needs with the different engineers and client support staff. The on call period lasted from November 24th to Tuesday December the 1st.

A small focused team was identified for creation and delivery of all client communication.  As early as August, “Holiday Preparedness” communications were delivered to clients informing them of our service level objectives. Monthly client communications followed containing load target calculations, freeze plans, disaster recover preparations, as well as instructions on how to contact Bazaarvoice in the event of an issue as well as how we would communicate current status of our network during this critical holiday season.

Internally there was also an increased emphasis on the creation and evaluation of runbooks. Runbooks are ‘play by play’ instructions which engineers should carry out for different scenarios. The collection of procedures and operations were vital in the teams disaster recovery planning.

Disaster Recovery

To improve our operational excellence, we needed to ensure our teams were conducting exploratory disaster scenario testing to know for certain how our apps/service behaved and improve our Dev Ops code, monitoring/alerting, runbooks, etc.  Documenting the procedures was completed in the late summer.  That quickly moved into evaluating our assumptions and correcting where necessary.

All teams were responsible for:

  • documentation the test plan
  • documentation of the results
  • capture the MTTR (mean time to recovery) when appropriate

Sign off was required for all test plans and results shared amongst the teams.  We also executed a full set of Disaster Recovery scenarios and performed additional Green Flag fire drills to ensure all systems and personnel were prepared for any contingencies during the holiday season.

Load/Performance Testing

For an added layer of insurance, we pre scaled our environment ahead of the anticipated holiday load profile.  Analysis of 3 years of previous holiday traffic showed a predictable increase of approximately 2.5x the highest load average over the past 10 months. For this holiday season we tested at 4x the highest load average over that time period to ensure we were covered. The load test allowed the team to test beyond expected target traffic profile to ensure all systems would execute above expected levels.

Load testing initially was isolated per each system.  Conducting tests in such environment helped quickly identify any failure points. As satisfactory results were obtain, complexities were introduced by running systems in tandem. This simulated a environments more representative of what would be encountered in the holiday season.

One benefit experienced through this testing was the identification and evaluation of other key metrics to ensure the systems are operating and performing successfully. Also, a predictive model was created to evaluate our expected results.  The accuracy of the daily model was within 5% of the expected daily results and overall, for the 2015 season, was within 3%. This new model will be a essential tool when preparing for the next holiday season.

Freeze Plan

Once again, we locked down the code prior to the holiday season. Limiting the number of ‘moving parts’ and throughly testing the code in place increased our confidence that we would not experience any major issues.  As the image below demonstrates, two critical time periods were identified:

  • critical change freeze – code change to be introduced only if sites were down.
  • general change freeze – priority one bug fixes were accepted. Additional risk assessments performed on all changes.

As you can see the critical times coincide with the times we see increased online traffic.

blog_change_freeze

Summary

A substantial amount of the work was all completed in the months prior to Black Friday and Cyber Monday. The team’s coordinated efforts prior to the holiday season ensured that our client’s online operations ran smoothly.  Over half of the year was spent ensuring performance and scalability for these critical times in the holiday season.  Data, as far back as three years, was also used to predict web traffic forecasts and ensure we would scale appropriately. This metric perspective also provided new insightful models to be used in future year’s forecasts.

The preparation paid off, and Bazaarvoice was able to handle 8.398 Billion impressions over Black Friday thru Cyber Monday (11/27-11/30), a new record for the our network.

BVIO 2015 Summary and Presentations

Every year Bazaarvoice R&D throws BVIO, an internal technical conference followed by a two-day hackathon. These conferences are an opportunity for us to focus on unlocking the power of our network, data, APIs, and platforms as well as have some fun in the process. We invite keynote speakers from within BV, from companies who use our data in inspiring ways, and from companies who are successfully using big data to solve cool problems. After a full day of learning we engage in an intense, two-day hackathon to create new applications, visualizations, and insights into our extensive our data.

Continue reading for pictures of the event and videos of the presentations.

bvio-logo

This year we held the conference at the palatial Omni Barton Creek Resort in one of their well-appointed ballrooms.

omni

Participants arrived around 9am (some of us a little later). After breakfast, provided by Bazaarvoice, we got started with the speakers followed by lunch, also provided by Bazaarvoice, followed by more speakers.

bvio2015_presentation2 bvio2015_presentation

After the speakers came a “pitchfest” during which our Product team presented hackathon ideas and participants started forming teams and brainstorming.

bvio2015_bigidea bvio2015_bigidea2

Finally it was time for 48 hours of hacking, eating, and gaming (not necessarily in that order) culminating in project presentations and prizes.

bvio2015_hacking bvio2015_hacking2 bvio2015_gaming bvio2015_eating bvio2015_demo bvio2015_demo2

Presentations

Sephora: Consumer Targeted Content

Venkat Gopalan
Director of Architecture & Devops @ Sephora.com

Venkat presented on the work Sephora is doing around serving relevant, targeted content to their consumers in both the mobile and in-store space. It was a fascinating speech and we love to see our how our clients are innovating with us. Unfortunately due to technical difficulties we don’t have a recording 🙁

Philosophy & Design of The BV System of Record

John Roesler & Fahd Siddiqui
Bazaarvoice Engineers

This talk was about the overarching design of Bazaarvoice’s innovative data architecture. According to them there are aspects to it that may seem unexpected at first glance (especially not coming from a big data background), but are actually surprisingly powerful. The first innovation is the separation of storage and query, and the second is choosing a knowledge-base-inspired data model. By making these two choices, we guarantee that our data infrastructure will be robust and durable.

Realtime Bidding: Predicting the future, 10,000 times per second

Ian Clarke
Co-Founder and CTO at OneSpot

Ian has built and manages a team of world-class software engineers as well as data scientists at OneSpot™s. In his presentation he discusses how he applied machine learning and game theory to architect a sophisticated realtime bidding engine for OneSpot™ capable of predicting the behavior of tens of thousands of people per second.

New Amazon Machine Learning and Lambda architectures

Jeff Nun
Amazon Solutions Architect

In his presentation Jeff discusses the history of Amazon Machine Learning and the Lambda architecture, how Amazon uses it and you can use it. This isn’t just a presentation; Ian walks us through the AWS UI for building and training a model.

Thanks to Sharon Hasting, Dan Heberden, and the presenters for contributing to this post.

Partner Integrations: Do’s and Don’ts

In this blog post , a Senior Product Manager on our Product team, discusses challenges to building and maintaining technical partnerships between organizations as well as provides advice on how to overcome those challenges.

Every company comes to a point, early or late, where it realizes that it must partner with other companies to drive value in the market. Partnerships always start with conversations, handshakes, and NDAs. At some point, unlocking the value of partnership may hinge upon establishing a formal integration between the two companies. These integrations constitute a technical “bridge” between companies. They can unlock otherwise inaccessible value, allow for one company to OEM the other, and/or can accelerate work that otherwise is “re-invented” each time the companies engage each other.

Integrations can be amazing vehicles to create value that only comes from combining capabilities from separate entities, while simultaneously allowing each entity to focus on what each one does best. They can be the perfect manifestation of the all too often promised “complimentary” value. Integrations can offer consistency, repeatability, and reduced friction in the activities involved in unlocking that value.

Unfortunately, integrations are often approached in manner in which all parties involved are not setup for success. Why?

Integrations aren’t just some “code.” They are product. They require an organized effort to build, including technical staff and non-technical staff to build (engineers, architects, project manager, product manager, partnership manager). They require support, assigned owners, subject matter experts, marketing, documentation, and proper roadmap vision. Integrations demand the same attention and focus that any first class “product” requires.

Integrations require both more and different types of communication. Because the value of the integration is typically not front-and-center to the core value of each org, there must be additional effort to communicate the existence of the integration and the value it brings within each org. Sales, onboarding support, post-live support organizations all need ways to communicate with the other integrated party (who calls who when something stops working?). The two product organizations must communicate ahead of any changes to dependent technologies such as APIs. A classic communication gap happens when one entity changes their APIs and doesn’t let the other party know soon enough or not at all. Problems are only discovered when something breaks.

Integrations are usually birthed by the wrong part of the org. The challenge with integrations is that the impetus to create them usually originates from one or both of the company’s business development/partnerships team – a group that typically has little appreciation for the discipline of product management. Their priority is on “relationships” that historically focus on non-technical efforts. Additionally, the ADD-like attention span of most partnerships teams results in a great desire to create an “integration” with a partner for marketing and sales-driven reasons, but very little attention, effort, and commitment to the long-term requirements of a properly supported product. It is quite easy to just stop communicating with a partner who is no longer deemed valuable, but such an about-face cannot be made when an integration is in place with paying customers. Most often, partnerships orgs do not have technical resources within their structure, but rather rely on borrowing technical resources from wherever they can be found (“Hey, I have a partner company who just trying to do this thing, and they have a quick technical question…”). This is a great approach for proof-of-concept initiatives, but certainly not for something that companies/customers must trust to deliver value. The product organizations at each company must be responsible for bringing an integration to life. Regardless of whether the product org has enough resources to service an integration like a first-class product citizen, at least the owner will have an understanding of what is and isn’t getting handled properly and can mitigate the potentially negative outcomes that arise from under-served products.

Correctly structured incentives are crucial to the short and long-term success of integrations. There must be something in it for all concerned parties. Direct compensation and rev share are two good options. You should be cautious of such benefits as “stickiness” (as in, the assumption that giving an integration free-of-charge to an existing customer makes that customer less likely to debook your core service) or the halo effect associated with integrating with a company (i.e. “Do you know we’re integrated with Facebook?”). Many integrations have been built on the promise of return. Once that promise begins to fade (from any one or more of the parties), so does the motivation of the affected party to keep up their end of the technical bargain. The technology world’s version of “he’s just not that into you (anymore).” Once an integration is no longer properly attended to from one party, the integration becomes a liability. It’s not enough for the bridge to be secured to just one side of the river.

People love to build stuff. But, they hate to support it. There must be something in it for the platform to properly prioritize integration maintenance efforts. Be wary of agreements that lack commitments, SLAs, etc. (often termed that they will do any needed work within the bounds of “best efforts”) as these agreements allow the company responsible for the integration (“code”) to elect to not invest in the support and roadmap development, should their interest wane. If the agreement lacks commitments, then the partnership will likely as well. They will acknowledge the maintenance effort, but it will always get pushed to the next dev cycle. Which leads us to…

The Challenge of Opportunity Cost

The assumption here is that these companies contemplating an integration are predominantly product organizations. Their company mandate is to bring products to market at scale. This is dramatically different than a service organization who essentially trades dollars for hours.
This means that the cost of the technical/engineering effort at a product organization is different than that of a service organization. Not in that engineers get paid more at product organizations, but rather the additional opportunity cost of engineering effort at a product organization often introduces an impossibly high hurdle rate for putting those engineers on non-core “integration work.” Even just the existence of opportunity cost, albeit uncalculated, is all that a dissenting product or engineering leader needs to de-prioritize seemingly less important “integration work” that doesn’t deliver core value.

One innovative approach to solve this dilemma is to use outsourced engineering resources from a service organization to avoid the challenges that comes with opportunity cost. It makes good business sense: let your in-house engineering staff concentrate on doing things that drive core value at scale. The downside of this approach is that there is a very clear and visible cost (hrs * hourly rate) that is attached to all effort associated with the integration. A similar cost analysis is rarely thought about when utilizing internal resources, so the integration product manager should be prepared. Getting things done is always more expensive than you thought.

Of course, another solution is to simply make integration work of the same perceived class of value as that of the core product org’s core solution. However, as we describe above, this can be a big challenge.

The technical approach must be at the convergence of correctly structured incentives and technical viability. How open or closed a platform is can dictate how an integration can be executed. The associated partnership incentive structure can dictate how an integration should be executed. The resulting integration will result from the intersection of these two perspectives.

Closed platforms force the work on that platform. Open platforms allow for more options – either or both entities, possibly even a third-party, can contribute to the integration development.

Let’s look at a few scenarios.

Scenario 1: B is a “closed” platform

b_is_closed_platform

“Closed” here means that the platform does not allow for integration (read: code) to be hosted by that platform and that the platform does not have externally accessible APIs to utilize from outside the platform. The closed platform may have internally accessible APIs, but those do an external party little good.

Closed platforms force that platform to do the integration work. Thus, there must be incentives for the closed platform to both build and support the integration long-term. The effort to build the integration is often simply the result of the opportunistic convergence of both parties being sold on (at least) the promise of value and some available engineering capacity within the close platform. Without the proper incentives for platform B, this becomes a classic example of the issue of the Challenge of Opportunity Cost, discussed above. The engineer who had some free time to build the integration is suddenly no longer available to fix a bug or build a new feature. There must be motivation in some form to continue to maintain the integrity of the integration.

Scenario 2: B is open

b_is_open_platform

Open platforms present more options. In scenario 2, B is no longer the only entity who can develop the integration. A, B, or a third-party org can build the integration. There are more alternative incentive structures as well. Since the engineering effort can be executed by a non-B entity, there doesn’t need to be much in it for B (there can be, but it is not near the necessity). There will certainly need to be knowledge of the B platform (documentation, sandboxes, API keys, deployment directions, etc.) on the part of the developing entity, but this effort on the part of B has a much lower hurdle rate than that which is required to get something into B’s engineering roadmap. Typically, B will have some form of partner “program” by where such assets and knowledge are available for a predetermined fee. Even in absence of such a program, the needs are significantly less than if the development effort required engineers from platform B to do the build work.

Scenario 3: Middle-ware Solution

middleware_solution

Scenario 3 is just a derivative of Scenario 2. Options are abundant. A, B, or a third-party can build the integration. In most cases, any of those entities can bring the integration to market. A major decision will be how and where to host the middle-ware solution and how to provide production-ready support, specifically beyond the initial build phase (which can just leverage cloud hosting services like Amazon, etc. to quickly get up and running). The trade-off is that such a middle-man solution removes any challenges that come with the need to host the integration within the B platform, which can range from simple plug-n-play effort to per-instance customizations required for each integration incarnation.

Incentive options are very similar to Scenario 2. One exception is that there is a clear opportunity for a third-party to bring the integration to market with an associated price tag.

Summary

Integrations are powerful and often hugely valuable, but their success is directly tied the ability to structure them for the long-term. Integrations are a special kind of “product” requiring different types of communication and can benefit from the use of outsourced resources to execute and maintain.

A successful integration is the result of a technical and non-technical relationship that is structured in a way that provides benefit to both parties that can adequately compensate for the often underestimated level of involvement required across both organizations.

Automating a Git Rebase Workflow

When I started on the Firebird team at Bazaarvoice, I was happy to learn that they host their code on GitHub and review and land changes via pull requests. I was less happy to learn that they merged pull requests with the big green button. I was able to convince the team to try out a new, rebase-oriented, workflow that keeps the mainline branch linear and clean. While the new workflow was a hit with the team, it was much more complicated than just clicking a button, so I automated the workflow with a simple git extension, git land, which we have released as an open source tool.

What’s Wrong With the Big Green Button?

The big green button is the “Merge pull request” button that GitHub provides to merge pull requests. Clicking it prompts the user to enter a commit message (or accept a default provided by GitHub) and then confirm the merge. When the user confirms the merge, the pull request branch is merged using the –no-ff option, which always creates a merge commit. Finally, GitHub closes the pull request.

For example, given a master branch like this:

git log of an example master branch with three commits

An example master branch


…and a feature branch that diverges from the second commit:

An example feature branch started from the second commit

A feature branch started from the second commit


…this is the result of doing a –no-ff merge:

The result of merging the examples with the --no-ff option

The result of merging the examples with the –no-ff option. Note that the third commit on master is interleaved with the merge commit and the feature branch commits.


Merging with the big green button is frowned upon by many; for detailed discussions of why this is, see Isaac Z. Schlueter and Benjamin Sandofsky. In addition to the problems with merge commits that Isaac and Benjamin point out, the big green button has another downside: it merges the pull request without an opportunity to squash commits or otherwise clean up the branch.

This causes a couple of problems. First, because only the pull request author can clean up the PR branch, merging often became a tedious and drawn out process as reviewers cajoled the author to update their branch to a state that would keep `master`’s history relatively clean. Worse, sometimes messy pull requests were hastily or mistakenly merged.

As a result, the team was encouraged to keep their pull requests squashed into one or two clean commits at all times. This solved one problem, but introduced another: when an author responds to comments by pushing up a new version of the pull request, the latest changes are squashed together into one or two commits. As a result, reviewers had to hunt through the entire diff to ensure that their comments were fully addressed.

An Alternate Workflow

After some lively discussion, the team adopted a new workflow centered on fast-forward merging squashed and rebased pull request branches. Developers create topic branches and pull requests as before, but when updating their pull request, they never squash commits. This preserves detailed history of the changes the author makes in response to review feedback.

When the PR is ready to be merged, the merger interactively rebases it on the latest master, squashes it down to one or two commits, and does a fast-forward merge. The result is a clean, linear, and atomic history for `master`.

The result of merging the example feature branch into master by rebasing and doing a --ff-only merge

The result of merging the example feature branch into master using the described workflow.

One hiccup is that GitHub can’t easily tell that the rebased and squashed commit contains the changes in the pull request, so it doesn’t close the PR automatically. Fortunately, GitHub will close pull requests that contain special keywords. So, the merger has a final task: adding “[closes #<PR number>]” to one of the squashed commit’s message.

git-land

The biggest downside to the new workflow is that it transformed merging a PR from a simple operation (pushing a button) to a somewhat tricky multi-step process:

  • update local master to latest from upstream
  • check out pull request branch
  • do an interactive rebase on top of master, squashing down to one or two commits
  • add “[closes #<PR number>]” to the last commit message for the most recent squashed commit
  • do a fast-forward merge of the pull request branch into master
  • push local master to upstream

This process was too lengthy and error-prone to be reliable unless automated. To address this problem, I created a simple git extension: git-land. The Firebird team has been using this tool for a little over a year with very few problems. In fact, it has spread to other teams at Bazaarvoice. We are excited to release it as an open source tool for the public to use.

Front End Application Testing with Image Recognition

One of the many challenges of software testing has always been cross-browser testing. Despite the web’s overall move to more standards compliant browser platforms, we still struggle with the fact that sometimes certain CSS values or certain JavaScript operations don’t translate well in some browsers (cough, cough IE 8).

In this post, I’m going to show how the Curations team has upgraded their existing automation tools to allow for us to automate spot checking the visual display of the Curations front end across multiple browsers in order to save us time while helping to build a better product for our clients.

The Problem: How to save time and test all the things

The Curations front end is a highly configurable product that allows our clients to implement the display of moderated UGC made available through the API from a Curations instance.

This flexibility combined with BV’s browser support guidelines means there are a very large number ways Curations content can be rendered on the web.

Initially, rather than attempt to test ‘all the things’, we’ve codified a set of possible configurations that represent general usage patterns of how Curations is implemented. Functionally, we can test that content can be retrieved and displayed however, when it comes whether that the end result has the right look-n-feel in Chrome, Firefox and other browsers, our testing of this is largely manual (and time consuming).

How can we better automate this process without sacrificing consistency or stability in testing?

Our solution: Sikuli API

Sikuli is an open-source Java-based application and API that allows users to automate web, mobile and OS applications across multiple platforms using image recognition. It’s platform based and not browser specific, so it enables us to circumvent limitations with screen capture and compare features in other automation tools like Webdriver.

Imagine writing a test script that starts with clicking the home button within an iOS simulator, simply by providing the script a .png of the home button itself. That’s what Sikuli can do.

You can read more about Sikuli here. You can check out their project here on github.

Installation:

Sikuli provides two different products for your automation needs – their stand-alone scripting engine and their API. For our purposes, we’re interested in the Sikuli API with the goal to implement it within our existing Saladhands test framework, which uses both Webdriver and Cucumber.

Assuming you have Java 1.6 or greater installed on your workstation, from Sikuli.org’s download page, follow the link to their standalone setup JAR

http://www.sikuli.org/download.html

Download the JAR file and place it in your local workstation’s home directory, then open it.

Here, you’ll be prompted by the installer to select an installation type. Select option 3 if wish to use Sikuli in your Java or Jython project as well as have access to its command line options. Select option 4 if you only plan on using Sikuli within the scope of your Java or Jython project.

Once the installation is complete, you should have a sikuli.jar file in your working directory. You will want to add this to your collection of external JARs for your installed JRE.

For example, if you’re using Eclipse, go to Preferences > Java > Installed JREs, select your JRE version, click Edit and add Sikuli.jar to the collection.

Alternately, if you are using Maven to build your project, you can add Sikuli’s API to your project by adding the following to your POM.XML file:

<dependency>
    <groupId>org.sikuli</groupId>
    <artifactId>sikuli-api</artifactId>
    <version>1.2.0</version>
</dependency>

Clean then build your project and now you’re ready to roll.

Implementation:

Ultimately, we wanted a method we could control using Cucumber that allows us to articulate a web application using Webdriver that could take a screen shot of a web application (in this case, an instance of Curations) and compare it to a static screen shot of specific web elements (e.g. Ratings and Review stars within the Curations display).

This test method would then make an assumption that either we could find a match to the static screen element within the live web application or have TestNG throw an exception (test failure) if no match could be found.

First, now that we have the ability to use Sikuli, we created a new helper class that instantiates an object from their API so we can compare screen output.

import org.sikuli.api.*;
import java.io.IOException;
import java.io.File;
/**
* Created by gary.spillman on 4/9/15.
*/
public class SikuliHelper {

public boolean screenMatch(String targetPath) {
new ImageTarget(new File(targetPath));

Once we import the Sikuli API, we create a simple class with a single class method. In this case, screenMatch is going to accept a path within the Java project relative to a static image we are going to compare against the live browser window. True or false will be returned depending on if we have a match or not.

//Sets the screen region Sikuli will try to match to full screen
ScreenRegion fullScreen = new DesktopScreenRegion();

//Set your taret to compare from
Target target = new ImageTarget(new File(targetPath));

The main object type Sikuli wants to handle everything with is ScreenRegion. In this case, we are instantiating a new screen region relative to the entire desktop screen area of whatever OS our project will run on. Without passing any arguments to DesktopScreenRegion(), we will be defining the region’s dimension as the entire viewable area of our screen.

double fuzzPercent = .9;

try {
    fuzzPercent = Double.parseDouble(PropertyLoader.loadProperty(&quot;fuzz.factor&quot;));
}
catch (IOException e) {
    e.printStackTrace();
}
new ImageTarget(new File(targetPath));

Sikuli allows you to define a fuzzing factor (if you’ve ever used ImageMagick, this should be a familiar concept). Essentially, rather than defining a 1:1 exact match, you can define a minimal acceptable percentage you wish your screen comparison to match. For Sikuli, you can define this within a range from 0.1 to 1 (ie 10% match up to 100% match).

Here we are defining a default minimum match (or fuzz factor) of 90%. Additionally, we load in from a set of properties in Saladhand’s test.properties file a value which, if present can override the default 90% match – should we wish to increase or decrease the severity of test criteria.

target.setMinScore(fuzzPercent);
new ImageTarget(new File(targetPath));

Now that we know what fuzzing percentage we want to test with, we use target’s setMinScore method to set that property.

ScreenRegion found = fullScreen.find(target);

//According to code examples, if the image isn't found, the screen region is undefined
//So... if it remains null at this point, we're assuming there's no match.

if(found == null) {
    return false;
}
else {
    return true;
}
new ImageTarget(new File(targetPath));

This is where the magic happens. We create a new screen region called found. We then define that using fullScreen’s find method, providing the path to the image file we will use as comparison (target).

What happens here is that Sikuli will take the provided image (target) and attempt to locate any instance within the current visible screen that matches target, within the lower bound of the fuzzing percentage we set and up to a full, 100% match.

The find method either returns a new screen region object, or returns nothing. Thus, if we are unable to find a match to the file relative to target, found will remain undefined (null). So in this case, we simply return false if found is null (no match) or true of found is assigned a new screen region (we had a match).

Putting it all together:

To completely incorporate this behavior into our test framework, we write a simple cucumber step definition that allows us to call our Sikuli helper method, and provide a local image file as an argument for which to compare it against the current, active screen.

Here’s what the cucumber step looks like:

public class ScreenShotSteps {

    SikuliHelper sk = new SikuliHelper();

    //Given the image &quot;X&quot; can be found on the screen
    @Given(&quot;^the image \&quot;([^\&quot;]*)\&quot; can be found on the screen$&quot;)
    public void the_image_can_be_found_on_the_screen(String arg1) {

        String screenShotDir=null;

        try {
            screenShotDir = PropertyLoader.loadProperty(&quot;screenshot.path&quot;).toString();
        }
        catch (IOException e) {
            e.printStackTrace();
        }

        Assert.assertTrue(sk.screenMatch(screenShotDir + arg1));
    }
    new ImageTarget(new File(targetPath));
}

We’re referring to the image file via regex. The step definition makes an assertion using TestNG that the value returned from our instance of SikuliHelper’s screen match method is true (Success!!!). If not, TestNG throws an exception and our test will be marked as having failed.

Finally, since we already have cucumber steps that let us invoke and direct Webdriver to a live site, we can write a test that looks like the following:

Feature: Screen Shot Test
As a QA tester
I want to do screen compares
So I can be a boss ass QA tester

Scenario: Find the nav element on BV's home page
Given I visit &quot;http://www.bazaarvoice.com&quot;
Then the image &quot;screentest1.png&quot; can be found on the screen
new ImageTarget(new File(targetPath));

In this case, the image we are attempting to find is a portion of the nav element on BV’s home page:

screentest1

Considerations:

This is not a full-stop solution to cross browser UI testing. Instead, we want to use Sikuli and tools like it to reduce overall manual testing as much as possible (as reasonably as possible) by giving the option to pre-warn product development teams of UI discrepancies. This can help us make better decisions on how to organize and allocate testing resources – manual and otherwise.

There are caveats to using Sikuli. The most explicit caveat is that tests designed with it cannot run heedlessly – the test tool requires a real, actual screen to capture and manipulate.

Obviously, the other possible drawback is the required maintenance of local image files you will need to check into your automation project as test artifacts. How deep you will be able to go with this type of testing may be tempered by how large of a file collection you will be able to reasonably maintain or deploy.

Despite that, Sikuli seems to have a large number of powerful features, not limited to being able to provide some level of mobile device testing. Check out the project repository and documentation to see how you might be able to incorporate similar automation code into your project today.