Category Archives: Uncategorized

Front End Application Testing with Image Recognition

One of the many challenges of software testing has always been cross-browser testing. Despite the web’s overall move to more standards compliant browser platforms, we still struggle with the fact that sometimes certain CSS values or certain JavaScript operations don’t translate well in some browsers (cough, cough IE 8).

In this post, I’m going to show how the Curations team has upgraded their existing automation tools to allow for us to automate spot checking the visual display of the Curations front end across multiple browsers in order to save us time while helping to build a better product for our clients.

The Problem: How to save time and test all the things

The Curations front end is a highly configurable product that allows our clients to implement the display of moderated UGC made available through the API from a Curations instance.

This flexibility combined with BV’s browser support guidelines means there are a very large number ways Curations content can be rendered on the web.

Initially, rather than attempt to test ‘all the things’, we’ve codified a set of possible configurations that represent general usage patterns of how Curations is implemented. Functionally, we can test that content can be retrieved and displayed however, when it comes whether that the end result has the right look-n-feel in Chrome, Firefox and other browsers, our testing of this is largely manual (and time consuming).

How can we better automate this process without sacrificing consistency or stability in testing?

Our solution: Sikuli API

Sikuli is an open-source Java-based application and API that allows users to automate web, mobile and OS applications across multiple platforms using image recognition. It’s platform based and not browser specific, so it enables us to circumvent limitations with screen capture and compare features in other automation tools like Webdriver.

Imagine writing a test script that starts with clicking the home button within an iOS simulator, simply by providing the script a .png of the home button itself. That’s what Sikuli can do.

You can read more about Sikuli here. You can check out their project here on github.

Installation:

Sikuli provides two different products for your automation needs – their stand-alone scripting engine and their API. For our purposes, we’re interested in the Sikuli API with the goal to implement it within our existing Saladhands test framework, which uses both Webdriver and Cucumber.

Assuming you have Java 1.6 or greater installed on your workstation, from Sikuli.org’s download page, follow the link to their standalone setup JAR

http://www.sikuli.org/download.html

Download the JAR file and place it in your local workstation’s home directory, then open it.

Here, you’ll be prompted by the installer to select an installation type. Select option 3 if wish to use Sikuli in your Java or Jython project as well as have access to its command line options. Select option 4 if you only plan on using Sikuli within the scope of your Java or Jython project.

Once the installation is complete, you should have a sikuli.jar file in your working directory. You will want to add this to your collection of external JARs for your installed JRE.

For example, if you’re using Eclipse, go to Preferences > Java > Installed JREs, select your JRE version, click Edit and add Sikuli.jar to the collection.

Alternately, if you are using Maven to build your project, you can add Sikuli’s API to your project by adding the following to your POM.XML file:

<dependency>
    <groupId>org.sikuli</groupId>
    <artifactId>sikuli-api</artifactId>
    <version>1.2.0</version>
</dependency>

Clean then build your project and now you’re ready to roll.

Implementation:

Ultimately, we wanted a method we could control using Cucumber that allows us to articulate a web application using Webdriver that could take a screen shot of a web application (in this case, an instance of Curations) and compare it to a static screen shot of specific web elements (e.g. Ratings and Review stars within the Curations display).

This test method would then make an assumption that either we could find a match to the static screen element within the live web application or have TestNG throw an exception (test failure) if no match could be found.

First, now that we have the ability to use Sikuli, we created a new helper class that instantiates an object from their API so we can compare screen output.

import org.sikuli.api.*;
import java.io.IOException;
import java.io.File;
/**
* Created by gary.spillman on 4/9/15.
*/
public class SikuliHelper {

public boolean screenMatch(String targetPath) {
new ImageTarget(new File(targetPath));

Once we import the Sikuli API, we create a simple class with a single class method. In this case, screenMatch is going to accept a path within the Java project relative to a static image we are going to compare against the live browser window. True or false will be returned depending on if we have a match or not.

//Sets the screen region Sikuli will try to match to full screen
ScreenRegion fullScreen = new DesktopScreenRegion();

//Set your taret to compare from
Target target = new ImageTarget(new File(targetPath));

The main object type Sikuli wants to handle everything with is ScreenRegion. In this case, we are instantiating a new screen region relative to the entire desktop screen area of whatever OS our project will run on. Without passing any arguments to DesktopScreenRegion(), we will be defining the region’s dimension as the entire viewable area of our screen.

double fuzzPercent = .9;

try {
    fuzzPercent = Double.parseDouble(PropertyLoader.loadProperty(&quot;fuzz.factor&quot;));
}
catch (IOException e) {
    e.printStackTrace();
}
new ImageTarget(new File(targetPath));

Sikuli allows you to define a fuzzing factor (if you’ve ever used ImageMagick, this should be a familiar concept). Essentially, rather than defining a 1:1 exact match, you can define a minimal acceptable percentage you wish your screen comparison to match. For Sikuli, you can define this within a range from 0.1 to 1 (ie 10% match up to 100% match).

Here we are defining a default minimum match (or fuzz factor) of 90%. Additionally, we load in from a set of properties in Saladhand’s test.properties file a value which, if present can override the default 90% match – should we wish to increase or decrease the severity of test criteria.

target.setMinScore(fuzzPercent);
new ImageTarget(new File(targetPath));

Now that we know what fuzzing percentage we want to test with, we use target’s setMinScore method to set that property.

ScreenRegion found = fullScreen.find(target);

//According to code examples, if the image isn't found, the screen region is undefined
//So... if it remains null at this point, we're assuming there's no match.

if(found == null) {
    return false;
}
else {
    return true;
}
new ImageTarget(new File(targetPath));

This is where the magic happens. We create a new screen region called found. We then define that using fullScreen’s find method, providing the path to the image file we will use as comparison (target).

What happens here is that Sikuli will take the provided image (target) and attempt to locate any instance within the current visible screen that matches target, within the lower bound of the fuzzing percentage we set and up to a full, 100% match.

The find method either returns a new screen region object, or returns nothing. Thus, if we are unable to find a match to the file relative to target, found will remain undefined (null). So in this case, we simply return false if found is null (no match) or true of found is assigned a new screen region (we had a match).

Putting it all together:

To completely incorporate this behavior into our test framework, we write a simple cucumber step definition that allows us to call our Sikuli helper method, and provide a local image file as an argument for which to compare it against the current, active screen.

Here’s what the cucumber step looks like:

public class ScreenShotSteps {

    SikuliHelper sk = new SikuliHelper();

    //Given the image &quot;X&quot; can be found on the screen
    @Given(&quot;^the image \&quot;([^\&quot;]*)\&quot; can be found on the screen$&quot;)
    public void the_image_can_be_found_on_the_screen(String arg1) {

        String screenShotDir=null;

        try {
            screenShotDir = PropertyLoader.loadProperty(&quot;screenshot.path&quot;).toString();
        }
        catch (IOException e) {
            e.printStackTrace();
        }

        Assert.assertTrue(sk.screenMatch(screenShotDir + arg1));
    }
    new ImageTarget(new File(targetPath));
}

We’re referring to the image file via regex. The step definition makes an assertion using TestNG that the value returned from our instance of SikuliHelper’s screen match method is true (Success!!!). If not, TestNG throws an exception and our test will be marked as having failed.

Finally, since we already have cucumber steps that let us invoke and direct Webdriver to a live site, we can write a test that looks like the following:

Feature: Screen Shot Test
As a QA tester
I want to do screen compares
So I can be a boss ass QA tester

Scenario: Find the nav element on BV's home page
Given I visit &quot;http://www.bazaarvoice.com&quot;
Then the image &quot;screentest1.png&quot; can be found on the screen
new ImageTarget(new File(targetPath));

In this case, the image we are attempting to find is a portion of the nav element on BV’s home page:

screentest1

Considerations:

This is not a full-stop solution to cross browser UI testing. Instead, we want to use Sikuli and tools like it to reduce overall manual testing as much as possible (as reasonably as possible) by giving the option to pre-warn product development teams of UI discrepancies. This can help us make better decisions on how to organize and allocate testing resources – manual and otherwise.

There are caveats to using Sikuli. The most explicit caveat is that tests designed with it cannot run heedlessly – the test tool requires a real, actual screen to capture and manipulate.

Obviously, the other possible drawback is the required maintenance of local image files you will need to check into your automation project as test artifacts. How deep you will be able to go with this type of testing may be tempered by how large of a file collection you will be able to reasonably maintain or deploy.

Despite that, Sikuli seems to have a large number of powerful features, not limited to being able to provide some level of mobile device testing. Check out the project repository and documentation to see how you might be able to incorporate similar automation code into your project today.

Predictively Scaling EC2 Instances with Custom CloudWatch Metrics

One of the chief promises of the cloud is fast scalability, but what good is snappy scalability without load prediction to match? How many teams out there are still manually switching group sizes when load spikes? If you would like to make your Amazon EC2 scaling more predictive, less reactive and hopefully less expensive it is my intention to help you with this article.

Problem 1: AWS EC2 Autoscaling Groups can only scale in response to metrics in CloudWatch and most of the default metrics are not sufficient for predictive scaling.

For instance, by looking at the CloudWatch Namespaces reference page we can see that Amazon SQS queues, EC2 Instances and many other Amazon services post metrics to CloudWatch by default.

From SQS you get things like NumberOfMessagesSent and SentMessageSize. EC2 Instances post metrics like CPUUtilization and DiskReadOps. These metrics are helpful for monitoring. You could also use them to reactively scale your service.

The downside is that by the time you notice that you are using too much CPU or sending too few messages, you’re often too late. EC2 instances take time to start up and instances are billed by the hour, so you’re either starting to get a backlog of work while starting up or you might shut down too late to take advantage of an approaching hour boundary and get charged for a mostly unused instance hour.

More predictive scaling would start up the instances before the load became business critical or it would shut down instances when it becomes clear they are not going to be needed instead of when their workload drops to zero.

Problem 2: AWS CloudWatch default metrics are only published every 5 minutes.

In five minutes a lot can happen, with more granular metrics you could learn about your scaling needs quite a bit faster. Our team has instances that take about 10 minutes to come online, so 5 minutes can make a lot of difference to our responsiveness to changing load.

Solution 1 & 2: Publish your own CloudWatch metrics

Custom metrics can overcome both of these limitations, you can publish metrics related to your service’s needs and you can publish them much more often.

For example, one of our services runs on EC2 instances and processes messages off an SQS queue. The load profile can vary over time; some messages can be handled very quickly and some take significantly more time. It’s not sufficient to simply look at the number of messages in the queue as the average processing speed can vary between 2 and 60 messages per second depending on the data.

We prefer that all our messages be handled within 2 hours of being received. With this in mind I’ll describe the metric we publish to easily scale our EC2 instances.

ApproximateSecondsToCompleteQueue = MessagesInQueue / AverageMessageProcessRate

The metric we publish is called ApproximateSecondsToCompleteQueue. A scheduled executor on our primary instance runs every 15 seconds to calculate and publish it.

private AmazonCloudWatchClient _cloudWatchClient = new AmazonCloudWatchClient();
_cloudWatchClient.setRegion(RegionUtils.getRegion("us-east-1"));

...

PutMetricDataRequest request = new PutMetricDataRequest()
  .withNamespace(CUSTOM_SQS_NAMESPACE)
  .withMetricData(new MetricDatum()
  .withMetricName("ApproximateSecondsToCompleteQueue")
  .withDimensions(new Dimension()
                    .withName(DIMENSION_NAME)
                    .withValue(_queueName))
  .withUnit(StandardUnit.Seconds)
  .withValue(approximateSecondsToCompleteQueue));

_cloudWatchClient.putMetricData(request);

In our CloudFormation template we have a parameter calledDesiredSecondsToCompleteQueue and by default we have it set to 2 hours (7200 seconds). In the Auto Scaling Group we have a scale up action triggered by an Alarm that checks whether DesiredSecondsToCompleteQueue is less than ApproximateSecondsToCompleteQueue.

"EstimatedQueueCompleteTime" : {
  "Type": "AWS::CloudWatch::Alarm",
  "Condition": "HasScaleUp",
  "Properties": {
    "Namespace": "Custom/Namespace",
    "Dimensions": [{
      "Name": "QueueName",
      "Value": { "Fn::Join" : [ "", [ {"Ref": "Universe"}, "-event-queue" ] ] }
    }],
    "MetricName": "ApproximateSecondsToCompleteQueue",
    "Statistic": "Average",
    "ComparisonOperator": "GreaterThanThreshold",
    "Threshold": {"Ref": "DesiredSecondsToCompleteQueue"},
    "Period": "60",
    "EvaluationPeriods": "1",
    "AlarmActions" : [{
      "Ref": "ScaleUpAction"
    }]
  }
}


Visualizing the Outcome

What’s a cloud blog without some graphs? Here’s what our load and scaling looks like after implementing this custom metric and scaling. Each of the colors in the middle graph represents a service instance. The bottom graph is in minutes for readability. Note that our instances terminate themselves when there is nothing left to do.

Screen Shot 2015-04-17 at 11.37.21 AM

I hope this blog has shown you that it’s quite easy to publish your own CloudWatch metrics and scale your EC2 AutoScalingGroups accordingly.

Upgrading Dropwizard 0.6 to 0.7

At Bazaarvoice we use Dropwizard for a lot of our java based SOA services. Recently I upgraded our Dropwizard dependency from 0.6 to the newer 0.7 version on a few different services. Based on this experience I have some observations that might help any other developers attempting to do the same thing.

Package Name Change
The first change to look at is the new package naming. The new io.dropwizard package replaces com.yammer.dropwizard. If you are using codahale’s metrics library as well, you’ll need to change com.yammer.metrics to com.codahale.metrics. I found that this was a good place to start the migration: if you remove the old dependencies from your pom.xml you can start to track down all the places in your code that will need attention (if you’re using a sufficiently nosy IDE).

- com.yammer.dropwizard -> io.dropwizard
- com.yammer.dropwizard.config -> io.dropwizard.setup
- com.yammer.metrics -> com.codahale.metrics

Class Name Change
aka: where did my Services go?

Something you may notice quickly is that the Service interface is gone, it has been moved to a new name: Application.

- Service -> Application

Configuration Changes
The Configuration object hierarchy and yaml organization has also changed. The http section in yaml has moved to server with significant working differences.

Here’s an old http configuration:

http:
  port: 8080
  adminPort: 8081
  connectorType: NONBLOCKING
  requestLog:
    console:
      enabled: true
    file:
      enabled: true
      archive: false
      currentLogFilename: target/request.log

and here is a new server configuration:

server:
  applicationConnectors:
    - type: http
      port: 8080
  adminConnectors:
    - type: http
      port: 8081
  requestLog:
    appenders:
      - type: console
      - type: file
        currentLogFilename: target/request.log
        archive: true

There are at least two major things to notice here:

  1. You can create multiple connectors for either the admin or application context. You can now serve several different protocols on different ports.
  2. Logging is now appender based, and you can configure a list of appenders for the request log.

Speaking of appender-based logging, the logging configuration has changed as well.

Here is an old logging configuration:

logging:
  console:
    enabled: true
  file:
    enabled: true
    archive: false
    currentLogFilename: target/diagnostic.log
  level: INFO
  loggers:
    "org.apache.zookeeper": WARN
    "com.sun.jersey.spi.container.servlet.WebComponent": ERROR

and here is a new one:

logging:
  level: INFO
  loggers:
    "org.apache.zookeeper": WARN
    "com.sun.jersey.spi.container.servlet.WebComponent": ERROR
  appenders:
    - type: console
    - type: file
      archive: false
      currentLogFilename: target/diagnostic.log

Now that you can configure a list of logback appenders, you can write your own or get one from a library. Previously this kind of logging configuration was not possible without significant hacking.

Environment Changes
The whole environment API has been re-designed for more logical access to different components. Rather than just making calls to methods on the environment object, there are now six component specific environment objects to access.

JerseyEnvironment jersey = environment.jersey();
ServletEnvironment servlets = environment.servlets();
AdminEnvironment admin = environment.admin();
LifecycleEnvironment lifecycle = environment.lifecycle();
MetricRegistry metrics = environment.metrics();
HealthCheckRegistry healthCheckRegistry = environment.healthChecks();

AdminEnvironment extends ServletEnvironment since it’s just the admin servlet context.

By treating the environment as a collection of libraries rather than a Dropwizard monolith, fine-grained control over several configurations is now possible and the underlying components are easier to interact with.

Here is a short rundown of the changes:

Lifecycle Environment
Several common methods were moved to the lifecycle environment, and the build pattern for Executor services has changed.

0.6:

     environment.manage(uselessManaged);
     environment.addServerLifecycleListener(uselessListener);
     ExecutorService service = environment.managedExecutorService("worker-%", minPoolSize, maxPoolSize, keepAliveTime, duration);
     ExecutorServiceManager esm = new ExecutorServiceManager(service, shutdownPeriod, unit, poolname);
     ScheduledExecutorService scheduledService = environment.managedScheduledExecutorService("scheduled-worker-%", corePoolSize);

0.7:

     environment.lifecycle().manage(uselessManaged);
     environment.lifecycle().addServerLifecycleListener(uselessListener);
     ExecutorService service = environment.lifecycle().executorService("worker-%")
             .minThreads(minPoolSize)
             .maxThreads(maxPoolSize)
             .keepAliveTime(Duration.minutes(keepAliveTime))
             .build();
     ExecutorServiceManager esm = new ExecutorServiceManager(service, Duration.seconds(shutdownPeriod), poolname);
     ScheduledExecutorService scheduledExecutorService = environment.lifecycle().scheduledExecutorService("scheduled-worker-%")
             .threads(corePoolSize)
             .build();

Other Miscellaneous Environment Changes
Here are a few more common environment configuration methods that have changed:

0.6

environment.addResource(Dropwizard6Resource.class);

environment.addHealthCheck(new DeadlockHealthCheck());

environment.addFilter(new LoggerContextFilter(), "/loggedpath");

environment.addServlet(PingServlet.class, "/ping");

0.7

environment.jersey().register(Dropwizard7Resource.class);

environment.healthChecks().register("deadlock-healthcheck", new ThreadDeadlockHealthCheck());

environment.servlets().addFilter("loggedContextFilter", new LoggerContextFilter()).addMappingForUrlPatterns(EnumSet.allOf(DispatcherType.class), true, "/loggedpath");

environment.servlets().addServlet("ping", PingServlet.class).addMapping("/ping");

Object Mapper Access

It can be useful to access the objectMapper for configuration and testing purposes.

0.6

ObjectMapper objectMapper = bootstrap.getObjectMapperFactory().build();

0.7

ObjectMapper objectMapper = bootstrap.getObjectMapper();

HttpConfiguration
This has changed a lot, it is much more configurable and not quite as simple as before.
0.6

HttpConfiguration httpConfiguration = configuration.getHttpConfiguration();
int applicationPort = httpConfiguration.getPort();

0.7

HttpConnectorFactory httpConnectorFactory = (HttpConnectorFactory) ((DefaultServerFactory) configuration.getServerFactory()).getApplicationConnectors().get(0);
int applicationPort = httpConnectorFactory.getPort();

Test Changes
The functionality provided by extending ResourceTest has been moved to ResourceTestRule.
0.6

import com.yammer.dropwizard.testing.ResourceTest;

public class Dropwizard6ServiceResourceTest extends ResourceTest {
  @Override
  protected void setUpResources() throws Exception {
    addResource(Dropwizard6Resource.class);
    addFeature("booleanFeature", false);
    addProperty("integerProperty", new Integer(1));
    addProvider(HelpfulServiceProvider.class);
  }
}

0.7

import io.dropwizard.testing.junit.ResourceTestRule;
import org.junit.Rule;

public class Dropwizard7ServiceResourceTest {

  @Rule
  ResourceTestRule resources = setUpResources();

  protected ResourceTestRule setUpResources() {
    return ResourceTestRule.builder()
      .addResource(Dropwizard6Resource.class)
      .addFeature("booleanFeature", false)
      .addProperty("integerProperty", new Integer(1))
      .addProvider(HelpfulServiceProvider.class)
      .build();
  }
}

Dependency Changes

Dropwizard 0.7 has new dependencies that might affect your project. I’ll go over some of the big ones that I ran into during my migrations.

Guava
Guava 18.0 has a few API changes:

  • Closeables.closeQuietly only works on objects implementing InputStream instead of anything implementing Closeable.
  • All the methods on HashCodes have been migrated to HashCode.

Metrics
Metric 3.0.2 is a pretty big revision to the old version, there is no longer a static Metrics object available as the default registry. Now MetricRegistries are instantiated objects that need to be managed by your application. Dropwizard 0.7 handles this by giving you a place to put the default registry for your application: bootstrap.getMetricRegistry().

Compatible library version changes
These libraries changed versions but required no other code changes. Some of them are changed to match Dropwizard dependencies, but are not directly used in Dropwizard.

Jackson
2.3.3

Jersey
1.18.1

Coursera Metrics-Datadog
1.0.2

Jetty
9.0.7.v20131107

Apache Curator
2.4.2

Amazon AWS SDK
1.9.21

Future Concerns
Dropwizard 0.8
The newest version of Dropwizard is now 0.8, once it is proven stable we’ll start migrating. Hopefully I’ll find time to write another post when that happens.

Thank You For Reading
I hope this article helps.

Open sourcing cloudformation-ruby-dsl

Cloudformation is a powerful tool for building large, coordinated clusters of AWS resources. It has a sophisticated API, capable of supporting many different enterprise use-cases and scaling to thousands of stacks and resources. However, there is a downside: the JSON interface for specifying a stack can be cumbersome to manipulate, especially as your organization grows and code reuse becomes more necessary.

To address this and other concerns, Bazaarvoice engineers have built cloudformation-ruby-dsl, which turns your static Cloudformation JSON into dynamic, refactorable Ruby code.

The DSL closely mimics the structure of the underlying API, but with enough syntactic sugar to make building Cloudformation stacks less painful.

We use cloudformation-ruby-dsl in many projects across Bazaarvoice. Now that it’s proven its value, and gained some degree of maturity, we are releasing it to the larger world as open source, under the Apache 2.0 license. It is still an earlier stage project, and may undergo some further refactoring prior to it’s v1.0 release, but we don’t anticipate major API changes. Please download it, try it out, and let us know what you think (in comments below, or as issues or pull request on Github).

A big thanks to Shawn Smith, Dave Barcelo, Morgan Fletcher, Csongor Gyuricza, Igor Polishchuk, Nathaniel Eliot, Jona Fenocchi, and Tony Cui, for all their contributions to the code base.

Output from bv.io

Looks like everyone had a blast at bv.io this year! Thank yous go out to the conference speakers and hackathon participants for making this year outstanding. Here are some tweets and images from the conference:

Continue reading

HTTP/RESTful API troubleshooting tools

As a developer I’ve used a variety of APIs and as a Developer Advocate at Bazaarvoice I help developers use our APIs. As a result I am keenly aware of the importance of good tools and of using the right tool for the right job. The right tool can save you time and frustration. With the recent release of the Converstations API Inspector, an inhouse web app built to help developers use our Conversations API, it seemed like the perfect time to survey tools that make using APIs easier.

The tools

This post is a survey covering several tools for interacting with HTTP based APIs. In it I introduce the tools and briefly explain how to use them. Each one has its advantages and all do some combination of the following:

  • Construct and execute HTTP requests
  • Make requests other than GET, like POST, PUT, and DELETE
  • Define HTTP headers, cookies and body data in the request
  • See the response, possibly formatted for easier reading

Firefox and Chrome

Yes a web browser can be a tool for experimenting with APIs, so long as the API request only requires basic GET operations with query string parameters. At our developer portal we embed sample URLs in our documentation were possible to make seeing examples super easy for developers.

Basic GET

http://api.example.com/resource/1?passkey=12345&apiversion=2

Some browsers don’t necessarily present the response in a format easily readable by humans. Firefox users already get nicely formatted XML. To see similarly formatted JSON there is an extension called JSONView. To see the response headers LiveHTTP Headers will do the trick. Chrome also has a version of JSONview and for XML there’s XML Tree. They both offer built in consoles that provide network information like headers and cookies.

CURL

The venerable cURL is possibly the most flexable while at the same time being the least usable. As a command line tool some developers will balk at using it, but cURL’s simplicity and portability (nix, pc, mac) make it an appealing tool. cURL can make just about any request, assuming you can figure out how. These tutorials provide some easy to follow examples and the man page has all the gory details.

I’ll cover a few common usages here.

Basic GET

Note the use of quotes.

$ curl "http://api.example.com/resource/1?passkey=12345&apiversion=2"

Basic POST

Much more useful is making POST requests. The following submits data the same as if a web form were used (default Content-Type: application/x-www-form-urlencoded). Note -d "" is the data sent in the request body.

$ curl -d "key1=some value&key2=some other value" http://api.example.com/resource/1

POST with JSON body

Many APIs expect data formatted in JSON or XML instead of encoded key=value pairs. This cURL command sends JSON in the body by using -H 'Content-Type: application/json' to set the appropriate HTTP header.

$ curl -H 'Content-Type: application/json' -d '{"key": "some value"}' http://api.example.com/resource/1

POST with a file as the body

The previous example can get unwieldy quickly as the size of your request body grows. Instead of adding the data directly to the command line you can instruct cURL to upload a file as the body. This is not the same as a “file upload.” It just tells cURL to use the contents of a file as the request body.

$ curl -H 'Content-Type: application/json' -d @myfile.json http://api.example.com/resource/1

One major drawback of cURL is that the response is displayed unformatted. The next command line tool solves that problem.

HTTPie

HTTPie is a python based command line tool similar to cURL in usage. According to the Github page “Its goal is to make CLI interaction with web services as human-friendly as possible.” This is accomplished with “simple and natural syntax” and “colorized responses.” It supports Linux, Mac OS X and Windows, JSON, uploads and custom headers among other things.

The documentation seems pretty thorough so I’ll just cover the same examples as with cURL above.

Basic GET

$ http "http://api.example.com/resource/1?passkey=12345&apiversion=2"

Basic POST

HTTPie assumes JSON as the default content type. Use --form to indicate Content-Type: application/x-www-form-urlencoded

$ http --form POST api.example.org/resource/1 key1='some value' key2='some other value'

POST with JSON body

The = is for strings and := indicates raw JSON.

$ http POST api.example.com/resource/1 key='some value' parameter2:=2 parameter3:=false parameter4:='["http", "pies"]'

POST with a file as the body

HTTPie looks for a local file to include in the body after the < symbol.

$ http POST api.example.com/resource/1 < resource.json

PostMan Chrome extension

My personal favorite is the PostMan extension for Chrome. In my opinion it hits the sweet spot between functionality and usability by providing most of the HTTP functionality needed for testing APIs via an intuitive GUI. It also offers built in support for several authentication protocols including Oath 1.0. There a few things it can’t do because of restrictions imposed by Chrome, although there is a python based proxy to get around that if necessary.

Basic GET

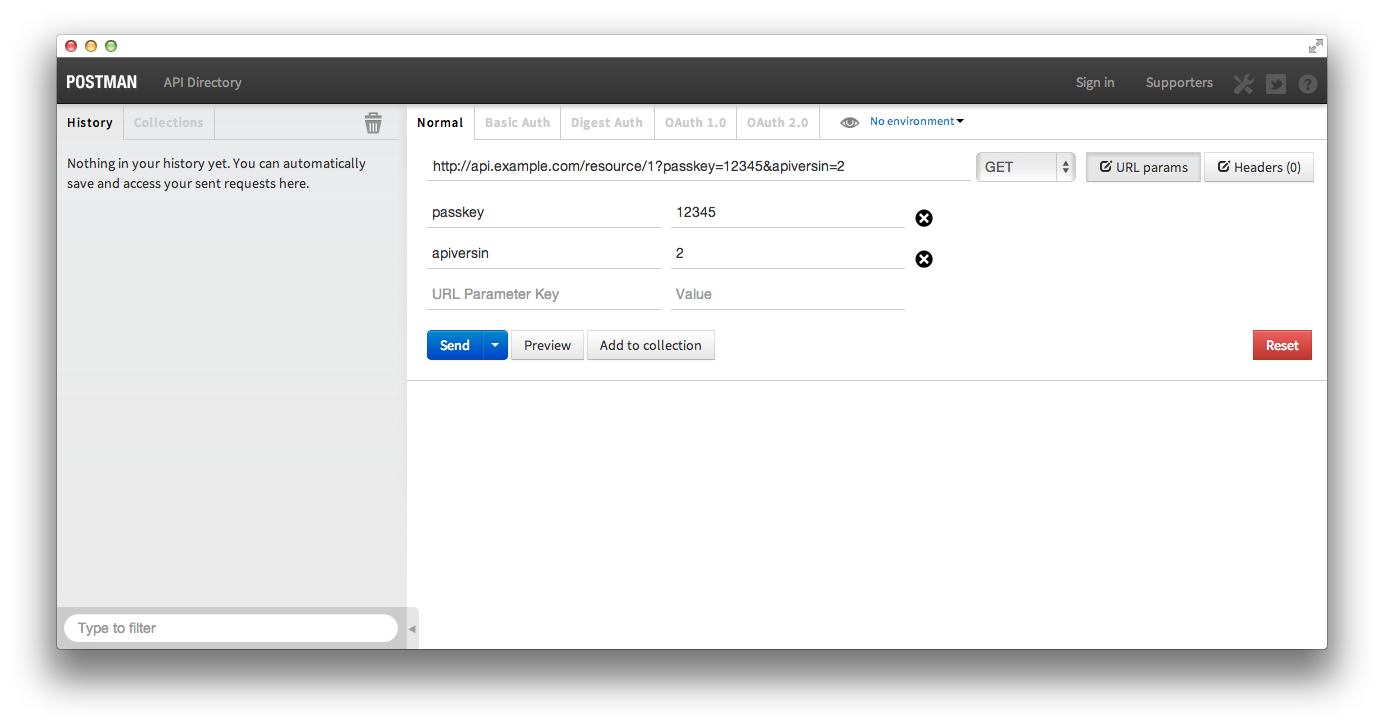
The column on the left stores recent requests so you can redo them with ease. The results of any request will be displayed in the bottom half of the right column.

postman_get

Basic POST

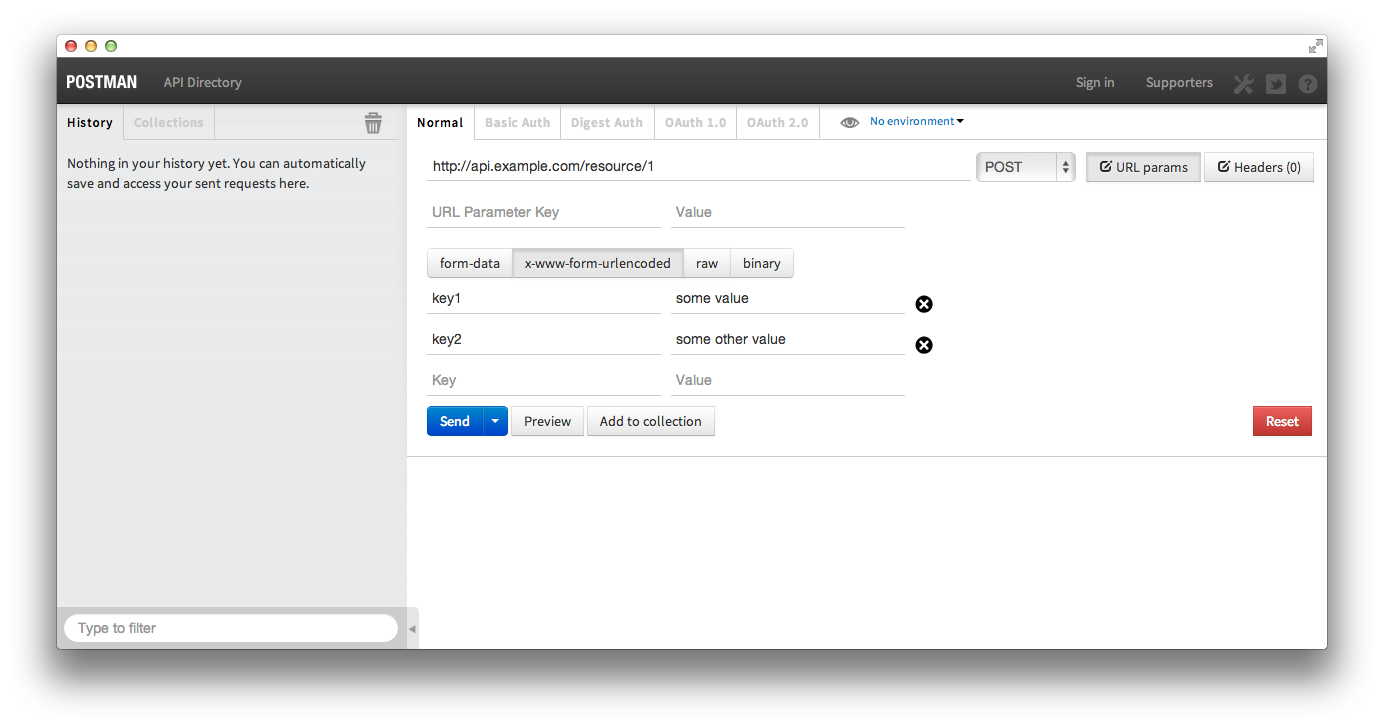
It’s possible to POST files, application/x-www-form-urlencoded, and your own raw data

postman_post

POST with JSON body

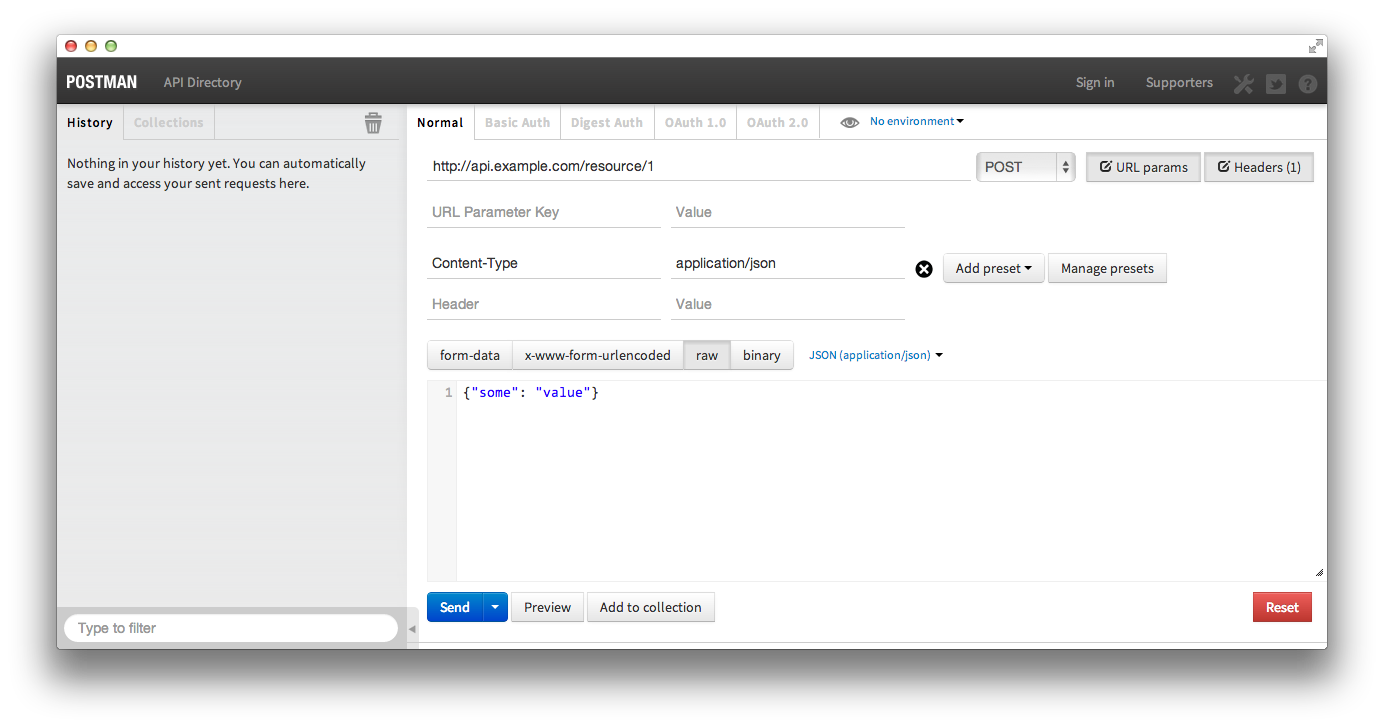
Postman doesn’t support loading a BODY from a local file, but doing so isn’t necessary thanks to its easy to use interface.

postman_post_json

RunScope.com

Runscope is a little different than the others, but no less useful. It’s a webservice instead of a tool and not open source, although they do offer a free option. It can be used much like the other tools to manually create and execute various HTTP requests, but that is not what makes it so useful.

Runscope acts a proxy for API requests. Requests are made to Runscope, which passes them on to the API provider and then passes the responses back. In the process Runscope logs the requests and responses. At that point, to use their words, “you can view the request/response details, share requests with others, edit and retry requests from the web.”

Below is a quick example of what a Runscopeified request looks like. Read their official documentation to learn more.

before: $ curl "http://api.example.com/resource/1?passkey=12345&apiversion=2"
after: $ curl "http://api-example-com-bucket_key.runscope.net/resource/1?passkey=12345&apiversion=2"

Conclusion

If you’re an API consumer you should use some or all of these tools. When I’m helping developers troubleshoot their Bazaarvoice API requests I use the browser when I can get away with it and switch to PostMan when things start to get hairy. There are other tools, I know because I omitted some of them. Feel free to mention your favorite in the comments.

(A version of this post was previously published at the author’s personal blog)

BV I/O: Nick Bailey – Cassandra

Every year Bazaarvoice holds an internal technical conference for our engineers. Each conference has a theme and as a part of these conferences we invite noted experts in fields related to the theme to give presentations. The latest conference was themed “unlocking the power of our data.” You can read more about it here.

Nick Bailey is a software developer for datastax, the company that develops commercially supported, enterprise-ready solutions based on the open source Apache Cassandra database. In his BV I/O talk he introduces Cassandra, discusses several useful approaches to data modeling and presents a couple real world use-cases.

Bazaarvoice SDK for Windows Phone 8 has been Open Sourced!

The Bazaarvoice Mobile Team is happy to announce our newest mobile SDK for Windows Phone 8. It is a .NET SDK that supports Windows Phone 8 as well as Windows 8 Store apps. This will add to our list of current open-source mobile SDKs for iOS, Android and Appcelerator Titanium.

The SDK will allow developers to more quickly build applications for Windows Phone 8 and Windows 8 Store that use the Bazaarvoice API. While the code is the same for both platforms, they each need their own compiled DLL to be used in their perspective Visual Basic projects. As Windows Phone 8 and Windows 8 Store apps gain more traction in the marketplace, we hope the Bazaarvoice SDK will prove a valuable resource to developers using our API.

Learn more at our Windows Phone 8 SDK home page, check out our repo in GitHub, and contribute!

The SDK was developed by two summer interns: Devin Carr from Texas A&M and Ralph Pina from UT-Austin. Go horns!

In the next few days we’ll publish a more in-depth post about how the Windows Phone 8 SDK was built, some of design decisions and challenges.

Interns and graduates – Keys to job search success

Bazaarvoice R&D had a great year of intensive university recruiting with 12 interns joining our teams last summer and working side-by-side with the developers on our products. We have further expanded the program this year to accommodate two co-op positions for students from the University of Waterloo. The influx of fresh ideas and additional energy from these students has been great for the whole organization!

For many students, looking for an internship or graduate employment may be their first time experiencing the interview process and creating resumes, and I’d like to offer some advice for those of you in this position. These guidelines are intended to help you think about how to present your capabilities in the best possible light, and in my experience, apply to tech interviews at most companies.

What we’re looking for

For new graduate and internship positions, it often surprises students that tech companies are, in general, less focused on them knowing specific technologies or languages. They are more focused on determining whether you have:

  • solid CS fundamentals (data structures, algorithms, etc.)
  • passion for problem-solving and software development
  • an ability to learn quickly

It is generally expected that you have confidence in at least one programming language, with a solid grip on its syntax and common usage. It is also helpful for you to demonstrate an understanding of object-oriented concepts and design but, again, this can be independent of any specific language.

Resumes

Your resume is a critical chance to sell the reader on your abilities. While it can be uncomfortable to ‘toot your own horn’ it is important that you use your resume to try to differentiate yourself from the sea of other candidates. A dry list of courses or projects is unlikely to do this, so it really is worth investing a lot of thought in expressing on the resume what was particularly interesting, important, or impressive about what you did.

  • Definitely include details of any side projects that you’ve worked on, and don’t be afraid to demo them if you get the chance (mobile apps, websites, etc.). Some students are embarrassed because they are just hobby-projects and not commercial-grade applications – this doesn’t matter!
  • Include details of anything that you are proud of, or that you did differently or better than others.
  • If you mention group/team projects be sure to make it clear what YOU did, rather than just talking about what the team did. Which bits were you responsible for?
  • Don’t emphasize anything on your resume that you are not prepared for a detailed technical discussion on. For example, if you make a point of calling out a multi-threaded, C-programming project, you should be confident talking about threading, and being able to do impromptu coding on a whiteboard using threads. We’re not expecting perfection, but are looking for a solid grasp on fundamentals and syntax.
  • Leave out cryptic course numbers – it’s unlikely that the person reading your resume knows what ‘CS252’ means, but they will understand ‘Data Structures’.
  • Make sure you have good contact info – we do occasionally see resumes with no contact info, or where the contact info had typos.

Interview technique

While an interview can be nerve-wracking, interviewers love to see people do well and are there to be supportive.

  • Coding on a whiteboard is difficult (but the interviewer knows that) – a large chunk of most technical interviews is problem-solving or coding on a whiteboard. Interviewers are very understanding that coding on a whiteboard is not easy, so don’t worry about building neat code from the outset.
  • Don’t rush to put code on the board – think about the problem, ask clarifying questions, and maybe jot a few examples down to help you get oriented.
  • Talk through what you are thinking – a large part of a technical interview is understanding how the person is thinking, even if you’re running through approaches to eliminate. Getting to an answer is only part of what the interviewer is looking for, and they want to see what your thought process is.
  • Ask for help (but not too quickly!) – it’s OK that you don’t know everything, and sometimes get stuck. If you get stuck, explain what you are stuck on and the interviewer will be prepared to guide you.
  • Use what you are familiar with – you will likely be asked to code in the language you are most comfortable with. Do it! Some students think the interviewer is ‘expecting’ them to use a certain language because it’s one we used at the hiring company, but that’s not the case.
  • Perfection is not required – while no interviewer is ever going to complain if you do everything perfectly, forgetting a little piece of syntax, or a particular library function name is not fatal. It’s more important that you write code that is easy to follow and logically reasoned through. Also remember it’s OK to ask for help if you are truly stuck. At the same time, if your syntax is way off, and you’re asking for help on every line of code then you’re probably not demonstrating the level of mastery that is expected.
  • Consider bringing a laptop if you have code to show – while the interviewer may choose to focus on whiteboard problem-solving, it is a nice option to be able to offer showing them code you’ve written. Be sure to bring your best examples; ones that show off your strengths or originality. Make sure it is code you know inside-out as you will likely be questioned in detail about why you did things a certain way.
  • Come prepared with questions for the interviewer – the interview is an opportunity for you to get to know the company in more detail, and see if it’s somewhere you’d like to work. Think about the things that are important to you, and that you’d use to decide between different employment/internship offers.

Over my career I’ve found that these rules of thumb apply well in all technical interview/application processes, and hopefully they are useful guidance for students out there. Any other advice from readers?

5 Ways to Improve Your Mobile Submission Form

Here at Bazaarvoice, we’re constantly focused on improving the user experience for our products. From the initial email invitation, to the submission form, to the way in which reviews are presented, we want to make sure that our interfaces are as flexible and intuitive as possible.

Part of my job on the mobile team at Bazaarvoice is to make sure that our products reflect best practices when displayed on mobile devices. In reality, that means running hands-on user tests, A/B testing different designs, and gathering detailed information about the way in which users interact with our products.

Recently, we ran a test with Buckle, one of our partner clients, to experiment with various mobile-friendly submission forms. What follows are some of the takeaways from those experiments.

1. Handle Landscape Mode Gracefully

It is important that users are able to navigate forms easily while in landscape mode. It becomes particularly important to support landscape for form fields that solicit text input. We found that mobile users will, on average, input about 20% fewer words in their reviews than desktop users, so the last thing we want to do is to make it even more difficult to enter text. Many users prefer to type in landscape mode as it provides for a larger keyboard.

2. Make Interactions Easy

Generally, a desktop user with a mouse can interact much more precisely than a mobile user with a clumsy finger. Therefore, it is important to make sure that elements are large enough to be either clicked or tapped. Apple recommends that tappable elements be at least 44×44 pixels. In our experimental form, we intentionally oversized our radio buttons, selection drop-downs and sliders to make the form easier to interact with and to prevent form errors.

Additionally, mobile devices provide a number of different keyboard layouts for different types of inputs. For instance, an input type of “email” might surface the @ symbol to make it more readily accessible. In order to take advantage of the various keyboard layouts, be sure to properly specify the input type on your form elements.

3. Snappy Over Flashy

The first version of our experimental form involved a heavy amount of JavaScript to do things like alpha animations and transforms. While our animations generally ran smoothly on a desktop, they became sluggish on the iPhone and lower end Android devices.

When designing for mobile, be sure to prioritize function over flashiness. Slick animations can greatly improve the usability and “wow” factor of a site, but they should be used sparingly. If necessary, use hardware-accelerated transforms to minimize sluggishness.

4. Choose The Most Efficient Form Path

Overall, our goal is to allow the user to complete our form in the quickest, simplest manner possible. In our testing, we found that a surprising number of users preferred to navigate and exit form elements via the “done” button rather than using the next/previous buttons. This has several interesting consequences.

First, short forms are better than tall forms. While some users “tab” through fields, most users scroll. By minimizing the vertical spacing between elements, users do not need to scroll as far to get to the next field.

Second, for most users, the interaction with a select element will involve 3 clicks: open, select, and done. Therefore, if a user is selecting between just a few options, it is better to use oversized radio buttons than select elements.

5. Provide Instant Feedback

If a user submits an invalid form value such as a malformed email address, provide a clear error message that instructs the user how to fix the error. If possible, provide an error near the offending field. Additionally, once the form field becomes valid, notify the user immediately rather than requiring the user to submit the form again.

For our experimental form, we used the JQuery validation library, which makes basic form validation dead simple. Since it is all client side, it makes validation snappy as well.

Our tests are ongoing, so be on the lookout for more updates soon. Until then, hopefully these insights will be valuable to others as the Internet becomes more mobile-friendly.