
Bazaarvoice notification system stands as a testament to cutting-edge technology, designed to seamlessly dispatch transactional email messages (post-interaction email or PIE) on behalf of our clients. The heartbeat of our system lies in the constant influx of new content, driven by active content solicitations. Equipped with an array of tools, including email message styling, default templates, configurable scheduling, data privacy APIs, email security/encryption, reputation/identity management, as well as auditing and reporting functionalities, our Notification system is the backbone of client-facing communications.
Let’s delve into the system’s architecture, strategically divided into two pivotal components. Firstly, the data ingestion process seamlessly incorporates transactional data from clients through manual uploads or automated transactions uploads. Secondly, the Notification system’s decision engine controls the delivery process, strategically timing email dispatches according to client configurations. Letterpress facilitates scalable email delivery to end consumers, enhancing the efficiency of the process.
Previous Obstacles: What Hindered Progress Before
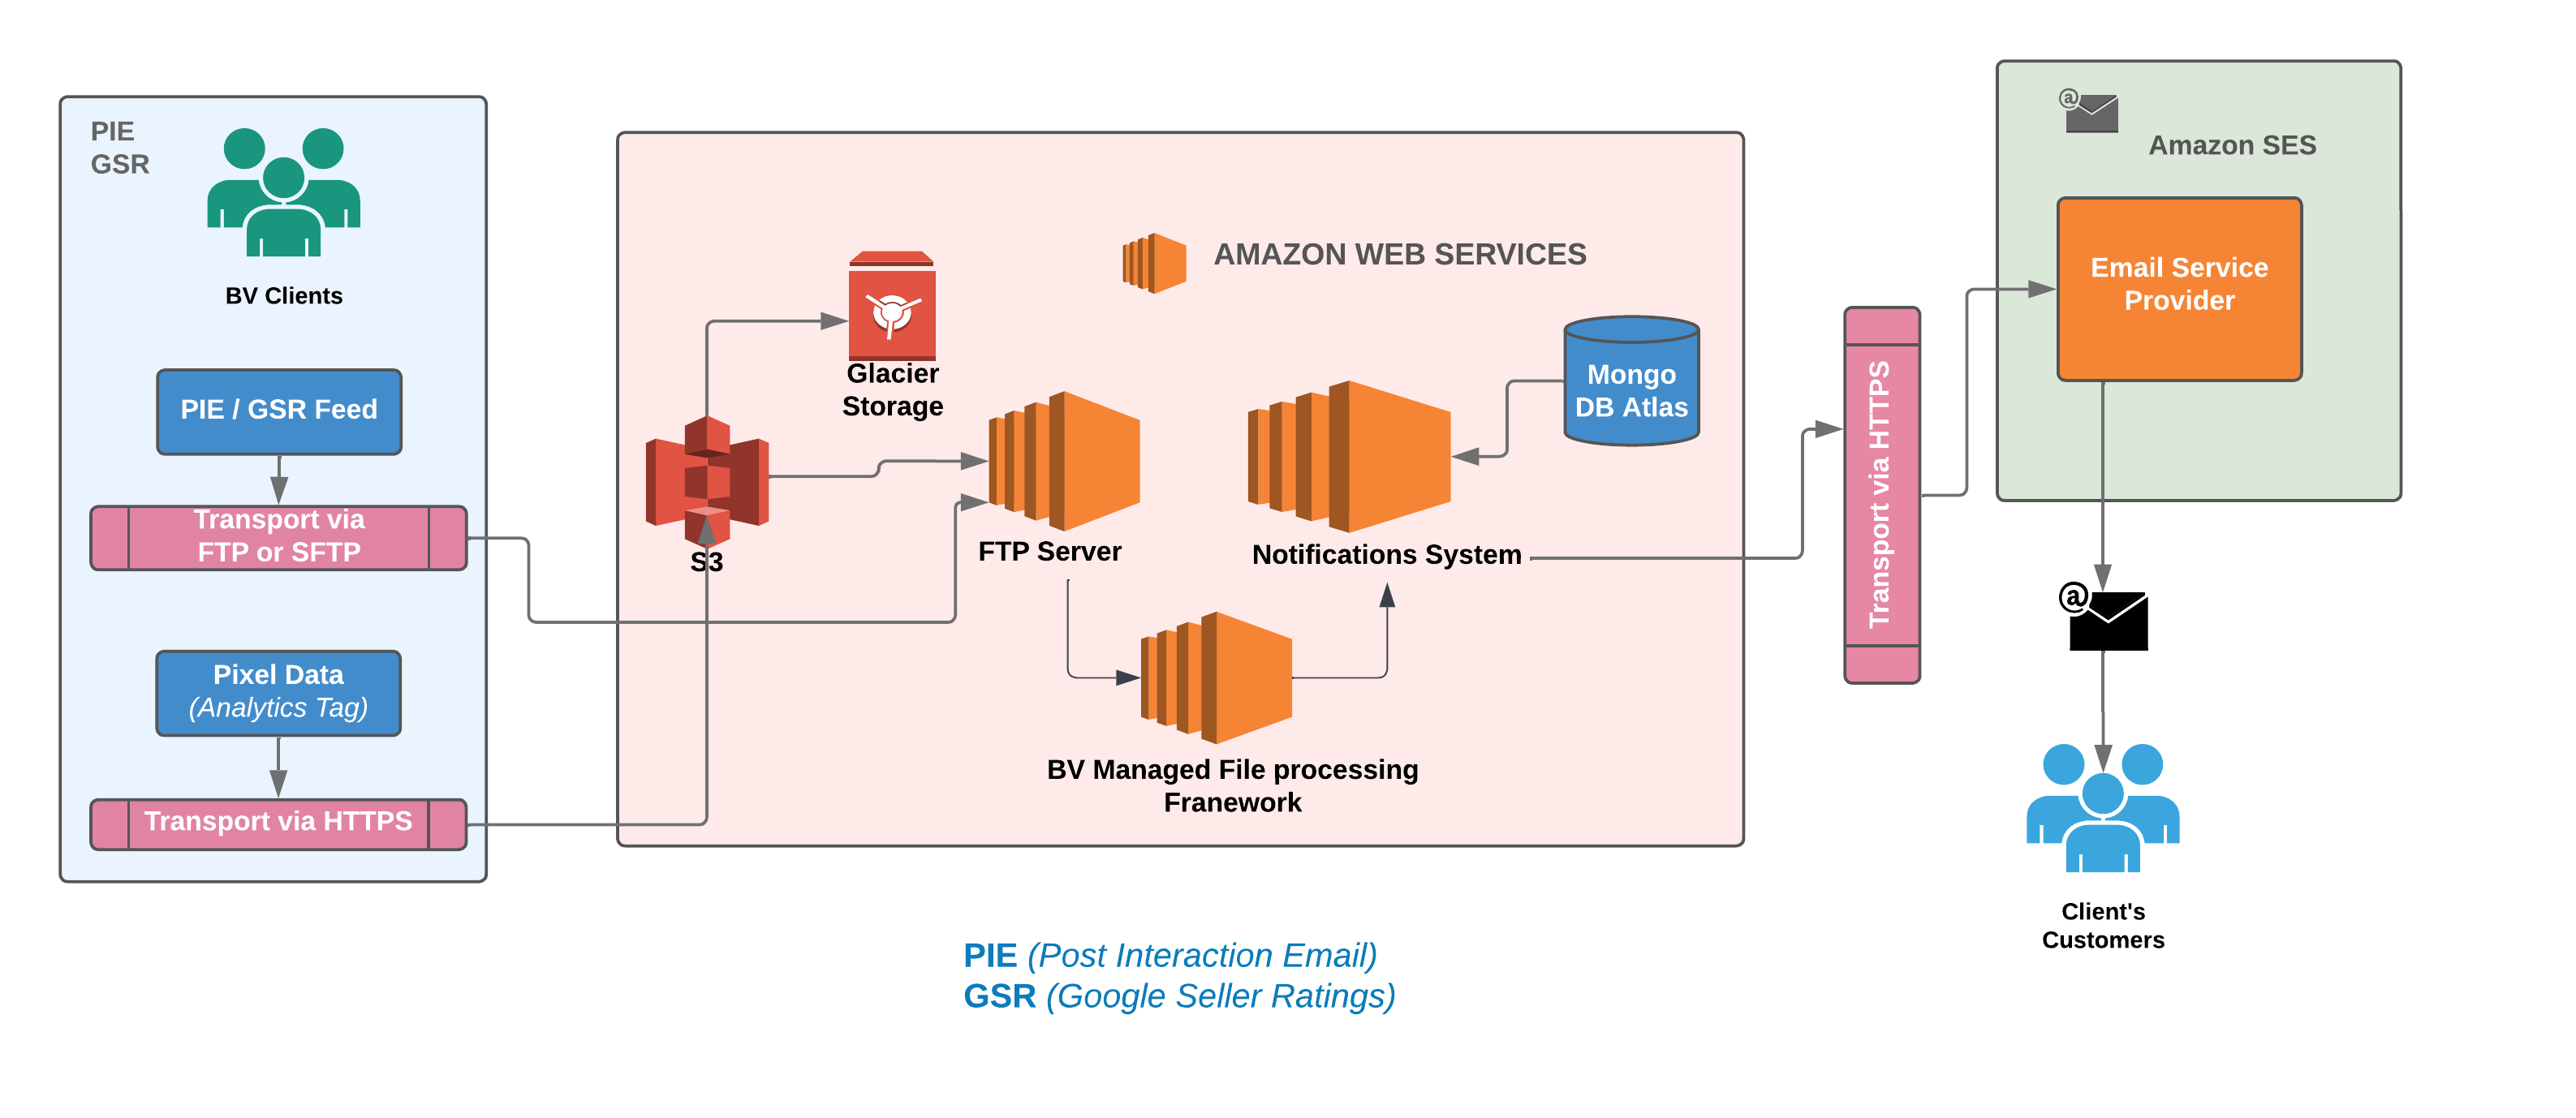
Examining the architecture mentioned above, we were already leveraging the AWS cloud and utilizing AWS managed services such as EC2, S3, and SES to meet our requirements. However, we were still actively managing several elements, such as scaling EC2 instances according to load patterns, managing security updates for EC2s, and setting up a distinct log stream to gather all instance-level logs into a separate S3 bucket for temporary storage, among other responsibilities. It’s important to note that our deployment process used Jenkins and CloudFormation templates. Considering these factors, one could characterize our earlier architecture as semi-cloud-native.
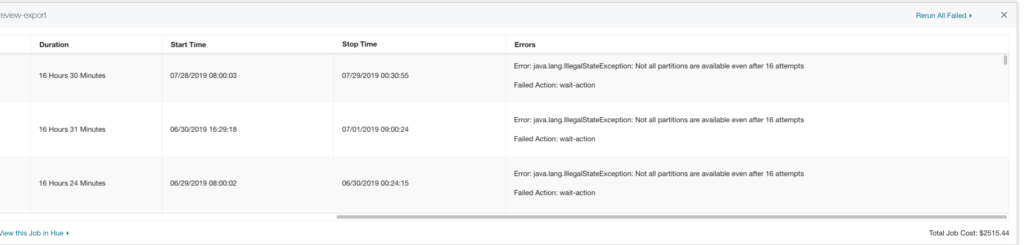
Upon careful observation of the Bazaarvoice-managed File Processing EC2 instances, it becomes apparent that these instances are handling complex, prolonged batch jobs. The ongoing maintenance and orchestration of these EC2 instances add significant complexities to overall operations. Unfortunately, due to the lack of active development on this framework, consumers, such as Notifications, find themselves dedicating 30% of an engineer’s on-call week to address various issues related to feed processing, stuck jobs, and failures of specific feed files. Enduring such challenges over an extended period is challenging. The framework poses a risk of regional outages if a client’s job becomes stuck, and our aim is to achieve controlled degradation for that specific client during such instances. These outages occur approximately once a month, requiring a week of engineering effort to restore everything to a green state.
Embrace cloud-native excellence
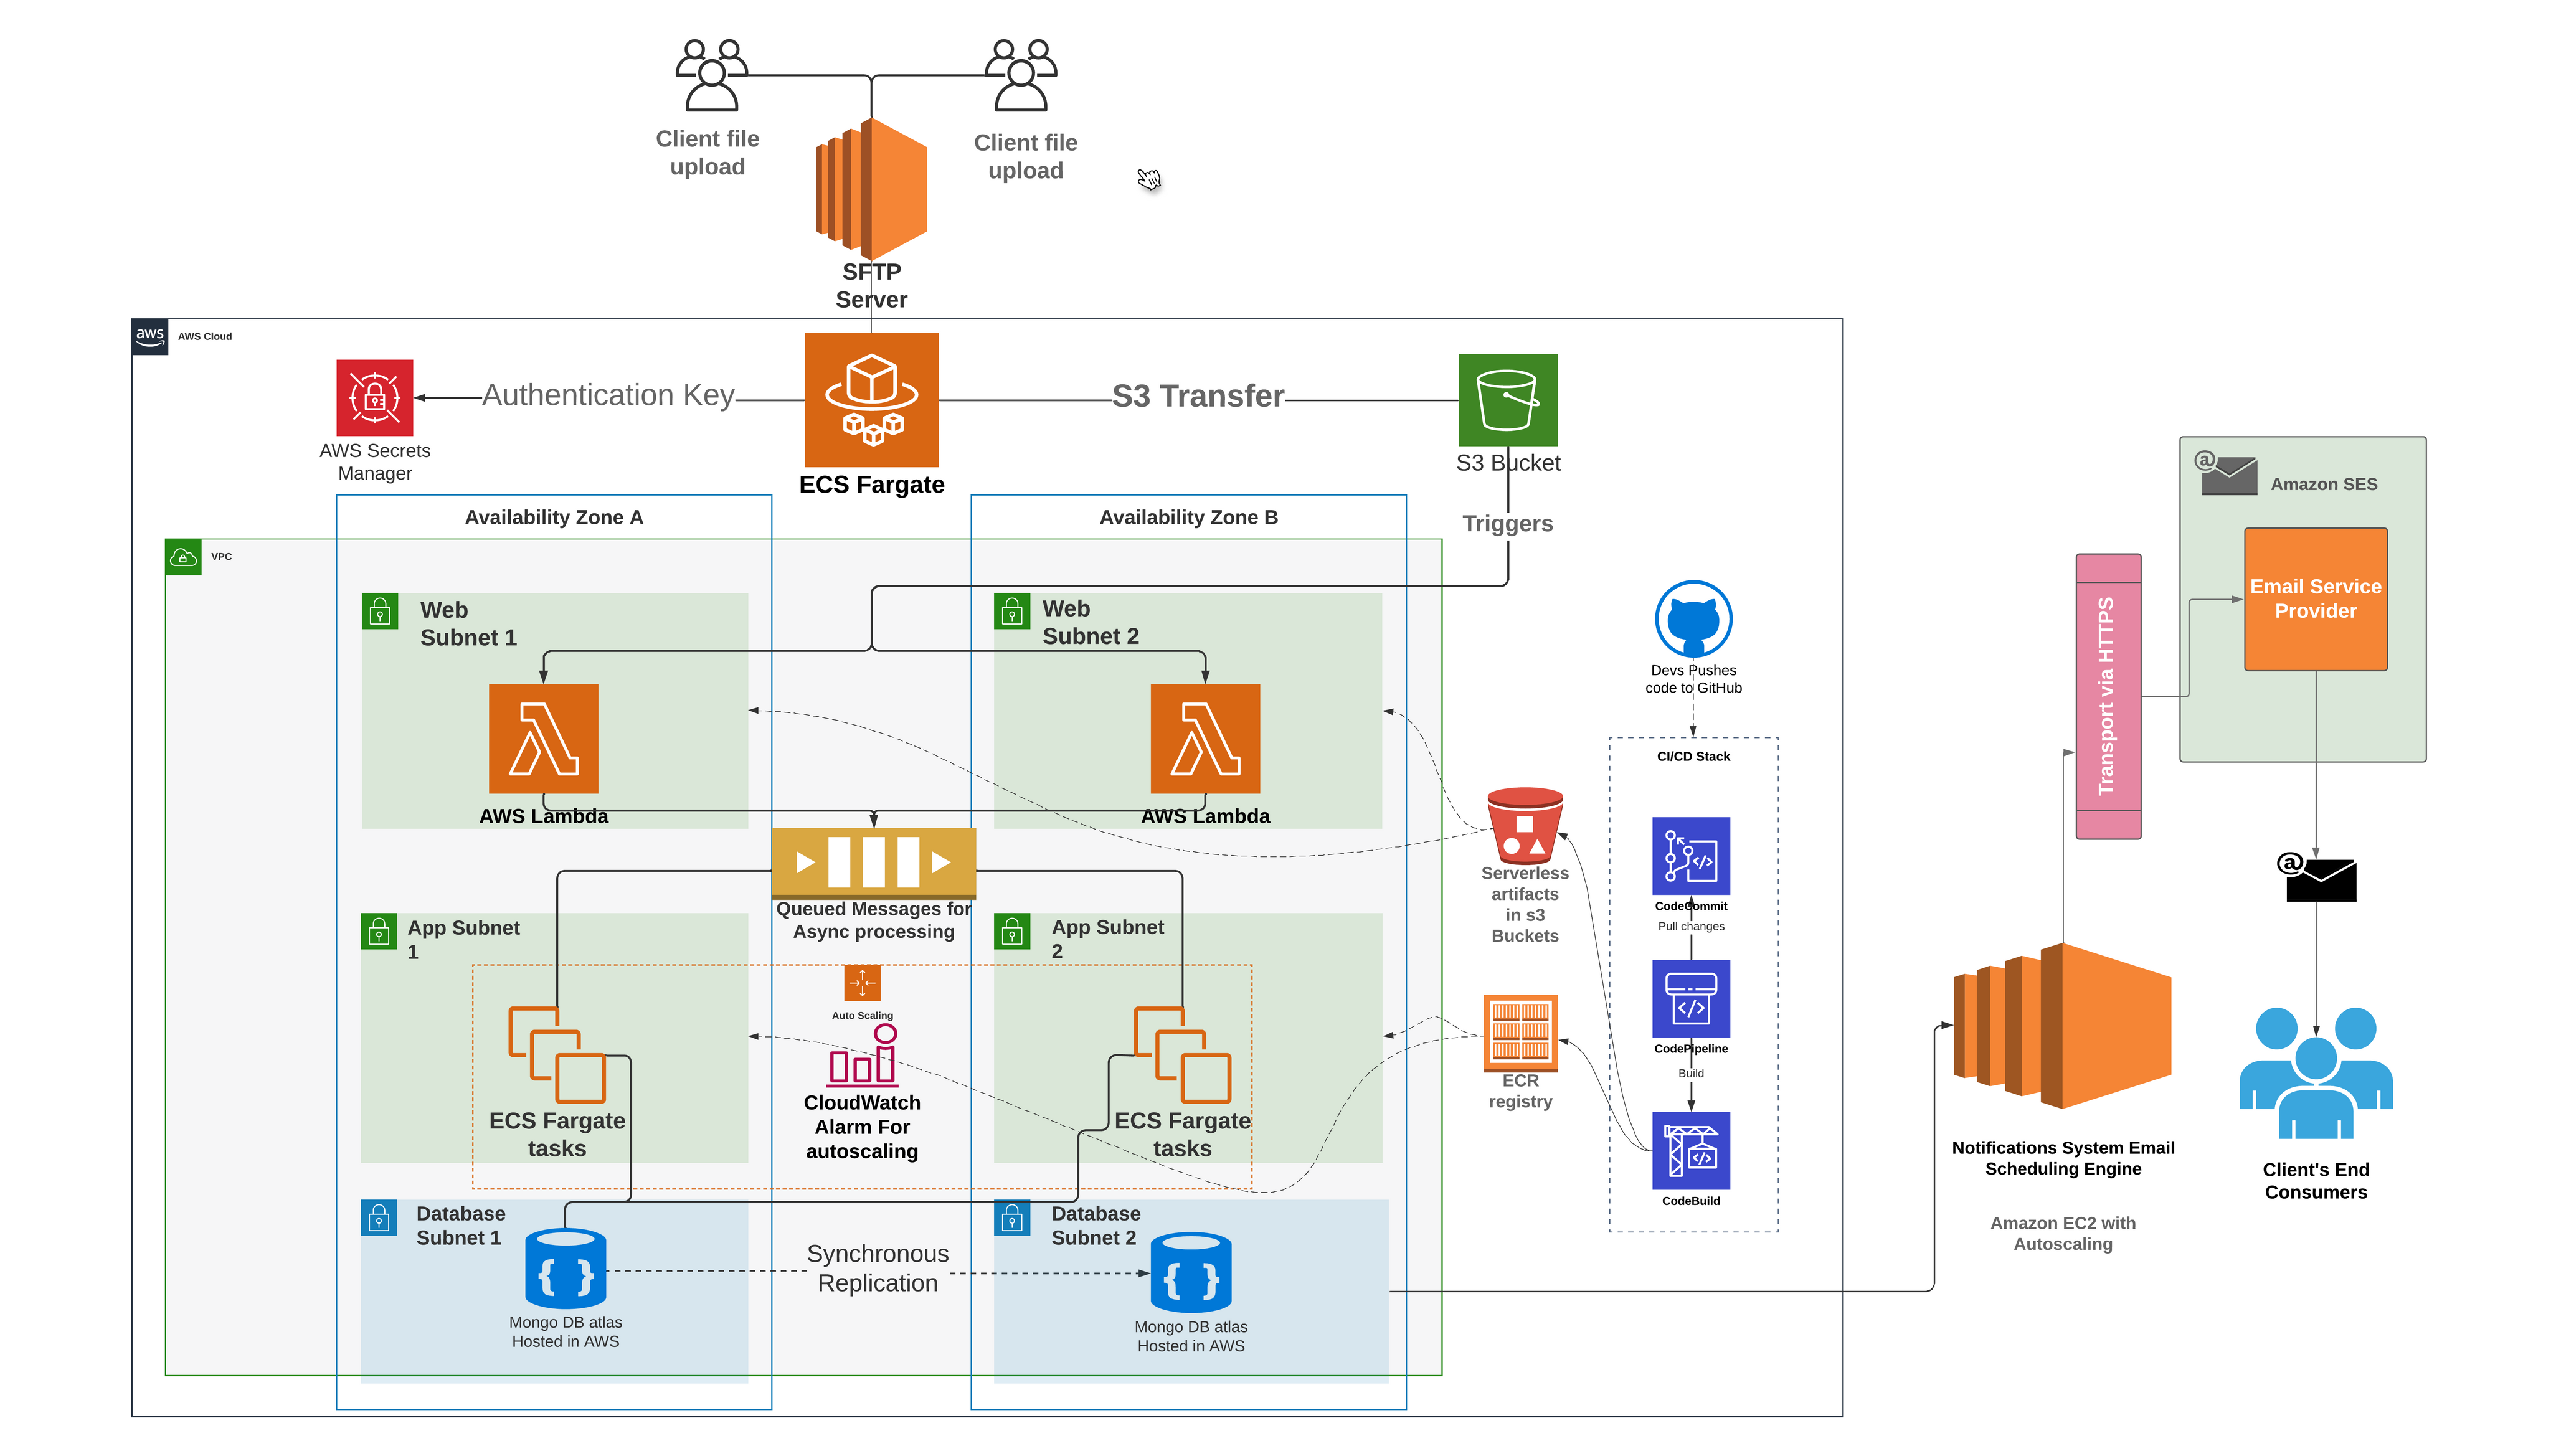
The diagram above illustrates the recently operationalized cloud-native, serverless data ingestion pipeline for the Notification Systems. Our transition to a cloud-native architecture has been a game-changer. Through meticulous design and rigorous testing, we created a modern, real-time data ingestion pipeline capable of handling millions of transactional data records with unprecedented efficiency. Witness the evolution in action through our cloud-native, serverless data ingestion pipeline, operationalized with precision and running flawlessly for over seven months, serving thousands of clients seamlessly.
We’ve decomposed the complex services that were previously engaged with numerous responsibilities into smaller, specialized services with a primary focus on specific responsibilities. One such service is the engagement-service, tasked with managing all client inbox folders (Email/Text/WhatsApp). This service periodically checks for new files, employs a file splitting strategy to ingest them into our S3 buckets, and subsequently moves them from the inbox to a backup folder, appending a timestamp to the filename for identification.
Achieve excellence by breaking barriers
Microservice
The journey to our current state wasn’t without challenges. Previously, managing AWS cloud services like EC2, S3, and SES demanded significant manual effort. However, by adopting a microservices architecture and leveraging ECS fargate task, AWS Lambda, step functions, and SQS, we’ve streamlined file processing and message conversion, slashing complexities and enhancing scalability.
Serverless Computing
Serverless computing has emerged as a beacon of efficiency and cost-effectiveness. With AWS Lambda handling file-to-message conversion seamlessly, our focus shifts to business logic, driving unparalleled agility and resource optimization.
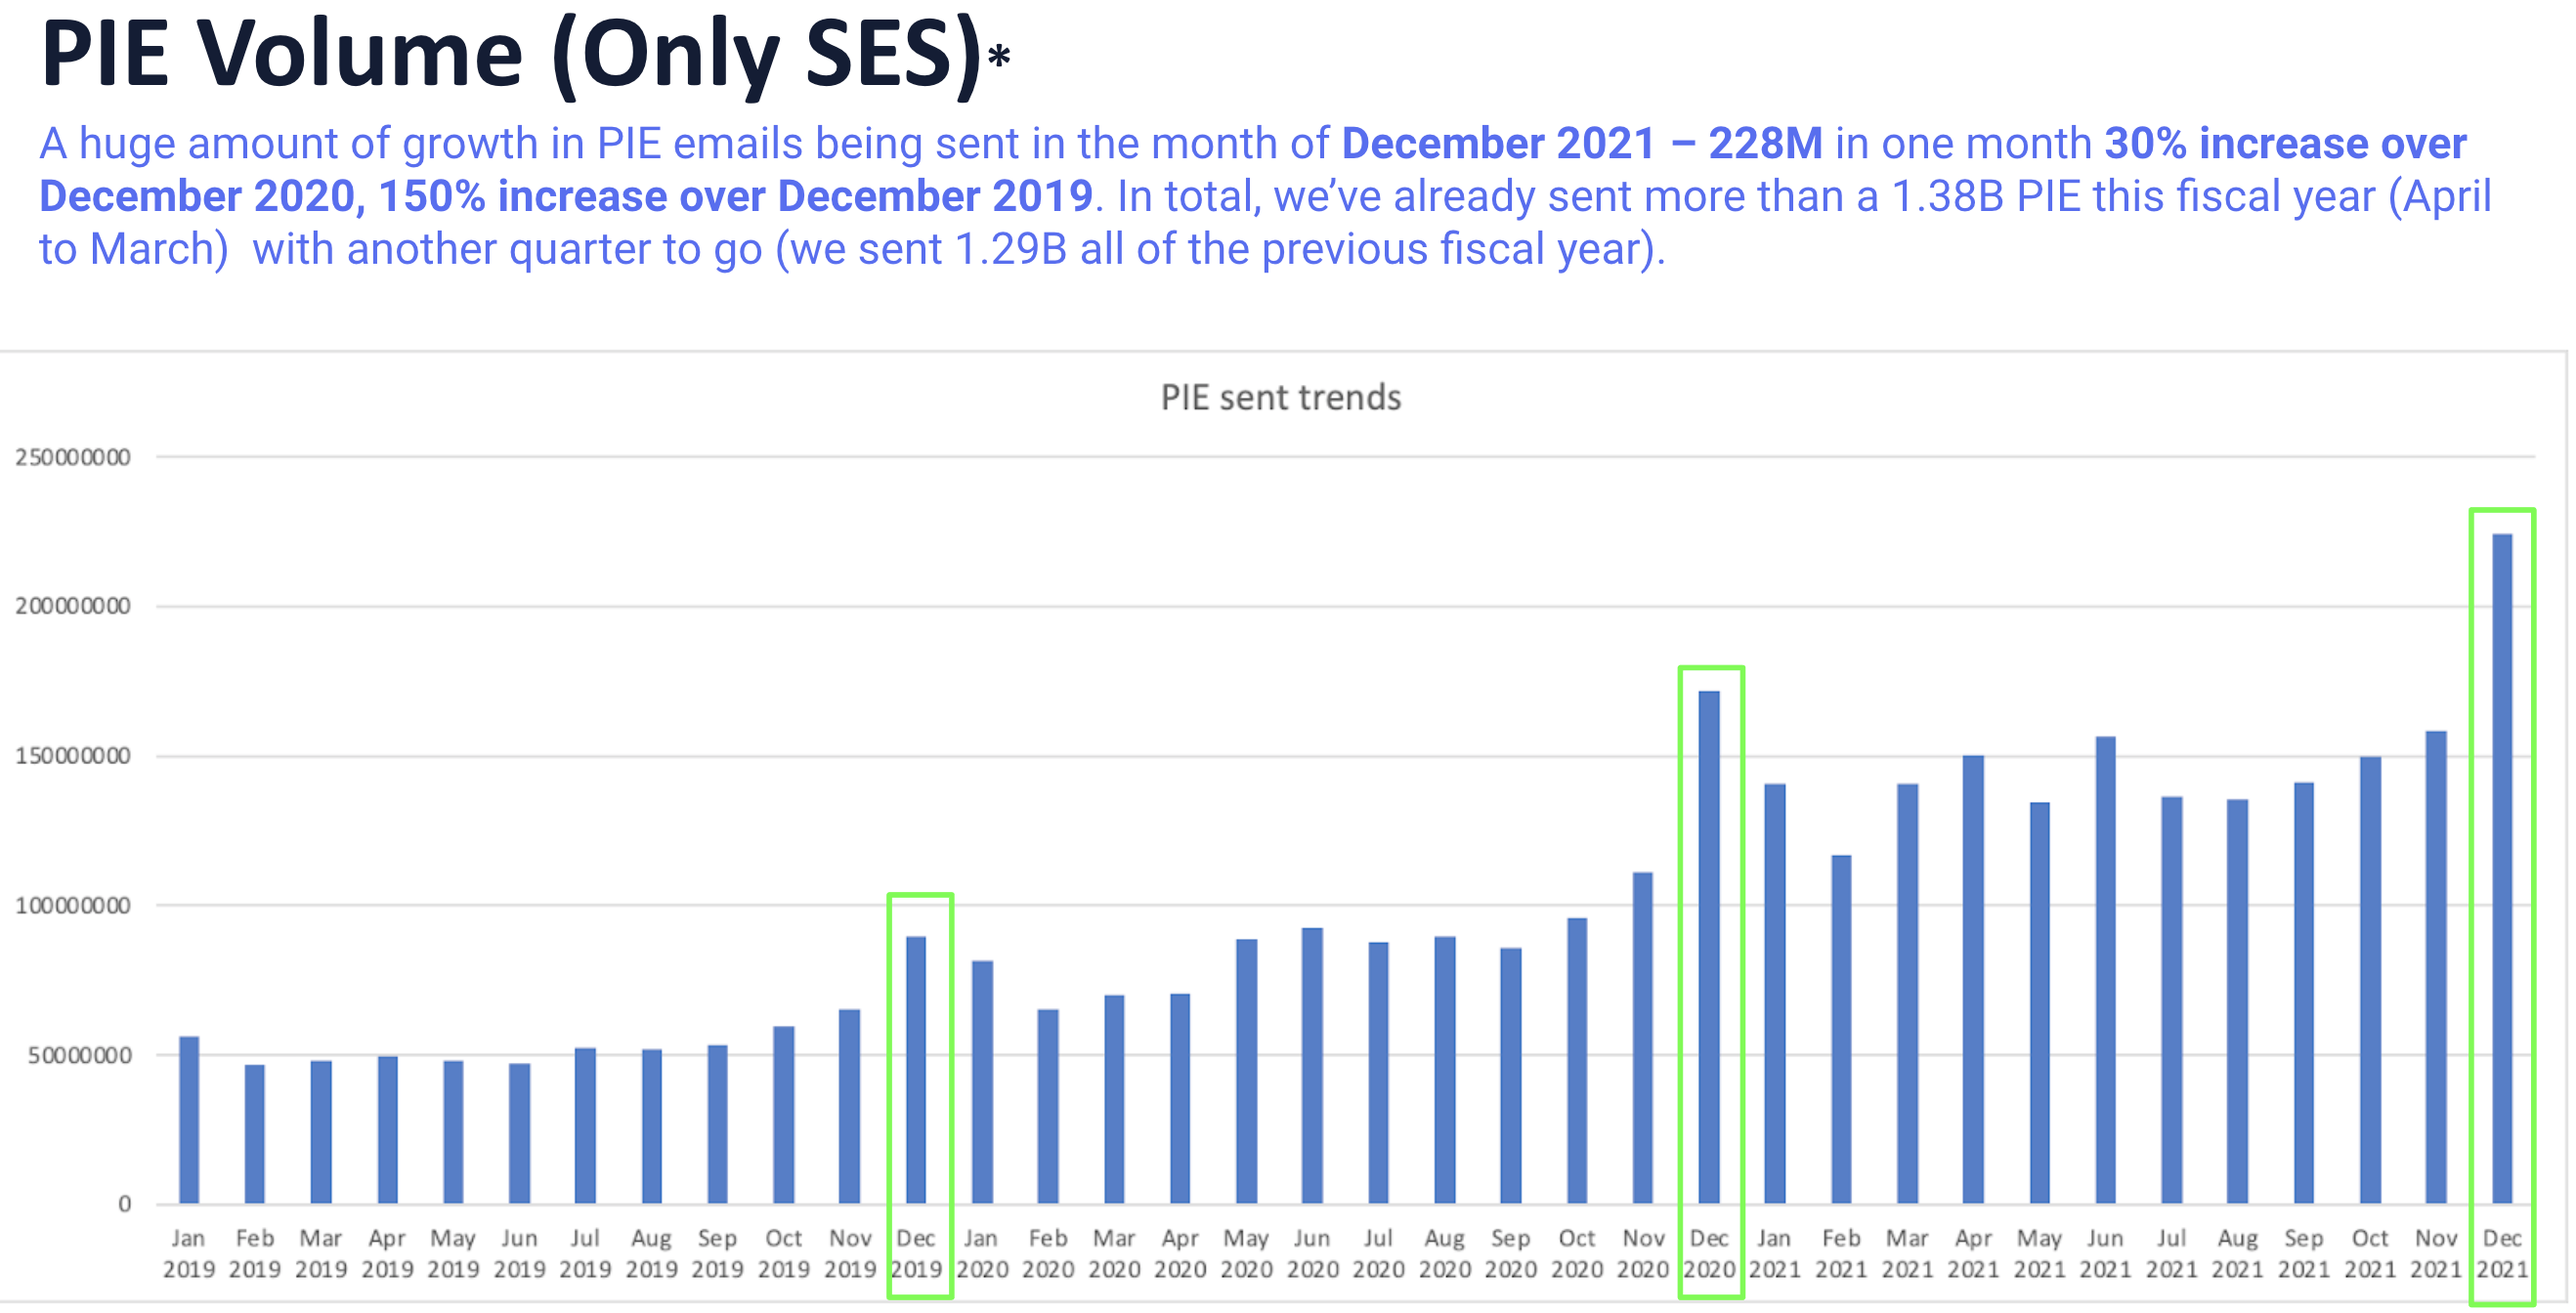
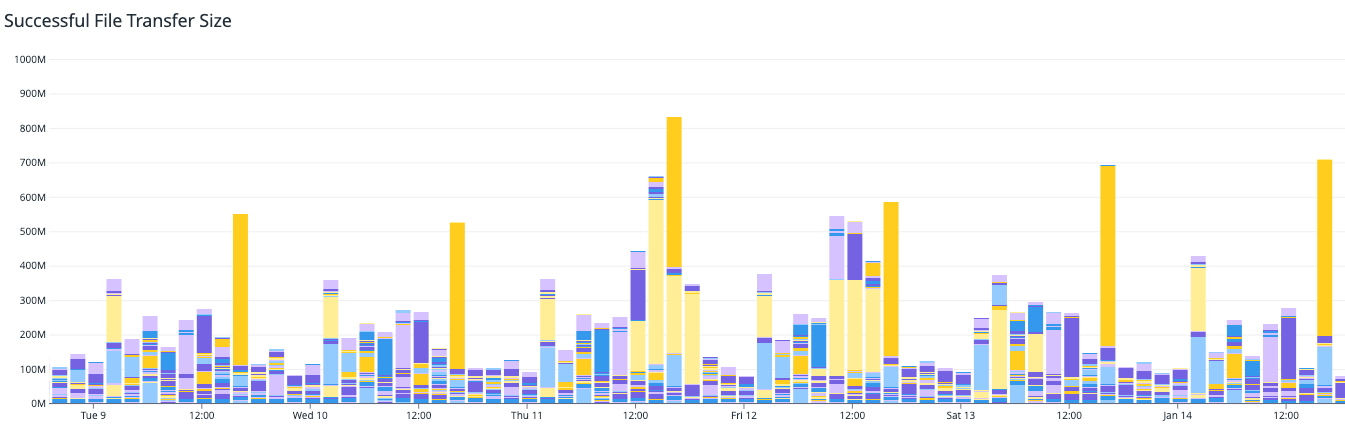
Transforming the ordinary into the remarkable, our daily transaction feed ingestion handles a staggering 5-6 million entries. This monumental data flow includes both file ingestion and analytics, fueling our innovative processes.
Consider a scenario where this load is seamlessly distributed throughout the day, resulting in a monthly cost of approximately $1.1k. In contrast, our previous method incurred a cost of around $1k per month.
Despite a nominal increase in cost, the advantages are game-changing:
- Enhanced Control: Our revamped framework puts us in the driver’s seat with customizable notifications, significantly boosting system maintainability.
- Streamlined Operations: Tasks like system downtime, debugging the master node issues, node replacements, and cluster restarts are simplified to a single button click.
- Improved Monitoring: Expect refined dashboards and alerting mechanisms that keep you informed and in control.
- Customized Delivery: By segregating email messages, SMS, and WhatsApp channels, we maintain client-set send times for text messages to their consumer base.
The pay-as-you-go model ensures cost efficiency of upto 17%, making serverless architecture a strategic choice for applications with dynamic workloads.

The logic for converting files to messages is implemented within AWS Lambda. This function is tasked with the responsibility of breaking down large file-based transactions into smaller messages, directing all client data to respective SQS queues based on the Notification channel (email or SMS). In this process, the focus is primarily on business logic, with less emphasis on infrastructure maintenance and scaling. Therefore, a serverless architecture, specifically AWS Lambda, step functions and SQS were used for this purpose.
Empower multitenancy, scalability, and adaptability
Our cloud-native notifications infrastructure thrives on managed resources, fostering collaboration and efficiency across teams. Scalability and adaptability are no longer buzzwords but integral elements driving continuous improvement and customer-centric innovations. These apps can handle problems well because they’re built from small, independent services. It’s easier to find and fix issues without stopping the whole server.
Notifications cloud-native infrastructure is spread out in different availability zones of a region, so if one zone has a problem, traffic can be redirected quickly to keep things running smoothly. Also, developers can add security features to their apps from the start.
Navigating the cloud-native terrain
Transitioning to cloud-native technologies demands strategic planning and cohesive teamwork across development, operations, and security domains. We started by experimenting with smaller applications to gain familiarity with the process. This allowed us to pinpoint applications that are well-suited for cloud-native transformation and retire those that are not suitable. Our journey has been marked by meticulous experimentation, focusing on applications ripe for transformation and retiring those not aligned with our cloud-native vision.
Conclusion: Shape tomorrow’s software engineering landscape
As we progress deeper into the era of cloud computing, the significance of cloud-native applications goes beyond a fleeting trend; they are positioned to establish a new standard in software engineering.
Through continuous innovation and extensive adoption, we are revolutionizing the landscape of Notifications system of Bazaarvoice with cloud-native applications, bringing about transformative changes through each microservice. The future has arrived, and it’s soaring on the cloud.