Testing for Application Front End Performance with Web Page Test

taco-meter

‘Taco-meter’ – a device used to measure how quickly you can obtain tacos from your current location
If you’ve followed Bazaarvoice’s R&D blog, you’ve probably read some of our posts on web application performance testing with tools like Jmeter here and here.

In this post, we’ll continue our dive into web app performance, this time, focusing on testing front end applications.

API Response Time vs App Usability:

Application UI testing in general can be challenging as the cost of doing so (in terms of both time, labor and money) can become quite expensive.

In our previous posts highlighted above, we touched on testing RESTful APIs – which revolves around sending a set of requests to a target, measuring their response times and checking for errors.

For front-end testing, you could do the same – automate requesting the application’s front-end resources and then measuring their collective response times.  However, there are additional considerations for front end testing that we must account for – such as cross-browser issues, line speed constraints (i.e. broadband vs. a mobile 3G) as well as client side loading and execution (especially important for JavaScript).

Tools like Jmeter can address some of these concerns, though you may be limited in what can be measured.  Plugins for Jmeter that allow Webdriver API access exist but can be difficult to configure, especially in a CI environment (read through these threads from Stack Overflow on getting headless Webdriver to work in Jenkins for example).

There are 3rd party services available that are specialized for UI-focused load tests (e.g. Blazemeter) but these options can sometimes be expensive.  This may be too much for some teams in terms of time and money – especially if you’re looking for a solution for introductory, exploratory testing as opposed to something larger in scale.

Webpagetest.org:

Webpagetest.org is an open source project backed by multiple partners such as Google, Akamai and Fastly, among others.  You can check out the project’s github page here.

Webpagetest.org is a publicly available service.  Its main goal is to provide performance information for web applications, allowing designers and engineers to measure and improve application speed.

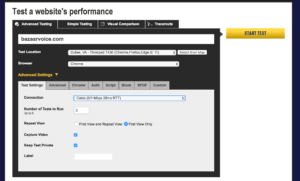
Let’s check out Webpagetest.org’s public facing page – note the URL form field.  We can try out the service’s basic reporting features by pasting the URL of a website or application into the field and submitting the form.  In this case, let’s test the performance of Bazaarvoice’s home page.

Before submitting the form however, note some of the additional options made available to us:

  • Browser type
  • Location
  • Number of tests
  • Connection
webpagetest.org form

Webpagetest.org’s initial submission form

This service allows us to configure our tests to simulate user requests from a slow, mobile, 3G device in the US to a desktop client with a fiber optic connection in Singapore (just to name a few).

Go ahead and submit the test form.  Once the test resolves, you’ll first notice the waterfall snapshot Webpagetest.org returns.  This is a reading of the application’s resources (images, JavaScript execution, external API calls, the works).  It should look very familiar if you have debugged a web site using a browser’s developer tools console.

webpagetest waterfall

Webpagetest.org’s waterfall report

This waterfall readout gives us a visual timeline of all the assets our web page must load for it to be active for the end user, in the order they are loaded, while recording the time taken to load and/or execute each element.

From here, we can determine which resources which have the longest load times, the largest physical foot prints and give us a clue as to how we might better optimize the application or web page.

Webpagetest.org’s content breakdown chart

In addition to our waterfall chart, our test results can provide any more data points, including but not limited to:

  • Content breakdown by asset type
  • CPU utilization
  • Bandwidth utilization
  • Screen shots and video capture of page load

Armed with this information from our test execution, you can begin to see where we might decide to make adjustment to our site to increase client-side performance.

Getting Programmatic:

Webpagetest.org’s web UI provides some great, easy-to-use features.  However, we can automated these tests using Webpagetest.org’s API.

In our next couple of steps, we’ll demonstrate how to do just that using Jenkins, some command line tools and Webpagetest.org’s public API, which you can read more about here.

Before Going Forward:

There are a few limitations or considerations regarding using Webpagetest.org and its API:

  • All test results are publicly viewable
  • API usage requires you to submit an email address to generate an API key
  • API requests are limited to 200 test runs per day
  • The maximum number of concurrent test runs allowed is 9

If test result confidentiality or scalability is a major concern, you may want to skip to the end of this article where we discuss using private instances of Webpagetest.org’s service.

Requirements:

 As mentioned above, we need an API key from Webpagetest.org. Just visit https://www.webpagetest.org/getkey.php and submit the form made available there.  You’ll then receive an email containing your API key.

Once you have your API key – lets set up a test using as CI service.  For this, like in our other test tutorials, we’ll be using Jenkins.

For this walkthrough, we’ll use the following:

  • Webpagetest’s public API
  • Jenkins
  • NodeJS (be sure your Jenkins instance has at least 1 server capable of using NodeJS 6 or above)
  • Webpagetest (a node module that provides a command-line wrapper for their API)
  • Jq-cli (a node module that provides JQ – a JSON query tool)
  • Wget-improved (a node implementation of the wget CLI tool – skip this if your Jenkins servers already have this binary installed).

Setting Up the Initial Job:

First, let’s get the Jenkins job up and running and make sure we can use it to reach our primary testing tool.

Do the following:

  • Log into Jenkins
  • Navigate to a project folder you wish your job to reside in
  • Click New Item
  • Give the job a name, select Freestyle Project from the menu and click OK

Now that the job is created, let’s set a few basic parameters:

  • Check ‘Discard old builds’
  • Set the Max # of Builds value to 100
  • Check the ‘Provide Node & npm bin/ folder to PATH’ option then choose your desired Node version (if this option is unavailable, see your system administrator).
jenkins-node

Specifying a NodeJs version for Jenkins to use

Next, let’s create a temporary build step to verify our job can reach Webpagetest.org

  • Click the ‘Add Build Step’ menu button
  • Select ‘Execute shell’
  • In the text box that appears, past in the following Curl command:
    •  curl http://webpagetest.org -s –f 
  • Save changes to your job and click the build option on the main job settings screen

Once the job has executed, click on the build icon and select the console output option.  Review the console output captured by Jenkins.  If you see HTML output captured at the end of the job, congratulations, your Jenkins instance can talk to Webpagetest.org (and its API).

Now we are ready to configure our actual job.

The Task at Hand:  

 The next steps will walk you through creating a test script.  The purpose of this script is as follows:

  • Install a few command line tools in our Jenkins instance when executed
  • Use these tools to execute a test using Webpagetest.org’s API
  • Determine when our test execution is complete
  • Collect and preserve our results in the following manner:
    • HAR (HTTP Archive)The entire test result data in JSON format
    • A PNG of our application’s waterfall
  • Filter our results for a specific element’s statistic we wish to know about

Adding Tools:

Click on the configure link for your job and scroll to the shell execution window.  Remove your curl command and copy the following into the window:

npm install -g webpagetest
npm install -g jq-cli-wrapper
npm install -g wget-improved

If you know that your Jenkins environments comes deployed with wget already installed, you can skip the last npm install command above.

Once this portion of the script executes, we’ll now have a command line tool to execute tests against Webpagetest’s API.  This wrapper makes it somewhat easier to work with the API, reducing the amount of syntax we’ll need for this script.

Next in our script, we can declare this command that will kick off our test:

webpagetest test $SITE -k $APIKEY -r $RUNS > test_exec.json
<span style="font-size: 1rem;">testId=$(cat test_exec.json | jq .data.testId)
</span>testId="${testId%\"}"
testId="${testId#\"}"
echo $testId

This script block calls the API, passing it some variables (which we’ll get to in a minute) then saves the results to a JSON file.

Next, we use the command line tools cat and jq to sort our response file, assigning the testId key value from that file to a shell variable.  We then use some string manipulation to get rid of a few extraneous quotation marks in our variable.

Finally, we print the testId variable’s contents to the Jenkins console log.  The testId variable in this case should now be set to a unique string ID assigned to our test case by the API.  All future API requests for this test will require this ID.

Adding Parameters:

Before we go further, let’s address the 3 variables we mentioned above.  Using shell variables in the confines of the Jenkins task will give us a bit more flexibility in how we can execute our tests.  To finish setting this part up, do the following:

  • In the job configuration screen, scroll to and check the ‘This build is parameterized’ option.
  • From the dropdown menu, select String Parameter
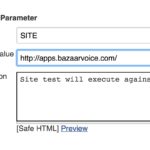
  • In the name field, enter SITE
  • For the default field, enter a URL you wish to test (e.g. http://www.bazaarvoice.com)
  • Repeat this process for the APIKEY and RUNS variables
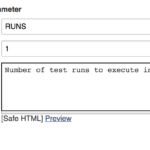
  • Set the RUNS parameter to a value of 1
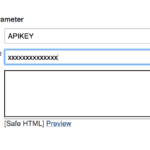
  • Set the default value for the APIKEY parameter to your Webpagetest.org API key.

Save changes to your job and try running it.  See if it passes.  If you view the console output form the run, there’s probably not much you’ll find useful.  We have more work to do.

site-parameter

Your site parameter should look like this

Your runs parameter should look like this

And your key parameter should looks like this

Waiting in Line:

The next portion of our script is probably the trickiest part of this exercise.  When executing a test with the Webpagetest.org web form, you probably noticed that as your test run executes, your test is placed into a queue.

waiting

Cue the Jeopardy! theme…

Depending current API usage, we won’t be able to tell how long we may be waiting in line for our test execution to finish.  Nor will we know exactly how long a given test will take.

To account for that, next we’ll have to modify our script to poll the API for our test’s status until our test is complete.  Luckily, Webpagetest.org’s API provides a ‘status’ endpoint we can utilize for this.

Add this to your script:

webpagetest status $testId -o status.json
testStatus=$(cat status.json | jq .data.testsCompleted)

Using our API wrapper for webpage test and jq, we’re posting a request to the API’s status endpoint, with our test ID variable passed as an argument.  The response then is saved to the file, status.json.

Next, we use cat and jq to filter the content of status.json, returning the contents of the ‘testsCompleted’ (which is a child of the ‘data’ node) within that file.  This gets assigned to a new variable – testStatus.

Still Waiting in Line:


long line

Just like going to the DMV

The response returned when polling the status endpoint contains a key called ‘status’ with possible values set to ‘In progress’ or ‘Completed’.  This seems like the perfect argument we would want to check to monitor our test status.However, in practice, this key-value pair can be set prematurely – returning a value of ‘Completed’ when not necessarily every run within our test set has finished.  This can result in our script attempting to retrieve an unfinished test result – which would be partial or empty.

After some trial and error, it turns out that reading the ‘testsCompleted’ key from the status response is a more accurate read as to the status of our tests.  This key contains an integer value equal to the number of test runs you specified that have completed execution.

Add this to your script:

while [ "$testStatus" != "$RUNS" ]
do
sleep 10
webpagetest status $testId -o status.json
testStatus=$(cat status.json | jq .data.testsCompleted)
done

This loop compares the number of tests completed with the number of runs we specified via our Jenkins string variable, $RUNS.

While those two variables are not equal, we request our test’s status, overwrite the status.json file with our new response, filter that file again with jq and assign our updated ‘testsCompleted’ value to our shell variable.

Note that the 10 second sleep command within the loop is optional.  We added that as to not overload the API with requests every second for our test’s status.

Once the condition is met, we know that the number of tests runs we requested should be the same number completed. We can now move on.

Getting The Big Report:

Once we have passed our while loop, we can assume that our test has completed.  Now we simply need to retrieve our results:

webpagetest har $testId -o results.har

webpagetest results $testId -o results.json

Webpagetest’s API provides multiple options to retrieve result information for any given test.  In this case, we are asking the API to give us the test results via HAR format.

Note – if you wish to deliver your test results in HAR format, you will need a 3rd party application or service to view .har files.  There are several options available including stand-alone applications such as Charles Proxy and Har Viewer.

Additionally, we are going to retrieve the test results from our run using the API’s results endpoint and assign this to a JSON file – results.json.

Now would be a great time to save the changes we’ve made to your test.

Getting the Big Picture:

Next, we want to retrieve the web application’s waterfall image – similar to what was returned when executing our test via the Webpagetest.org web UI.

To do so, add this to your script:

waterfallImage=$(cat results.json | jq '.data.runs."1".firstView'.images.waterfall)
waterfallImage="${waterfallImage%\"}"
waterfallImage="${waterfallImage#\"}"
nwget $waterfallImage -O waterfall.png

Since we’ve already retrieved our test results and saved them to the results.json file, we simply need to filter this file for a key-value pair that contains the URL for where our waterfall snapshot resides online.

In the results.json file, the main parent that contains all test run information is the ‘data’ node.  Within that node, our results are divided up amongst each test run.  Here we will further filter our results.json object based on the 1st test run.

Within that test run’s ‘firstView’ node, we have an images node that contains our waterfall image.

We then assign the value of that node to another shell variable (and then use some string manipulation to trim off some unnecessary leading and ending quotation characters).

Finally, as we installed the nwget module at the beginning of this script, we invoke it, passing the URL of our waterfall image as an argument and the option to output the result to a PNG file.

Archiving Results:

Upon each execution, we wish to save our results files so that we can build a collection of historical data as we continue to build and test our application.  Doing this within Jenkins is easy

Just click on the ‘Add Post Build Action’ button within the Jenkins job configuration menu and select ‘Archive the artifacts’ from the menu.

In the text field provided for this new step, enter ‘*.har, results.json, waterfall.png’ and click save.

Now, when you run your test job – once the script succeeds, it will save each instance of our retrieved HAR, waterfall image and results.json file to each respective Jenkins run.

Once you save your job configuration, click the ‘Build with Parameters’ button and try running it.  Your artifacts should be appended to each job run once it completes.

results

Collecting your results in Jenkins

Like a Key-Value Pair in a JSON Haystack:

Next, we’re going to talk about result filtering.  The results.json provided initially by the API is exhaustive in size.  Go ahead and scroll through that file saved from your last successful test run (you will probably be scrolling for a while).  There’s a mountain of data there but let’s see if we can fish some information out of the pile.

The next JSON-relative trick we’re going to show you is how you can filter the results.json from Webpagetest.org down to a specific object you wish to measure statistics for.

The structure of the results.json lists every web element (from .js libraries to images, to .css files) called during the test and enumerates some statistics about it (e.g. time to load, size, etc.).  What if your goal is to monitor and measure statistics about a very specific element within your application (say, a custom .js library you ship with your app)?

needle-in-a-haystack

That’s one way of finding it…

For that purpose, we’ll use cat and js again to filter our results down to one, specific file/element’s results.  Try adding something like this to your script:

cat results.json | jq '.data.runs."1".firstView.requests[] | select(.url | contains(" <a unique identifying string for your web element> "))' > stats.json

This is similar to how we filtered our results to obtain our waterfall image above.  In this case, each test result from Webpagetest.org contains a JSON array called ‘requests’.  Each item in the array is delineated by the URL for each relative web element.

Our script command above parses the contests of results.json, pulling the ‘results’ array out of the initial test run, then filtering that array based on the ‘url’ key, provided that key matches the string we provided to jq’s ‘contains’ method.

These filtered results are then output to the stats.json file.  This file will contain the specific test result statistics for your specific web element.

Add stats.json to the list of artifacts you wish to archive per test run.  Now save and run your test again.  Note, you may need to experiment with the arguments passed to JQ’s contains method to filter your results based on your specific needs.

Next Steps:

At this point, we should have a Jenkins job that contains a script that will allow us to execute tests against Webpagetest.org’s public API and retrieve and archive test results in a set of files and formats.

This can be handy in of itself but what if you have team or organization members who need access to some or all of this data but do not have access to Jenkins (for security purposes or otherwise)?

Some options to expose this data to other teams could be:

  • Sync your archived elements to a publicly available bucket in Amazon S3
  • Have a 3rd party monitoring service (Datadog, Sumo Logic, etc.) read and report test findings
  • Send out email notifications if some filtered stat within our results exceeds some threshold

There’s quite a few ideas to expand upon for this kind of testing and reporting.  We’ll cover some of these in a future blog post so stay tuned for that.

Private or Testing and Wrap-Up:

If you find this method of performance testing useful but are feeling a bit limited by Webpagetest.org’s restrictions on their public API (or the fact that all test results are made public), it is worth mentioning that if you’re needing something more robust or confidential, you can host your own, private instance of the free, open-source API (see Webpagetest.org’s github project for documentation).

Additionally, Webpagetest.org also has pre-built versions of their app available as Amazon EC2 AMIs for use by anyone with AWS access.  You can find more information on their free AMIs here.

Additionally, here’s the script we’ve put together through this post in its entirety:


npm install -g webpagetest
npm install -g jq-cli-wrapper
npm install -g wget-improved

webpagetest test $SITE -k $APIKEY -r $RUNS &gt; test_exec.json
&lt;span style="font-size: 1rem;"&gt;testId=$(cat test_exec.json | jq .data.testId)
&lt;/span&gt;testId="${testId%\"}"
testId="${testId#\"}"
echo $testId

webpagetest status $testId -o status.json
testStatus=$(cat status.json | jq .data.testsCompleted)

while [ "$testStatus" != "$RUNS" ]
do
sleep 10
webpagetest status $testId -o status.json
testStatus=$(cat status.json | jq .data.testsCompleted)
done

waterfallImage=$(cat results.json | jq '.data.runs."1".firstView'.images.waterfall)
waterfallImage="${waterfallImage%\"}"
waterfallImage="${waterfallImage#\"}"
nwget $waterfallImage -O waterfall.png

cat results.json | jq '.data.runs."1".firstView.requests[] | select(.url | contains(" <a unique identifying string for your web element> "))' > stats.json

We hope this article has been helpful in demonstrating how some free tools and services can be used to quickly stand up performance testing for your web applications.  Please check back with our R&D blog soon for future articles on this and other performance related topics.


Maintaining Test Data with the “someObject” Test Structure

Language: Scala
TestTool: Scalatest

How did we get here?

When systems become reasonably complex, tests must manage cumbersome amounts of data. A test case that may test a small bit of functionality may start to require large amounts of domain knowledge about the system being tested. This is often done through the mock data used to set up the test. Maintenance of this data becomes cumbersome, monotonous and can feel Sisyphean. To solve these problems we created “someObject”, a modular system that allows us to maintain data in only one location while providing the flexibility to create specific data for our tests.

Let’s Do A Code Time!

To start this post, we’re going to build a system without the “someObject” test structure to provide context for its use. (To skip to the “someObject” structure, jump to here!). Suppose we are building a service that reports on advertising campaigns. We may create a class that describes an advertising campaign and call it `Campaign`.

case class Campaign(id: String,
    name: String,
    client: String,
    startDate: UTCDate,
    endDate:UTCDate,
    deleted: Boolean)

Now we are going to store this campaign in a database, and we need to write some integration tests to make sure this operation is performed properly. A test that confirms a campaign is stored properly might look like this:

it should "properly store a single campaign" in {
    Given("we have a proper campaign")
    val campaignToStore = Campaign(
        id = "someId",
        name = "someName",
        client = "someClient",
        startDate = UTCDate(1955, 10, 6),
        endDate = UTCDate(1956, 10, 6),
        deleted = false)

    And("we store this campaign in the database")
    database.storeCampaign()

    When("we fetch the given campaign")
    val fetchedCampaign:Campaign = database.fetchCampaign()

    Then("All the campaign values were stored properly")
    fetchedCampaign.id shouldBe campaignToStore.id
    fetchedCampaign.name shouldBe campaignToStore.name
    fetchedCampaign.client shouldBe campaignToStore.client
    fetchedCampaign.startDate shouldBe campaignToStore.startDate
    fetchedCampaign.endDate shouldBe campaignToStore.endDate
    fetchedCampaign.deleted shouldBe campaignToStore.deleted
}

BlogIntro.scala

Add some functionality:

Now we add the ability to update some values for this campaign in the database, and we need to test this new piece of functionality. That test might look something like this:

it should "properly update a single campaign" in {
    Given("we have a proper campaign")
    val campaignToStore = Campaign(
        id = "someId",
        name = "someName",
        client = "someClient",
        startDate = UTCDate(1955, 10, 6),
        endDate = UTCDate(1956, 10, 6),
        deleted = false)

    And("some update parameters for our campaign")
    val updateParameters = UpdateParameters(name = Some("someNewName"))

    And("we store this campaign in the database")
    database.storeCampaign(campaignToStore)

    When("we update this campaign")
    database.updateCampaign("someId", updateParameters)

    val fetchedCampaign:Campaign = database.fetchCampaign("someId")

    Then("All the campaign values were stored properly")
    //Unchanged values
    fetchedCampaign.id shouldBe campaignToStore.id
    fetchedCampaign.client shouldBe campaignToStore.client
    fetchedCampaign.startDate shouldBe campaignToStore.startDate
    fetchedCampaign.endDate shouldBe campaignToStore.endDate
    fetchedCampaign.deleted shouldBe campaignToStore.deleted
    //Changed values
    fetchedCampaign.name shouldBe updateParameters.name
}

BlogUpdateFunction.scala

But here we see the duplication of test boilerplate code in `campaignToStore`. We don’t want to have to copy over `campaignToStore` into every test, so we might want to abstract that out to be used all over the suite.

object MyCampaignTestObjects {
    val campaignToStore = Campaign(
        id = "someId",
        name = "someName",
        client = "someClient",
        startDate = UTCDate(1955, 10, 6),
        endDate = UTCDate(1956, 10, 6),
        deleted = false)
}

BlogAbstractToSuite.scala

Now we can use the same data in every test!

Add a Test that requires unique data:

Suppose we now write a function to fetch all the campaigns that are stored in the database. We might need a test that involves uniqueness in the data we store, such as the following example:

it should "properly fetch all stored campaigns" in {
    Given("we store several unique campaigns")
    val anotherCampaignToStore = Campaign(
        id = "someSecondId",
        name = "someSecondName",
        client = "someSecondClient",
        startDate = UTCDate(1955, 10, 6),
        endDate = UTCDate(1956, 10, 6),
        deleted = false)
    database.storeCampaign(campaignToStore)
    database.storeCampaign(anotherCampaignToStore)

    When("we fetch all campaigns")
    val allCampaigns = database.fetchAllCampaigns()

    Then("all campaigns are returned")
    allCampaigns shouldBe List(campaignToStore, anotherCampaignToStore)
}

BlogTestWithUniqueTestData.scala

In the example, we re-used the campaign we abstracted out earlier for conciseness, but this makes this test unclear that `anotherCampaignToStore` is unique. What if someone else comes in and changes `campaignToStore` and it happens to match data from `anotherCampaignToStore`? This test would then become flakey and nobody likes flakey tests. We might decide to just make all data used in this test local to this test, but then we will need to maintain the test data in both this test, and `MyCampaignTestObjects`.

Add Some Arbitrary Data Constraints:

Suppose now that there is a new design constraint on how campaigns can be stored in the database. Now all client names must be lowercased in all campaigns:

object MyCampaignTestObjects {
    val campaignToStore = Campaign(
    id = "someId",
    name = "someName",
    //We change the client name to match our new requirement
    client = "some_client",
    startDate = UTCDate(1955, 10, 6),
    endDate = UTCDate(1956, 10, 6),
    deleted = false)
}

BlogNewConstraint.scala

Now we start to see the issue with maintaining test data across the whole suite that we’ve been constructing. We need to find every mock campaign that is used in our suite and ensure that its client field data is lowercased. Realistically, many of our tests, (specifically in this example, the `fetchAllCampaigns` test) don’t care about the client field of their campaign, and so we shouldn’t need to care about the client field value while setting up our mock test data. Because this example is small, it’s not cumbersome to directly update the value to satisfy the new constraint. Now let us Imagine a large set of suites, each containing hundreds of unique test cases. Suddenly this single suite requires a large amount of work to refactor one field across each test case. Nobody wants to do that monotonous maintenance. To address this, our team adopted the “someObject” structure to minimize this data maintenance within our tests.

someObject Test Structure:

When designing this test structure, we wanted to make our test data extendable for use anywhere it is needed. We used Scala’s `trait` to mix in necessary functions to provide test objects to the objects inside our tests, such as the `MyCampaignTestObjects` object above:

trait CampaignTestObjects {
    def someCampaign(id: String = "someId",
                     name: String = "someName",
                     client: String = "some_client",
                     startDate: UTCDate = UTCDate(1955, 10, 6),
                     endDate: UTCDate = UTCDate(1956, 10, 6),
                     deleted: Boolean = false): Campaign =
        Campaign(
            id = id,
            name = name,
            client = client,
            startDate = startDate,
            endDate = endDate,
            deleted = deleted)
}
 object MyCampaignTestObjects extends CampaignTestObjects {
    //Any other setup methods for test data
}

Now we can revisit our `fetchAllCampaigns` test example.

it should "properly fetch all stored campaigns" in {
    Given("we store several unique campaigns")
    val campaignToStore = someCampaign(id = "someId")
    val anotherCampaignToStore = someCampaign(id = "someNewId")
    database.storeCampaign(campaignToStore)
    database.storeCampaign(anotherCampaignToStore)

    When("we fetch all campaigns")
    val allCampaigns = database.fetchAllCampaigns()

    Then("all campaigns are returned")
    allCampaigns shouldBe List(campaignToStore, anotherCampaignToStore)
}

BlogBasicSomeObject.scala

Inside this test, we’ve set up two unique campaigns, by calling the `someCampaign` method from our test data trait. This populates the returned campaign with dummy data that we don’t care about. All we need out of this method is “some campaign” with “some data”. Now, instead of obscuring the intent of the test case by setting up cumbersome, overly-expressive mock data, we can simply override the implicitly available mock objects with only the necessary data. For the unique campaigns needed in the `fetchAllCampaigns` test, we only only really care about each campaign’s identifier. We don’t update the name, client, startDate, etc. because this test doesn’t care about any of that data. We only need to care that the campaigns are unique for our database. Under this test structure, when we receive the design change about the client names being lowercased, we don’t need to update our `fetchAllCampaigns`.

Another Example:

Let’s provide another example that our team encountered. Campaigns inside our database now need to also store the amount of money spent on each ad campaign. We’re adding a new column to our database, and changing the database schema.

case class Campaign(id: String,
    name: String,
    client: String,
    totalAdSpend: Int,
    startDate: UTCDate,
    endDate: UTCDate,
    deleted: Boolean)

Now, every test that has a campaign involved needs to be updated to include a new field; but under the “someObject” structure we only need to add two lines and all existing tests should be working fine again:

trait CampaignTestObjects {

    def someCampaign(id: String = "someId",
                     name: String = "someName",
                     client: String = "some_client",
                     totalAdSpend: Int = 123456,
                     startDate: UTCDate = UTCDate(1955, 10, 6),
                     endDate: UTCDate = UTCDate(1956, 10, 6),
                     deleted: Boolean = false): Campaign =
        Campaign(
            id = id,
            name = name,
            client = client,
            totalAdSpend = totalAdSpend,
            startDate = startDate,
            endDate = endDate,
            deleted = deleted)
}

BlogPostSchemaChange.scala


Behavior Driven Tests:

The purpose of the “someObject” structure is to minimize data maintenance within tests. We want to ensure that we’re disciplined about only setting data that the tests need to care about. There are cases where data might seem necessary for what we are testing, but we can abstract that data away to de-couple the test’s reliance on hard coded values. For example, suppose we have a function that returns the sum of all the `totalAdSpend` across our database.

def sumAllSpend(campaignsToSum: List[Campaign]):Int = 
    campaignsToSum.reduce(_.totalAdSpend + _.totalAdSpend)

To test this function, we might write a test like this:

it should "properly sum all totalAdSpend" in {
    Given("we store several unique campaigns")
    val campaignToStore = someCampaign(id = "someId", totalAdSpend = 123)
    val anotherCampaignToStore = someCampaign(id = "someNewId", totalAdSpend = 456)
    database.storeCampaign(campaignToStore)
    database.storeCampaign(anotherCampaignToStore)

    When("we sum all ad spend")
    val totalTotalAdSpend = sumAllSpend(database.fetchAllCampaigns())

    Then("the result is the sum of all ad spend")
    totalTotalAdSpend shouldBe 975
}

BlogPostNonBehaviorTest.scala

While this test does work, and it utilizes this “someObject” structure, it still forces data management at the test level.

`sumAllSpend` doesn’t really care about any one campaign’s `totalAdSpend` value. It only cares that we add all of the `totalAdSpend` values up correctly. We could instead write our test to assert on this behavior instead of doing the math ourselves and taking on the responsibility of managing more data.

it should "properly sum all totalAdSpend" in {
   Given("we store several unique campaigns")
   val campaignToStore = someCampaign(id = "someId")
   val anotherCampaignToStore = someCampaign(id = "someNewId")

   val allCampaignsToStore = List(campaignToStore,anotherCampaignToStore)
   allCampaignsToStore.foreach(campaign =&amp;gt; database.storeCampaign(campaign))

   When("we sum all ad spend")
   val totalTotalAdSpend = sumAllSpend(database.fetchAllCampaigns())

   Then("the result is the sum of all ad spend")
   totalTotalAdSpend shouldBe allCampaignsToStore.reduce(_.totalAdSpend + _.totalAdSpend)
}

BlogPostBehaviorTest.scala

With this test, we don’t care what campaigns sales were, we don’t care how many campaigns are stored, and we don’t care about any constant value. This test will return the sum of all campaign’s `totalAdSpend` value that we store in the database.

Conclusion:

In this introductory blog post, we explored the someObject testing structure in scala, but this concept is not intended to be language specific. Scala makes this concept easy to implement through the use of Default Parameter Values but in a future post I’ll show how it can be implemented through the Builder Pattern in a language like Java. Another unexplored “someObject” concept is the granularity of control in setting default data. This post introduces the “global” and test specific setting of default data, but doesn’t explore how to set test suite level data for our test objects, and the cases in which that might be useful. I’ll discuss that the future post as well.

Code snippets:

BlogIntro.scala
BlogUpdateFunction.scala
BlogAbstractToSuite.scala
BlogTestWithUniqueTestData.scala
BlogNewConstraint.scala
BlogBasicSomeObject.scala
BlogPostSchemaChange.scala
BlogPostNonBehaviorTest.scala
BlogPostBehaviorTest.scala

Publishing Load Test Results with Jmeter, Jenkins and S3

A while ago, I published a blog post that presented a tutorial overview of how to use Jmeter for load testing a typical RESTful API.

This post builds upon that original post with handy information on some updated reporting features of Jmeter as well a quick dive into how you can better propagate your load results in a continuous build environment (ala Jenkins).

if you’re completely new to Jmeter, please read my previous blog post, linked above before proceeding.

For those of you experienced with Jmeter (hopefully you already have some tests you’re wanting to deploy somewhere rather than let them live contentedly on your local machine), get ready because you’re gonna love this

67295777

It’s truly amazing the gifs you can find on the web.

Meet the New Jmeter, Same as the Old Jmeter (not really)

The previous load test tutorial covered setting up a load test from scratch using an early version of Jmeter.  One of the benefits of using Jmeter, as outlined in the original post was that it has been around for quite a long time, is well known, stable and free.  However, one of the major cons in using Jmeter is that its’ well, old – and has gone for a long while without major updates – especially when it comes to report generation.

Well, welcome to Jmeter 3!  It still comes with that same, great, vintage 90s UI but now with a hoard a bug fixes, stability upgrades and – wait for it – native HTML report generation, wooo!  Check out version 3’s documentation here:

Installation and Setup

So, let’s get down to it!  You can find the latest build of Jmeter 3 here: https://jmeter.apache.org/download_jmeter.cgi

Steps to setting up Jmeter 3 locally are similar to the installation steps covered in my original blog post.  Pre-installation requirements are the same:

  • Java JDK (version 7 or later)
  • Be sure your Java HOME local environment or path variables are set before execution.

Functionally, Jmeter 3 appears identical to older versions of the application but there are a lot of changes under the hood.  I recommend unarchiving and installing Jmeter 3 in its own directory, separate from any previous version of Jmeter you may have previously installed.

Migrating your tests

If you’re following along with this tutorial and wish to create a new load test from scratch, please follow the test setup steps in the original post’s tutorial however, be sure to SKIP the 3rd party report and listener portion of the test setup (guess what, you won’t be needing those plugins anymore).

If you have an existing test you wish to simply fire up in Jmeter 3, your mileage will vary in this case.  Some of the 3rd party listeners and other tools you may have used in your setup may be incompatible with the newer version of Jmeter.  If you have any custom listeners embedded in your test I recommend doing the following:

  • Open your original test in your older version of Jmeter
  • Remove 3rd party listeners, samplers or elements from your test (right-click and select remove)
  • Save the updated test as a new test
  • Open the newly created test in Jmeter 3

From this point, you won’t really need any of your original report listeners configured in your test, however, for debugging purposes, I do recommend keeping a simple response listener in your test – one for successful API responses, another separate for failed responses – just to help with debugging any issues your test might run into.

In a few cases, I’ve found despite removing any 3rd party plugins that some tests have compatibility issues with Jmeter 3.  Sadly, the easiest course of action is to rebuild the test from scratch.  Such is life (sigh).

Such is life...

Such is life…

Executing Tests with Report Generation

Given you have your initial test configured for Jmeter 3, let’s start up the app and view it in the new UI (though it looks like the old UI).  Once you start Jmeter froim the command line, you’ll see a message like this in your terminal:

================================================================================
Don't use GUI mode for load testing, only for Test creation and Test debugging !
For load testing, use NON GUI Mode & adapt Java Heap to your test requirements
================================================================================

You don’t say!?  If you’re a long-time user of earlier version of Jmeter, you’re probably thinking, “Well, no duh!” right?

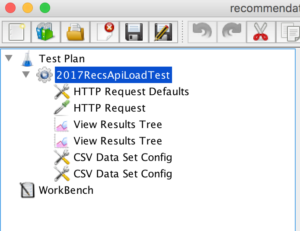
Open your load test in the UI and give it a look-over to make sure its configured the way you intend.  It should be minimal simple thread group, your HTTP samplers, your results tree report and any CSV data resources you might need.

Your test may look something like this

Your test may look something like this

Next, save your test and close Jmeter (we’re now done with the Jmeter UI).

Now, we are going to use Jmeter’s command line interface to execute the load test and generate the report for the test.

Do the following:

Open your CLI terminal and navigate to your Jmeter 3 bin directory.  Execute the following command:

jmeter -n -t <test JMX file> -l <test log file> -e -o <Path to output folder>

Be sure to set the ‘test JMX file’ argument to the path where your load test’s .JMX file resides, relative to the Jmeter bin directory.

The test log file should be an arbitrary log file path/name that currently does not exist.

The output folder path is where your report will be written to.  This must be an empty directory.

A couple of notes:

If you configured your test to run for a set period, just sit back and wait.  The report will be generated in the output directory you provided once the test execution finishes.

If you configured it to run in perpetuity – you will need to formally stop the test before report generation will execute (simply killing your terminal session won’t help you here).

To stop your Jmeter test from the command line, simply open a new terminal window and enter one of the following commands:

Control + . – This stops Jmeter, halting any active listeners.

Control + ,  – This sends a shutdown command to Jmeter – it will wait until all active threads have finished their current tasks before closing shop (this is the recommended method to use unless you’re impatient

or there is an emergency – like, oh you forgot you pointed your test at production).

Are you really going to argue with Chuck?

Are you really going to argue with Chuck?

Once your test has gracefully exited, navigate to the output folder you specified and open your newly minted report in your web browser of choice.

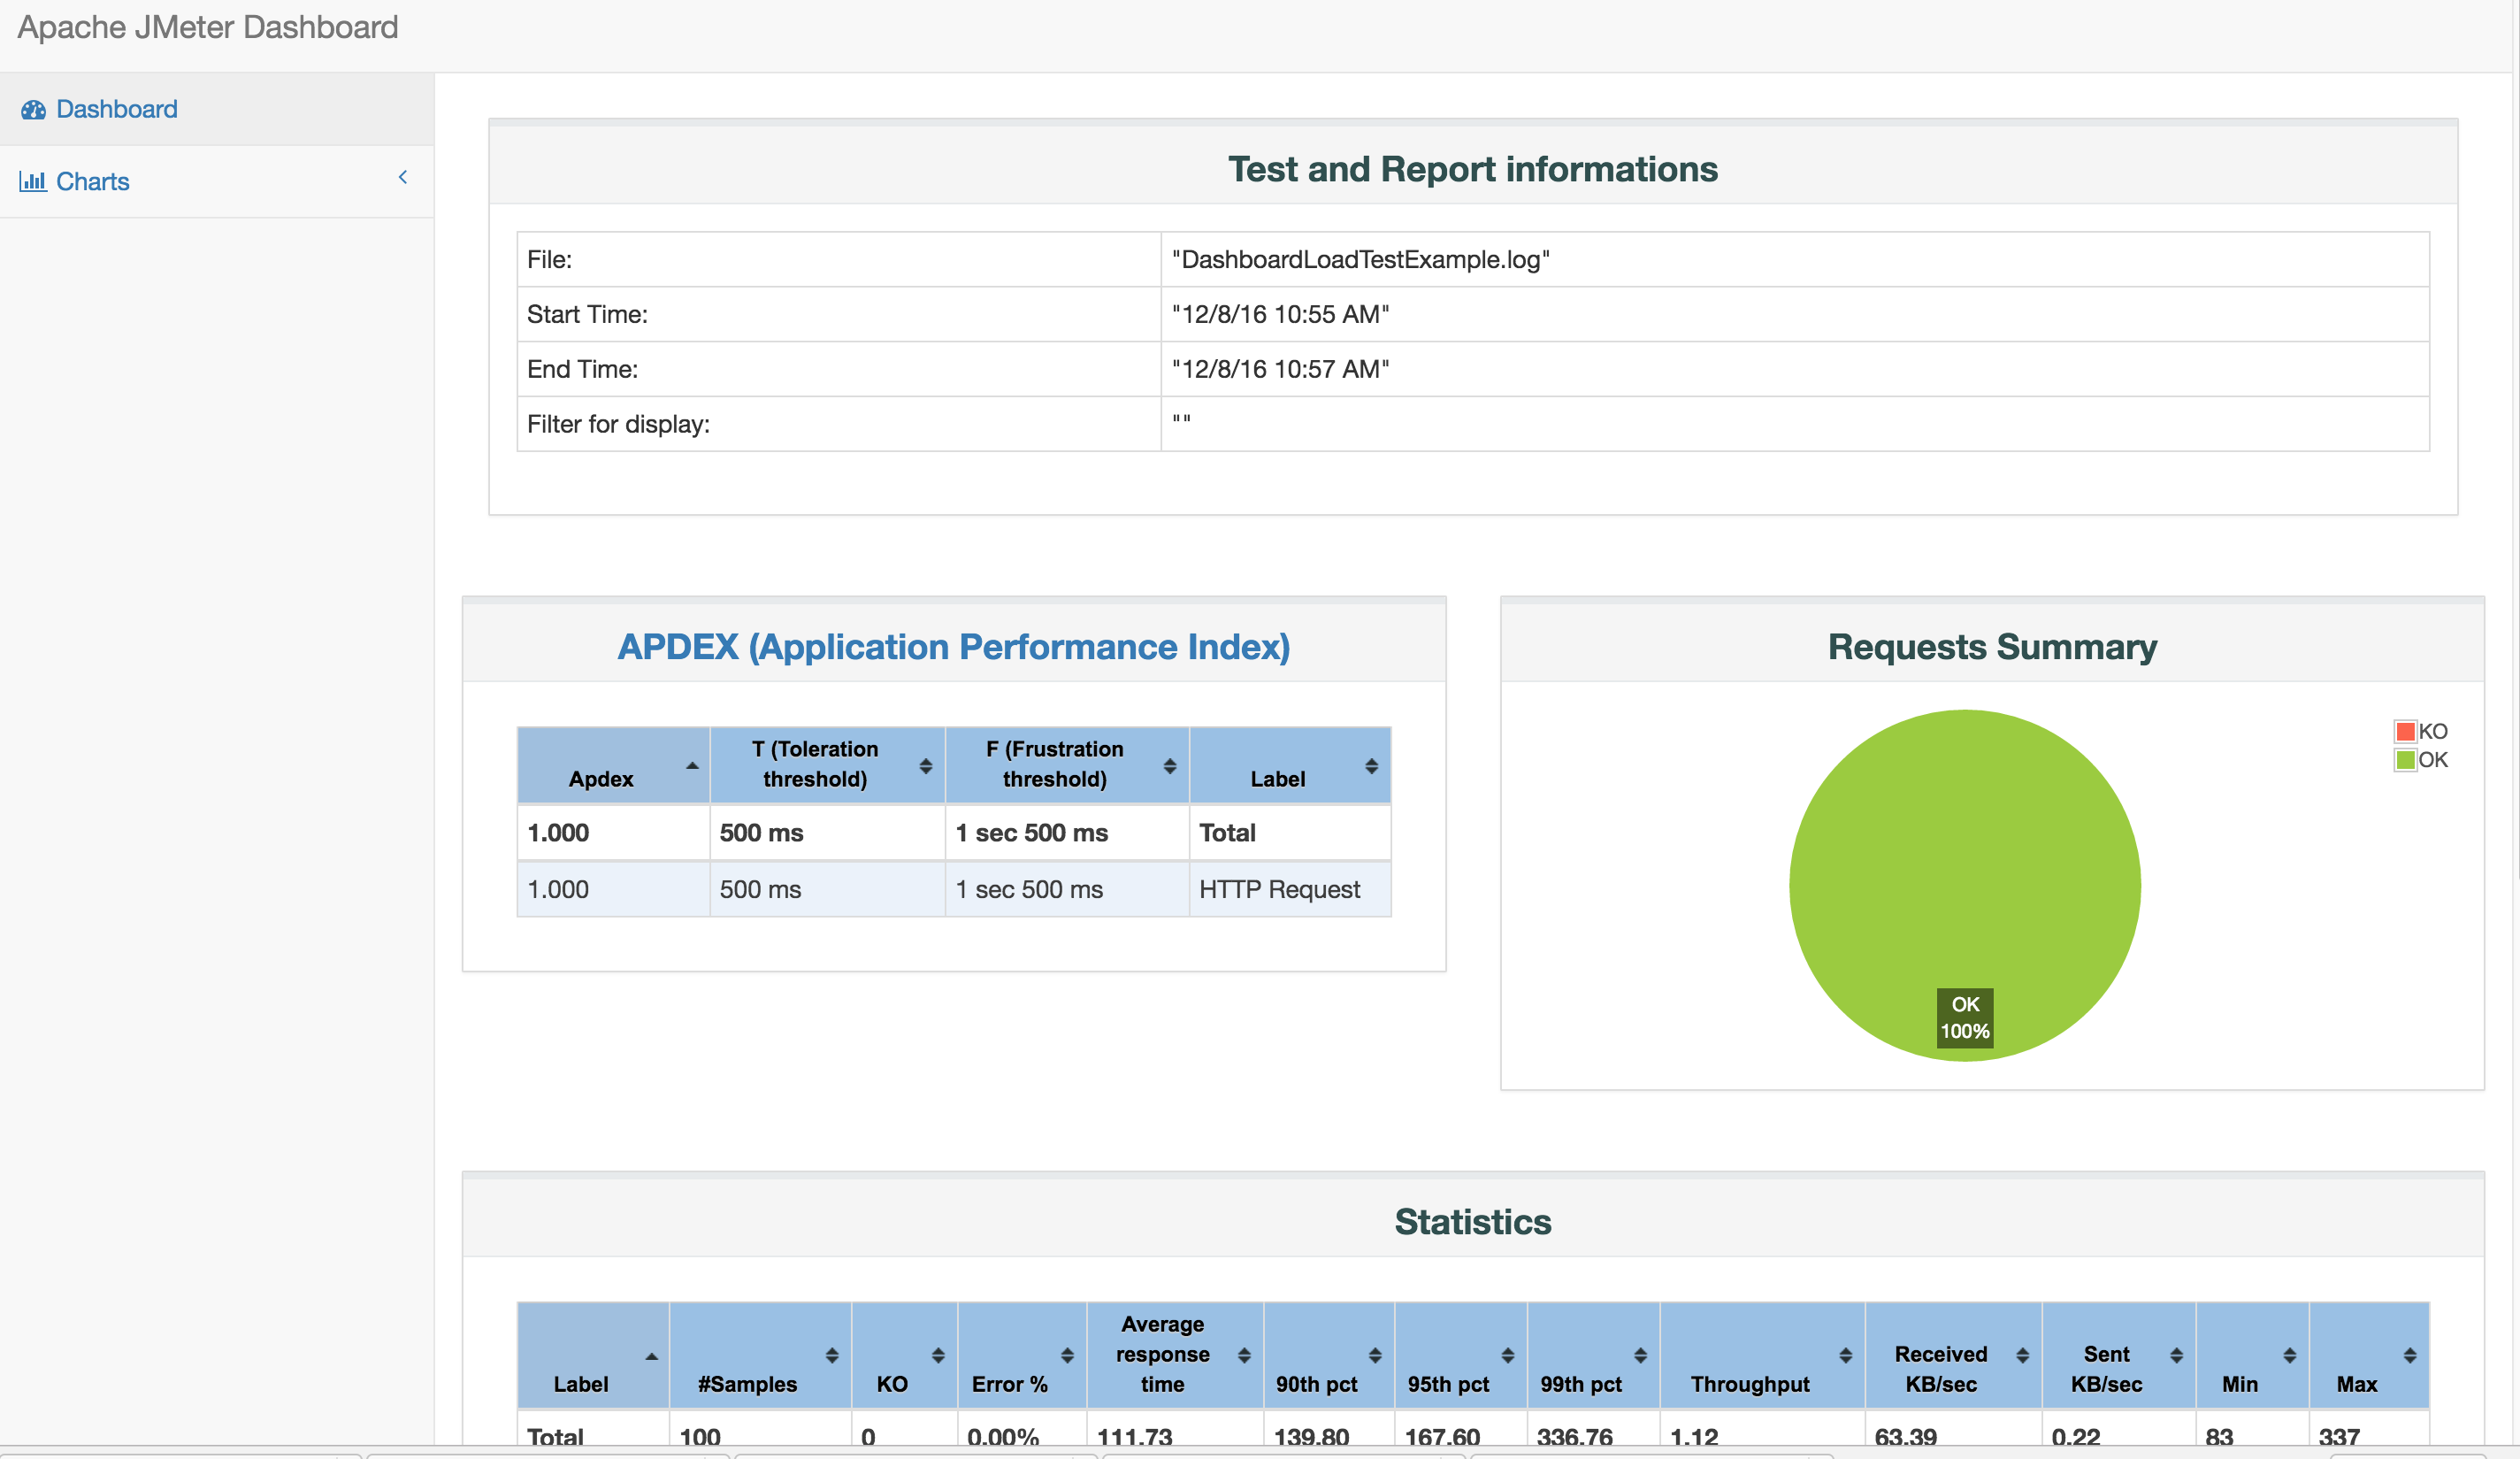
Jmeter 3 HTML report

Jmeter 3 HTML report

Pretty sweet huh?
sxf8ww

If you haven’t seen Jmeter’s dashboard report before, you’re probably thinking, “golly, there’s a lot of stuff here” – and there is.  The dashboard report contains a pretty wide variety of data on your test execution.  Enumerating through all of that here would be exhausting however – if you’re interested in all the gory details of Jmeter’s dashboard metrics, check out this in-depth explanation here:

https://jmeter.apache.org/usermanual/generating-dashboard.html

Show and Tell (mostly show)

So now you have this fancy load test report but hoarding all this metric goodness on your local development workstation is no fun for the rest of your team.  But that’s OK because if you have access to a continuous integration build environment (ala – Jenkins), the rest of this blog post will walk you through taking your Jmeter test and throwing it into a Jenkins build that allows you to not only run your test remotely but also save and propagate your results to the rest of your agile team.

Make your test available

First things first, you’re going to need to take your Jmeter test, get it off your local machine and into some form of web-accessible delivery.  If you have AWS access, you could place your .JMX files and resources into a bucket and be done with it.  In our case, I recommend creating a private Github repository for your tests and committing your Jmeter working directory, tests and resource files to that repository.  There’s a couple of reasons for this:

  • It’s easy to access a given Github repository with Jenkins
  • You can manage updates and versions of your tests just like source code
  • You can manage variants of your load tests using Github’s branch management features

That said, before tossing your tests into Github’s gaping maw, here’s an important note regarding information security:

Depending on your type of load test, you may have some API or other service access keys stored in your test.  You don’t want to check in API or other access keys into your repository (even if it is marked private).  But don’t just take my word for it:

https://softwareengineering.stackexchange.com/questions/205606/strategy-for-keeping-secret-info-such-as-api-keys-out-of-source-control

If you’ve already committed your tests to your repository and you still have some software keys in there and are thinking, “Oh boy… What now!?”, here’s a link to some handy notes on how to extract some sensitive values from your test or code using some handy features of Git:

https://gist.github.com/derzorngottes/3b57edc1f996dddcab25

Getting Up and Running with Jenkins

Jenkins is one of the most widely available CI build tools in use today.  As such, we’re going to cover how to set up a Jenkins task to run your load tests.  If you’re using some other build system (e.g. Team City) this walk-through won’t be as pertinent but essentially, the tasks will be the same.

Step 1: Get access to Jenkins:

Assuming you already have a Jenkins build server of some sort available to your organization – let’s log into it.  If you don’t have access to Jenkins, talk to your friendly neighborhood dev ops engineer.  Note, that for this walkthrough, you’re going to need some level of administrator access to set up everything we need to execute our tests.

Step 2: Create and Setup your Job with Parameters:

Do the following:

  • From the Jenkins home page, choose a directory you wish to run your load test jobs from (or create one).
  • Click the “New Item” link and then choose “Freestyle Project”
  • Give your project a name and description
  • Choose the “This project is parameterized” option – we’ll use parameters to allow you to configure your load test If needed.
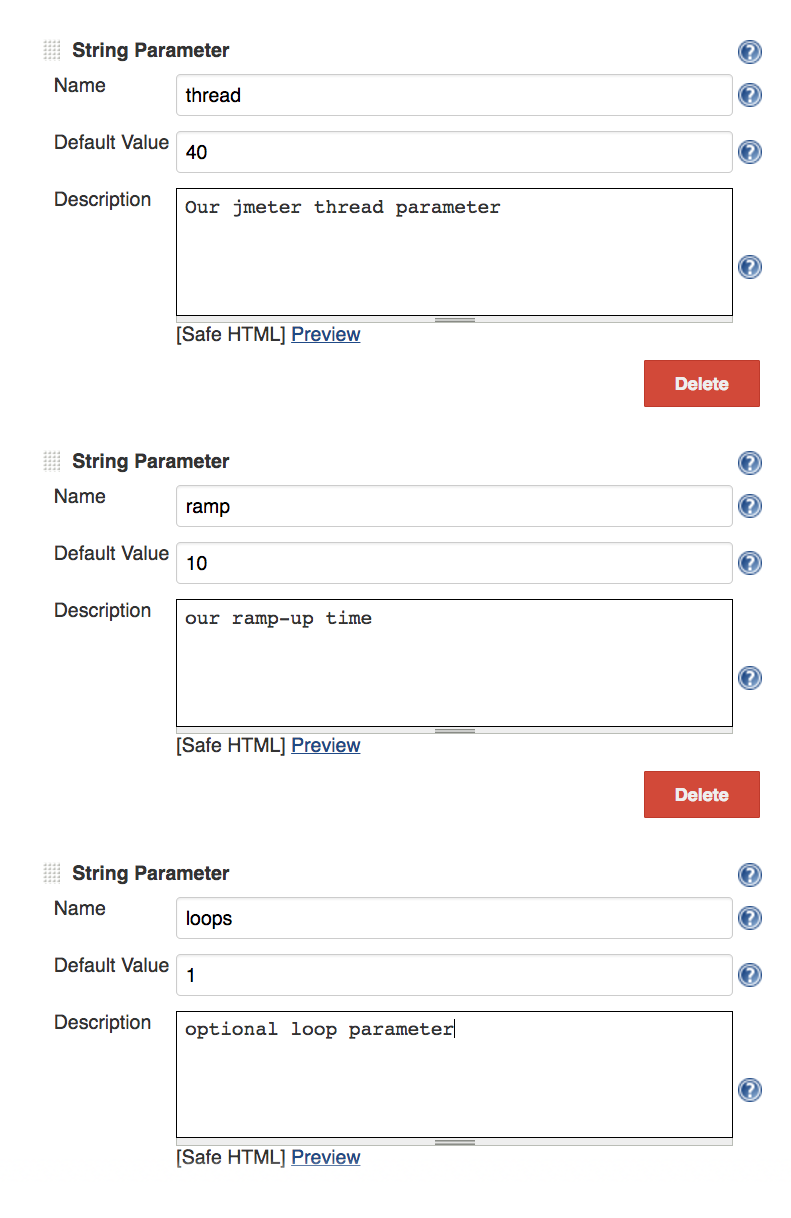
  • Select the “New string parameter” option and create a new parameter named, “thread”
  • Set the default value to whatever you want your test’s default number of threads to be (e.g. 40).
  • Create another string parameter and name it “ramp” – set its default value to the number of seconds you wish your test to take to ramp up to its maximum load.

If your test is going to loop, create another string parameter named, “loops” and set its default, numeric value.

If you have an API key (or keys) you need for your test to execute, as mentioned above, and have already removed said keys from your test (substituting them for a placeholder value) you can create additional string parameters here (naming them key1, key2, etc.).  You can then set your API key(s) to the default value field.  Granted, you are propagating your API key here but this is a much better practice in terms of security than leaving them in a potentially publicly accessible repository as your Jenkins instance should be private and protected.

5dbe72d3d6a5db0d23a62eea640d7c5a_1457280669769jpg-keymaster-gatekeeper-meme_250-250

Step 3: Git Jenkins to Talk to Git:

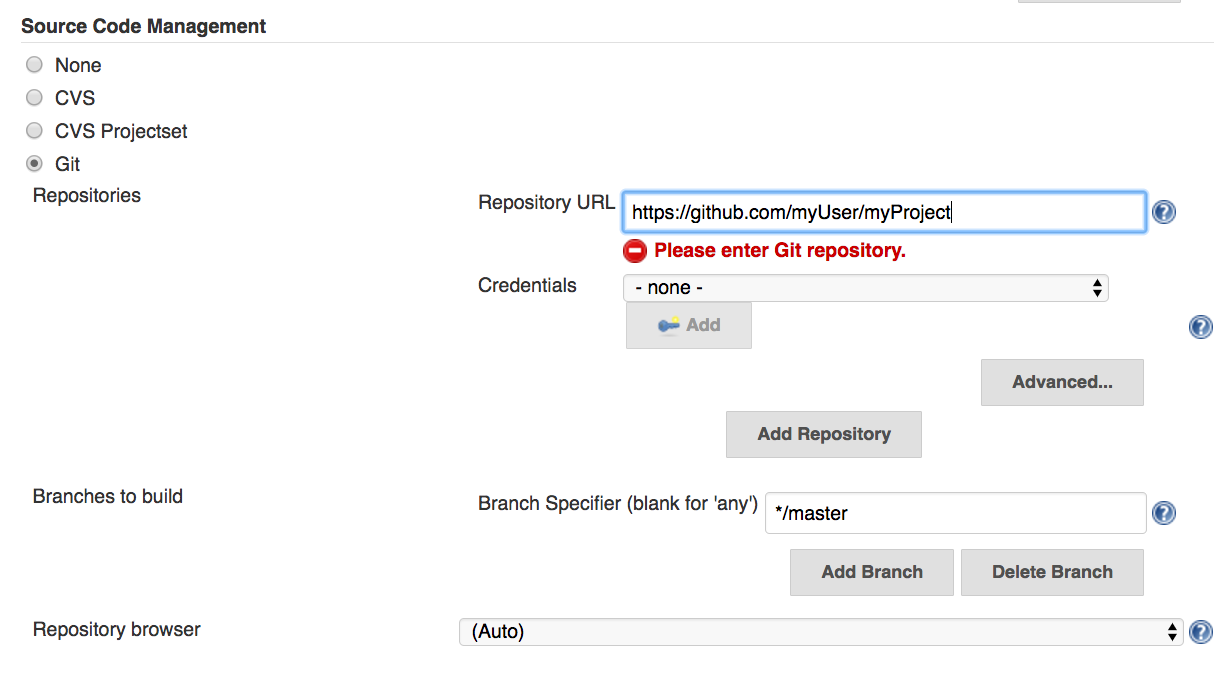
While still in the Jenkins job configuration screen, under the Source Code Management section, select “Git” and enter your repository’s URL alias into the Repository URL field.

If this is your first time doing this, Jenkins expects a specific format for your Github URL strings.  It should look something like this:

https://github.com:<your main repository name>/<your project name>

If you’re using a publicly accessible Github repository, skip the next step, enter your preferred branch name (or */master if you don’t need a specific branch).

Next, select the appropriate credentials option from the relative drop down menu to allow Jenkins to properly introduce itself to your Github repo (if you’re having trouble with this, ask your dev ops engineer or Jenkins server admin for help – and maybe do something nice for them while you’re at it like get them a thank you card or some cookies or something, because at this point, you’d be out of luck without them, right?).

bp4

Step 5: Build Settings:

You can kick off your tests manually however, it’s probably better to set up timer or other method to handle this for you.  Try the following:

Under the Build Triggers heading, check the Build periodically option

Enter your time range you wish the build to trigger at (this will be in Cron notation – which is tricky if you’re seeing this for the first time).

bp5

This article does a decent job explain Cron’s formatting: http://www.nncron.ru/help/EN/working/cron-format.htm

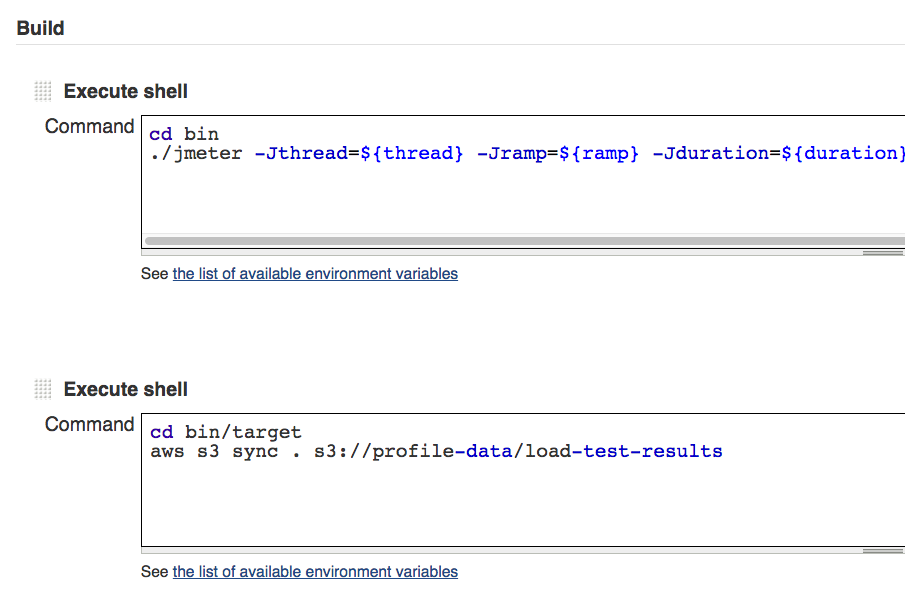
Now, click on the Add build step option and from the dropdown menu, select ‘Execute shell’.

Here, we will define the command we will use to execute the Jmeter test once Jenkins pulls the test resources from Github. This will be like the shell command we used to run Jmeter locally as described above.

bp7

Syncing to Amazon Web Services

Now we need to make sure we’re saving our generated report somewhere so the rest of our team can review it.  Jenkins has a Jmeter performance plugin that can archive our results.  Also, we could just have Jenkins archive the output directory Jmeter generates the report in (though handing all the recursive directories it will build might be a pain).

Given you have an AWS account, you have the options to sync your reports to an AWS bucket and host them like a static web page.  This method would be beneficial if you need to expose your load test results to team members or other parties that do not or should not have access to your build systems (e.g. product manager, support team members, etc.).

If you don’t have access to AWS, aren’t sure you have access to AWS or may have issues with your build server communicating to AWS, once again, now is a fine time to make friends with (*cough* bribe *cough*) your friendly neighborhood dev ops engineer.

Let’s say you’ve taken care of that and you and your dev ops guru are best buddies now.  Next, you’ll need to further configure your Jenkins job by adding another Execute shell build step.  Make sure this one is ordered sequentially after your Jmeter test execution step.

In the Execution shell, simply add a command to change to the output directory your report will be in (defined in your test execution command) and use the AWS sync command to send your HTML report to AWS:

cd bin/target
 aws s3 sync . s3://mybucketroot/mybucketname

Save your Jenkins job.  You’re done (with Jenkins at least).

Now, in the above step, we are assuming you have a bucket already created in AWS where you can sync your data to.  You’re also going to need access to modify how the bucket works in terms of its permissions.

Making Your Test Results Readable from the Web:

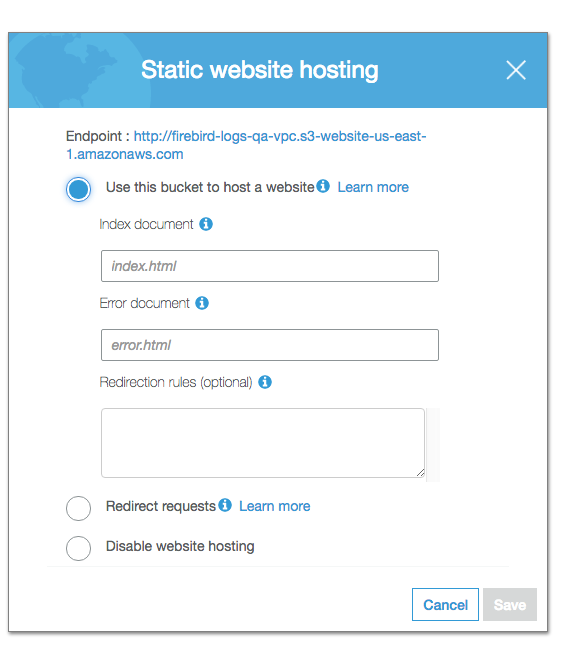
By default, your AWS bucket is out there on the web, you can read from it, write from it, but your other team members will have trouble reading the HTML report from that location.  We need to configure the bucket so that it will display its contents like a static web page.  Here’s how:

Log into your AWS account and access your specified bucket.

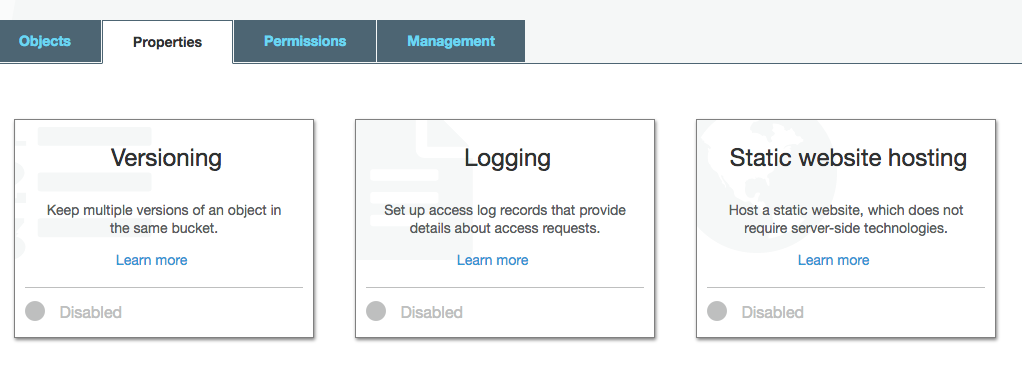
Click on the bucket and select the Properties option

Click the Static website hosting panel

bp9

Enable the static hosting option

Specify your index.html file location (this should be the relative path to the main HTML file for your uploaded report).

bp10

Save your changes and boom – now you’re done.

Save and run your job.  If your account permissions are all set up correctly, your test should execute and the test results will be uploaded to the specified AWS bucket.

From here, simply access your AWS bucket using the following styled web link:

https://s3.amazonaws.com/myBucketRoot/myBucketName

995f09e2e0291e1c61e3d22a62438b95f23395d966984d472eb5b43ea04f76beYour test results should now be viewable just as if they were a static web page by anyone on your team.

Wrapping it Up:

Now that you have your load tests residing in a Github repository, feel free to leverage Github’s branching features to allow you to manage multiple iterations of your load tests:

Commit different variations of the same branch to new branches

Use Jenkin’s copy feature to copy your existing job, and just point it to your different branches to allow you to execute multiple test types.

Use Jmeter’s UI locally to copy/edit your existing tests to make additional iterations.  Save these to your repo and commit them just like you would any other coding project.

Again, use Jenkin’s copy feature to create variations of your test run jobs – this time, just edit your shell command to execute your desired .JMX test file per a given execution.

Thanks for reading and I hope this give you further ideas and insight into how you can leverage Jmeter to further improve your software projects through load testing.

Database Migration

MalcolmInTheMiddleGif

(Always One More Thing…)

Who Are We?

The Ad Management team here at Bazaarvoice grew out of an incubator team. The goal of our incubator is to quickly iterate on ideas, producing prototypes and “proof of concept” projects to be iterated on if they validate a customer need. The project of interest here generates reports based on aggregations of event data gathered from several other teams at the company. As our project gained traction, it grew in size and scope, eventually leading to the need to revisit some of the design decisions made in the prototyping phase. Specifically, we found the original database system we chose, EmoDB, to not meet our needs as our requirements evolved.

Why Migrate?

When this project was started, it began as a prototype designed to get the project rolling as quickly and easily as possible. The initial team chose EmoDB since they were familiar with the in-house technology from their other projects and it fit our initial needs. As the project gained traction, and we had more data to operate against, we encountered scalability issues, initially resolved with caching and some refactoring. We found that we were querying EmoDB as if it were a typical relational database, when it’s not actually designed for that use case. (Emodb is an eventually consistent json blob store with a change notification databus that spans multiple AWS AZs and Regions. EmoDB powers many of our solutions at Bazaarvoice and is now open-source and available at:
https://github.com/bazaarvoice/emodb

We chose to switch to MySql to leverage the Relational Data Model for rolling up aggregations of data we collect and calculate. We ran into problems previously when we retrieved whole documents to perform aggregations on our data, leading us to decide that a technology that is optimized for relational models would suit the project much better.

How to Migrate?

Since our project already had trained users by the time we wanted to migrate database systems, we needed to design our migration with a no-down-time approach; “seamlessly” changing out the back-end implementation for our users. We also made these transitions configurable, such that we wouldn’t need to make one large switch to master from the new system, but we could choose which services were ready to be cut over to the new data back-end.
The following image is our design document that describes how we planned our migration. On the left is our origin code base named “legacy”. On the right was the proposed design for our new service stack for the migration. Inserted into the middle is the “Service Facade” where we intended to run our quality assurance against live data between the legacy technology stack and our new technology stack.

Copy of ad-management migration to MySql based stack - Page 1

How to Maintain Data Consistency?

Depending on the size of the data that is being diffed and migrated between databases, it can be expensive to run the necessary migrations. Our solution was both writing specific tasks that backfilled data or directly migrating data sets to the new data source. This allowed us to smoke test that our services are working, without expending large amounts of time or money finding bugs along the way. As our confidence grew in our custom tooling and services, we would backfill and migrate larger chunks of data, until we had migrated everything necessary to master from our new service.

What is a Service Facade?

The service facade layer is responsible for executing the respective operations out of the legacy and new stacks. This is where we placed our diffing logic to compare the results returned from Emo and Mysql for the same operation. The facade returns data from the pre-defined configured stack. This meant that certain areas of the application could be sourcing from Mysql, while other areas, that we weren’t confident in, continued to source from Emo. For example, our CampaignRoiReportBuilderServiceFacade written in Scala looked something like this:


class CampaignRoiReportBuilderServiceFacade @Inject()(
private val campaignRoiReportBuilderServiceLegacy:CampaignRoiReportBuilderServiceLegacy,
private val campaignRoiReportService:CampaignRoiReportService,
private val campaignConfig: CampaignConfiguration,
private val facadeDiffTool: FacadeDiffTool) {
...
  def buildReport(...): Future[Option[CampaignRoiReport]] = {
    val roiReportFromEmoDbFuture: Future[Option[CampaignRoiReport]] = campaignRoiReportBuilderServiceLegacy.buildReport(...)
    val roiReportFromMySqlFuture: Future[Option[CampaignRoiReport]] = campaignRoiReportService.buildReport(...)

    // Extract data from scala futures
    for {
      roiReportFromEmoDbMaybe &lt;- roiReportFromEmoDbFuture
      roiReportFromMySqlMaybe &lt;- roiReportFromMySqlFuture } { // Pattern Matching to extract values from scala Option (roiReportFromEmoDbMaybe, roiReportFromMySqlMaybe) match { case (None, None) =&gt; //this is an impossible case, but listed to avoid compilation warning
        case (Some(_), None) =&gt; LOG.warn("/*Report missing/mismatched data*/")
        case (None, Some(_)) =&gt; LOG.warn("/*Report missing/mismatched data*/")
        case (Some(roiReportFromEmo),Some(roiReportFromMySql)) =&gt;
          val mismatches = facadeDiffTool.campaignROIReportLegacyDiff(roiReportFromEmo,roiReportFromMySql)
          if(mismatches.nonEmpty)
            LOG.warn("/*Report missing/mismatched data*/")
      }
    }

//This is how we configure what source we return to the resource.
    campaignConfig.masteringFrom match {
      case EmoDb =&gt;
        roiReportFromMySqlFuture.onFailure{
          case e:Throwable =&gt; LOG.warn("Failed to build an ROI report on the MySql side", e)
        }
        roiReportFromEmoDbFuture
      case MySql =&gt;
        roiReportFromEmoDbFuture.onFailure{
          case e:Throwable =&gt; LOG.warn("Failed to build an ROI report on the EmoDb side", e)
        }
        roiReportFromMySqlFuture
    }
  }
}

The original resource classes will be modified to call from the new facade layer, but no other functionality should change. If constructed properly, the facade layer will act in the same way as the original service because the facade mimics the public functions available in the original service class. These duplicated functions will call to the methods from the legacy service class as well as the new service. With the responses from both the legacy and new services, the facade layer can make an assessment on the differences between the two service stacks. To report our differences such that we could be notified during API usage, we would log them out to our log management and monitoring system.

How Did We Capture Mismatches?

Logging was a large concern of ours. We knew that there would be many differences per call while we were debugging our new service stack. As an example, on one call, we reported 2000+ differences. We wanted to compose all differences into one log per call in a meaningful way. For this, we wrote custom diff tooling that would return differences in the data as sets of MismatchedField classes.


case class MismatchedField[T](name: String,
                              legacyValue: T,
                              newValue: T)


This templated class will hold the values returned from both the legacy service (legacyValue), and the new stack’s service (newValue), as well as some meaningful tag with which to identify where this mismatch came from (name). We would then compose all mismatches for any given call into a single log through our custom diff tool. Every function within our custom diff tool returns Set[MismatchedField[Any]]. We can then compose each set into a single set of differences such that we can use only one log call to write out the whole set of differences in one log entry.

An Interesting Finding:

One of the most interesting findings we had through this migration weren’t bugs that came in constructing our new service stack for the new database, but that we found bugs in our original database stack. One take-away from this was to make sure to investigate any mismatches found down to the source data. We found during the code migration process that some of our legacy functionality was written incorrectly. As an example, in our legacy code we were storing some aggregated data in sets, unintentionally masking duplicate data. When re-implementing these same aggregations for our new service stack, they were correctly implemented as a list, producing a mismatch in the data. Through our investigation, instead of simply matching the data to how our legacy service worked, we went back to our origin data, and ran the calculations manually through the Scala REPL. In doing so, we found that the new service was correct, where our legacy code was wrong. Fortunately, the bug within our legacy code was a simple fix. We implemented the fix within the legacy code and our mismatch disappeared.

Other Take-aways:

An important team take-away was to be very upfront and declarative about the work that the migration would require. Our investigation into the migration not only involved setting up a new technology stack for MySql, but also changing our build tool from Maven to SBT, introducing a Flyway + Jooq plugin to enforce type safety throughout the migration, designing a new data model (which was ultimately the driving factor for doing the migration in the first place), as well as upgrading our code up to the newest scala version to leverage all of the previous changes. Ultimately, we severely underestimated, and under-ticketed the work necessary to start our migration.

It is also important to keep in mind that every team is different and has different needs. When having conversations about database migrations, take the time to do a proper risk assessment for the work ahead. Keep these conversations going during the migration as well. As a team, we ended up prioritizing new feature requests and non-migration related bugs because the migration felt orthogonal to our production environment.

A further takeaway is that we could have saved ourselves a lot of time if we had more realistically assessed our users. In retrospect, the users of these reports were internal and would have been more lenient with smaller service outages, which would have allowed us to leverage our configurable services to migrate much sooner. At the expense of stability, we believe that we could have had a quicker migration by forcing ourselves to fix problems forward, instead of maintaining our legacy code for as long as we did. Still, most scenarios don’t have this luxury and we hope the façade based approach is of help to you.

Why the value of hackathons goes beyond free pizza Categories: Culture

bv_hackathon_logo_blue_background-01-copy-1-1024x644

About six months ago, we shared Why We Hackathon. At Bazaarvoice, we host a company-wide hackathon twice a year, and our next one kicks off this week. My previous post primarily focused on the people and company culture aspects of running a hackathon. In lieu of writing “Synergizing Innovation With Disruptive Hackathons”, this time around I’d like to  to share the real value we’ve seen from our hackathons, as well as some ideas on how to realize that value with your own hackathon.

Leveling-up our offerings

If you participate in a hackathon at Bazaarvoice, it is likely that what you create will somehow touch our clients. Many of the products and features we offer today got their start from a hackathon project.

Curations, our social media curation platform, started from one of our public hackathons. Bazaarvoice engineers working with engineers from FeedMagnet, one of the companies invited to participate, created the initial prototype of displaying reviews and social content together. Since then, we’ve put in years of work to build a system that can collect, manage, and display content at tremendous scale, but it all started with that original hackathon project.

Recently, we’ve seen many hackathon projects focused on helping consumers find the perfect product. Most of these took shape as various forms of personalization, like product recommendations, which we’re now offering as a limited-availability product. A different version of this technology is a new capability we’ve been experimenting with called Post Interaction Notification. In short, instead of showing products it thinks someone is interested in, it asks for reviews about products they’ve purchased. You guessed it — also a past hackathon project.

Our successful projects aren’t limited to display-specific projects. Our last hackathon saw projects that used different machine learning technologies to improve our ability to identify relationships across products, shopper profiles, and related consumer-generated content (CGC). For example, one project solved the problem of widely varied product titles and descriptions in our product catalog. If searching for ‘60” Flatscreen TV’, our product matching services would previously only return results that exactly matched those search terms. Now, thanks to the hackathon project, our system understands what 60”, flatscreen,  and TV actually mean. It can then find similar, but semantically different, items like “60 inch Flatscreen Television” or “60in. LCD TV”. This capability dramatically improves our personalization and syndication services by finding the same products across thousands of varied product catalogs.

While not every hackathon project grows into a full-fledged solution, they continually temper and sharpen the direction of our offerings and often improve our clients’ CGC programs.

Improving our client experience

Projects of this variety range from seemingly simple improvements to complex, long term initiatives. One project adored by both our clients and employees (we use these tools too!) was the ability to hop between different client accounts available to the logged-in user in the administration portal; simple, but a big time and frustration saver.

Speaking of administration tools, we’ve been building a new platform to build and deliver consistent tooling across our capabilities. Many of the last hackathon’s projects focused on providing actionable insight into the health of implemented Bazaarvoice capabilities on client’s websites, as well as supporting aspects like product-catalog imports and email-based review solicitation. These projects have shaped the solutions we’re building to proactively communicate the technical health of a client’s CGC program.

hackathon

How we hackathon

Normally, you’ll read “just give people pizza, beer, and games for a few days” as the recipe for a successful hackathon. In my opinion, those things are fantastic additions to any hackathon. However, it’s the people that make a hackathon great. To create success, empower people to find creative solutions to real problems.

We treat product development as a company-wide exercise. Having this sort of inclusive culture means individuals building, supporting,marketing, and selling our solutions are actively involved with client feedback, product feedback, and market opportunity across all of our functions. Providing a few days to create solutions to the problems seen over past months unleashes incredible ideas and creativity.

Secondly, this isn’t a top-down driven event. We involve a handful of hackathon participants and their peers to help plan and execute our hackathons. They make sure every activity, piece of swag, and communication is planned and ready to grow and sustain a big list of happy attendees. After all, the primary focus of the event to create space and time to be creative, have fun, and build stronger relationships.

Logistically, we made a change last hackathon that greatly improved the involvement from employees who weren’t participating on a hackathon team.It can be a bit challenging to stay focused with 50 teams demoing projects on stage one after the other, let alone remembering what you liked most in the final voting. Instead, we tried a science-fair style demo to promote walking around, engaging with various teams, and “investing” in the most promising projects using tickets. This boosted participation from those that aren’t interested in hacking, but who are interested in seeing and voting in the end results. This month’s hackathon we’ve got trifold panels, glue sticks, and markers to really get into the science fair spirit.

Synergizing innovation with disruptive hackathons

It’s not about buzzwords and forced team bonding. If you’re looking to run a hackathon, focus on the people — both those on hackathon teams and those who just want to spectate. If you’re looking to participate in a hackathon, try to find a real problem to solve. Regardless of your role, you’ll be pleasantly surprised at the creative, brilliant output. And at the very least, you’ll get some free pizza. 

Context and Higher Order Components: Two Immediately Applicable Topics from the Advanced React Workshop

Thanks to Bazaarvoice I recently attended an “Advanced React Workshop” put on by React Training and taught by Ryan Florence, one of the creators of React Router.

Ryan was an engaging teacher and the workshop was filled with memorable quotes. Here are some highlights:

  • The great conundrum of accessibility is that learning it is not accessible.
  • Like forceUpdate, never use context alone. Always bring a friend with you.
  • Good abstractions can always recreate other abstractions.
  • Is that a Justin Beiber song?

The training took place over two days in East Austin and I learned a ton of stuff that I was able to immediately put to use in my day-to-day projects. Let’s dive right in.

Context

In addition to the familiar props and state, React components also have access to a magical thing called context.

Context is for when your application has a hierarchical structure and needs to pass data from a parent component down to another level of child component (child, grandchild, great grandchild, etc.). As the React documentation puts it,

“In some cases, you want to pass data through the component tree without having to pass the props down manually at every level. You can do this directly in React with the powerful “context” API.”

Before we move on to the context API itself, let’s make it a little more clear why you would want to use it.

Consider the previous example of a parent node with a child, grandchild, and great grandchild. In order for the parent to pass a property (via props) down to the great-grandchild, it would first need to pass the property through child and grandchild. Note that there is no other reason for child and grandchild to care about that property.

As you can imagine, the desire to eliminate this kind of cruft increases as your project grows in size and complexity.

Context to the Rescue

context helps by passing properties through the tree automatically and any component in the subtree can access them.

When Your Component is Providing Context

Components (like parent in the example above) define a static childContextTypes object that defines the properties that they will put on context. childContextTypes is very similar to the propTypes object that we’re already familiar with.

Additionally, components that are putting properties on context must actually provide their values, and do so via the getChildContext component member function. This function should return an object with the same structure as defined in childContextTypes.

For example:

// Parent.js

static childContextTypes = {
  rating: React.PropTypes.string
}

// Just like a React lifecycle method.
// Don't worry about when this actually gets called.
getChildContext () {
  return {
    rating: '4.5'
  }
}

When Your Component is Consuming Context

To continue the example, your great-grandchild component now must consume this property. It can do so by defining a static contextTypes object that describes the context properties it expects, and can then pull the properties off of this.context directly.

// GreatGrandchild.js

static contextTypes {
  rating: React.PropTypes.string
}

render () {
  const { rating } = this.context;
  // Do stuff with rating.
}

Common Use Cases

Great use cases for context include localization, theming, etc. Basically any time you have things you don’t want to have to pass down through a bunch of components that don’t need to know about them. In fact, React Redux uses context to make its store available to all of your project’s components – imagine how cumbersome it would be to pass the store to every single component!

Common Pitfalls

Name collisions is a common pitfall. Consider the case where a component that has both a parent and grand parent component that provide a rating property on context. The suggested workaround in this case is to name your context after your component:

class ParentComponent extends React.Component {
  static childContextTypes = {
    parentComponent: React.PropTypes.shape({
      rating: React.PropTypes.string
    })
  }
}

class GrandParentComponent extends React.Component {
  static childContextTypes = {
    grandParentComponent: React.PropTypes.shape({
      rating: React.PropTypes.string
    })
  }
}

Then your child component could differentiate the two: this.context.parentComponent.rating versus this.context.grandParentComponent.rating.

User Beware!

A post about context would not be complete without pointing out that the very first section in React’s documentation about context is titled “Why Not To Use Context”, and it includes dire warnings like:
“If you want your application to be stable, don’t use context.”, and “It [Context] is an experimental API and it is likely to break in future releases of React.”

Ryan did point out to us however, that even though the documentation warns that the Context API is likely to change, it is one of the only React APIs that has stayed constant 😛

Higher Order Components

In software, a higher order function is a function that returns another function. Consider:

function add (x) {
  return function (y) {
    return x + y;
  }
}

const addBy2 = add(2);

addBy2(10); // 12

Similarly, a Higher Order Component is a function that returns a (React) Component.

/**
 * A higher order component that facilitates the creation of
 * container components that simply wrap divs around their children.
 *
 * @param  {String} displayName - The displayName of the returned component.
 * @param  {String} className   - The class name to use for the wrapper div.
 * @return {Component}          - A React component.
 */
export function build(displayName, className) {
  const ContainerComponent = (props) => (
    <div className={className}>{ props.children }</div>
  )

  ContainerComponent.displayName = displayName;
  ContainerComponent.propTypes = {
    children: React.PropTypes.node
  };

  return ContainerComponent; 
}

// Usage:
export const WidgetHeader = build('WidgetHeader', 'bv_header');
export const WidgetBody = build('WidgetBody', 'bv_body');
export const WidgetFooter = build('WidgetFooter', 'bv_footer');

Higher Order Components are great for reducing redundancy across components, and can also be used to “wrap up” a lot of complexity and encapsulate it, which allows the rest of your components to stay simple and straightforward. If you were familiar with the old React mixins, Higher Order Components replace a lot of what mixins did.

That’s All, Folks!

Context and Higher Order Components are just two topics I was able to immediately integrate into my React projects here at Bazaarvoice. Hopefully you will find them useful too!

My Hacktoberfest

This past October I participated in an awesome Open Source event called “Hacktoberfest”, sponsored by Digital Ocean and GitHub.

Hacktoberfest is a month-long celebration of Open Source where developers are encouraged to contribute to the community. Participation is easy:

  1. Pull requests can be made in any GitHub-hosted repositories/projects.
  2. A contribution can be anything—fixing bugs, creating new features, or updating and writing documentation.

Further, if you opened four pull requests in Open Source repositories between October 1st and October 31st you would win a cool Hacktoberfest t-shirt and other swag.

Maintainers of Open Source projects (including some here at BV) were asked to tag open issues with “Hacktoberfest” if they wanted help with that issue during the event. GitHub provides the ability to search issues based tags, so it was really easy to find cool projects and issues to work on.

I personally started off small, helping one team track down a bug with their JSON files, and another finish a database for movies used by their front-end application (similar to IMDB).

Next I found a Hacktoberfest issue in the the New York Times’s kyt repository. Kyt is a build, test and development tool for advanced JavaScript apps. I ended up helping them fix a bug in one of their setup scripts.

Then came my Hacktoberfest pièce de résistance.

In my 20% time here at Bazaarvoice I had been playing around with browser extensions / add-ons, specifically in an effort to make implementing our products easier for our clients. So when I saw that Mozilla and the Mozilla Developer Network (MDN) were asking for someone to create a browser extension for them, I was immediately interested.

They noticed that a popular type of extension being authored was what they were calling a “replacement” add-on, something that would replace words or phrases in a web page with alternate words, or images, etc.

In their Web Extensions Examples repository, they were looking for an example of such an add-on that they could turn into a “How to Write your First Add-On” tutorial. Thus their two main requirements were:

  1. The code must be simple and easy to follow for beginners.
  2. The code must be performant because it would likely be copied a lot.

Seeing as how readability and performance are two of the main things that we check for in every code review here at Bazaarvoice, this was right up my alley!

I was so excited that I stayed up all weekend to finish the project:

I submitted my pull request, worked with the developers at Mozilla, and was so proud when my Emoji Substitution contribution was merged into their repository. What a rush!

As we traded Hacktoberfest-themed emoji (???? and ???? were my favorites), fixed bugs, and fleshed out their projects, it was really cool to lend my expertise and experience the gratitude of all the teams I worked with – this is what Open Source is all about!

I had a great time participating in Hacktoberfest this year and will definitely do it again next year. You should join me!

I want to be a UX Designer. Where do I start?

So many folks are wonder what they need to do to make a career of User Experience Design. As someone who interviewed many designers before, I’d say the only gate between you and a career in UX that really matters is your portfolio. Tech moves too fast and is too competitive to worry about tenure and experience and degrees. If you can bring it, you’re in!

That doesn’t mean school is a waste of time, though. Some of the best UX Design candidates I’ve interviewed came from Carnegie Mellon. We have a UX Research intern from the University of Texas on staff right now, and I’m blown away by her knowledge and talent. A good academic program can help you skip a lot of trial-by-fire and learning things the painful way. But most of all, a good academic program can feed you projects to use as samples in your portfolio. But goodness, choose your school carefully! I’ve also felt so bad for another candidate whose professors obviously had no idea what they were talking about.

Okay, so that portfolio… what should it demonstrate? What sorts of samples should it include? Well, that depends on what sort of UX Designer you want to be.

Below is a list of to-dos, but before you jump into your project, I strongly suggest forming a little product team. Your product team can be your your knitting circle, your best friend and next-best-friend, a fellow UX-hopeful. It doesn’t really matter so long as your team is comprised of humans.

I make this suggestion because I’ve observed that many UX students actually have projects under their belt, but they are mostly homework assignments they did solo. So they are going through the motions of producing journey maps, etc., but without really knowing why. So then they imagine to themselves that these deliverables are instructions. This is how UX Designers instruct engineers on what to do. Nope.

The truth is, deliverables like journey maps and persona charts and wireframes help other people instruct us. In real life, you’ll work with a team of engineers, and those folks must have opportunites to influence the design; otherwise, they won’t believe in it. And they won’t put their heart and soul into building it. And your mockups will look great, and the final product will be a mess of excuses.

So, if you can demonstrate to a hiring manager that you know how to collaborate, dang. You are ahead of the pack. So round up your jackass friends, come up with a fun team name, and…

If you want to be a UX Researcher,

Demonstrate product discovery.

  • Identify a market you want to affect, for example, people who walk their dogs.
  • Interview potential customers. Learn what they do, how they go about doing it, and how they feel at each step. (Look up “user journey” and “user experience map”)
  • Organize customers into categories based on their behaviors. (Look up “personas”)
  • Determine which persona(s) you can help the most.
  • Identify major pain points in their journey.
  • Brainstorm how you can solve these pain points with technology.

Demonstrate collaboration.

  • Allow the customers you interview to influence your understanding of the problem.
  • Invite others to help you identify pain points.
  • Invite others to help you brainstorms solutions.

If you want to be a UI designer,

Demonstrate ideation.

  • Brainstorm multiple ways to solve a problem
  • Choose the most compelling/feasible solution.
  • Sketch various ways that solution could be executed.
  • Pick the best concept and wireframe the most basic workflow. (Look up “hero flow”
  • Be aware of the assumptions your concept is based upon. Know that if you cannot validate them, you might need to go back to the drawing board. (Look up “product pivoting”)

Demonstrate collaboration.

  • Invite other people to help you brainstorm.
  • Let others vote on which concept to pursue.
  • Use a whiteboard to come up with the execution plan together.
  • Share your wireframes with potential customers and to see if the concept actually resonates with them.

If you want to be an IX Designer and Information Architect,

Demonstrate prototyping skill.

  • Build a prototype. The type of prototype depends on what you want to test. If you are trying to figure out how to organize the screens in your app, just labeled cards would work. (Look up “card sorting). If you want to test interactions, a coded version of the app with dummy content is nice, but clickable wireframes might be sufficient.
  • Plan your test. List the fundamental tasks people must be able to perform for your app to even make sense.
  • Correct the aspects of your design that throw people off or confuse people.

Demonstrate collaboration.

  • Allow customers to test-drive your prototype. (Look up “usability testing”)
  • Ask others to help you think of the best ways to revise your design based on the usability test results.

If you want to be a visual designer,

Demonstrate that you are paying attention.

  • Collect inspiration and media that you think your customers would like. Hit up dribbble and muzli and medium and behance and google image search and, and, and.
  • Organize all this media by mood: the pale ones, the punchy ones, the fun ones, whatever.
  • Pick the mood that matches the way you want people to feel when they use your app.
  • Style the wireframes with colors and graphics to match that mood.
  • Bonus: create a marketing page, a logo, business cards, and other graphic design assets that show big thinking.

Demonstrate collaboration.

  • Ask customers what media and inspiration they like. Let them help you collect materials.
  • Ask customers how your mood boards make them feel, in their own words.

Whew! That’s a lot of work! I know. At the very least, school buys you time to do all this stuff. And it’s totally okay to focus on just UX Research or just Visual Design and bill yourself as a specialist. Anyway, if you honestly enjoy UX Design, it will feel like playing. And remember to give your brain breaks once in a while. Go outside and ride your bike; it’ll help you keep your creative energy high.

Hope that helps, and good luck!

This article was originally published on Medium, “How to I break into UX Design?

As a software engineer, how do I change my career to DevOps?

At Bazaarvoice, we’re big fans of cloud. Real big. We’re also fans of DevOps. There’s been a lot of discussion over the past several years about “What is DevOps?” Usually, this term is used to describe Systems Engineers and Site Reliability Engineers (sometimes called Infrastructure Engineers, Systems Engineers, Operations Engineers or, in the most unfortunate case, Systems Administrators, which is an entirely different job!). This is not what DevOps means, but in the context of career development, it carries the connotation of a “modern” Systems or Site Reliability Engineer.

There’s a lot of great literature about what a DevOps engineer is. I encourage you to read this interview of Google’s VP of Engineering, as well as Hixson and Beyer’s excellent paper on Systems Engineering and its distinction among Software, Systems and Site Reliability engineers. Although DevOps engineering goes beyond these technical descriptions, I’ll save that exegesis for another time. (Write me if you want to hear it, though!)

Many companies claim to hire or employ DevOps engineers. Few actually do. Bazaarvoice does. Google does, too, although they’re very hipster about it (they called it Site Reliability Engineering before the term DevOps landed on the scene, so they don’t call it DevOps because they had it before it was cool, or something). I don’t know about other companies because I haven’t worked at them (well, I haven’t worked at Google either, but they are pretty vocal about their engineering philosophies, so I’ll take them at their word). But there’s a lot of industry buzzwordium with little substance. This isn’t a jab at other companies (but really, Bazaarvoice is way cooler), it’s just a side-effect of assigning job titles based on pop culture. If you’re really a DevOps engineer, then you already know all of this, and you probably filter out a lot of this nonsense on a daily basis.

But we’re here to answer a specific question: If I’m already a software engineer, how do I become a DevOps engineer?

So, you’re a developer and you want to get in on the ops action. Boy, are you in for a surprise! This isn’t about installing Arch Linux and learning to write Perl. There’s a place for that kind of thing (a very small, dark place in a very distant corner of the universe), but that isn’t inherently what DevOps means.

Let’s consider a few of the properties and responsibilities of DevOps engineering.

A DevOps engineer:

  • Writes code / software. In fact, he is a proper software engineer.
  • Builds tools.
  • Does the painful things, as often and frequently as possible.
  • Participates in the on-call rotation (yes, for 2 a.m. production outages).
  • Infrastructure design.
  • Scaling systems (any system or subsystem — networking, applications, load balancers).
  • Maintenance. Like rebooting that frail vhost with a memory leak that no one’s bothered to fix or take ownership of.
  • Monitoring.
  • Virtualization.
  • Agile/kanban/whatever development methodology. It’s not so much that agile is “right.” It’s just the most efficient way to complete a work queue (taking into account interruptions and blockers). A good DevOps engineer has strong opinions about this!
  • Software release cycles and management. In fact, you might even see “development methodology” and software release cycles as the same thing.
  • Automation. Automation. Automation.
  • Designing a branch/release strategy for the provided SCM (git, Mercurial, svn, etc). Which you do have.
  • Metrics / reporting. Goes hand-in-hand with monitoring, although they are different.
  • Optimization / tuning. Of applications, tools, services, hardware…anything.
  • Load and performance testing and benchmarking, including performance testing of highly complex systems. And you know the difference between load testing and performance testing.
  • Cloud. Okay, you don’t really have to have cloud experience, but it can fundamentally change the way you think about complex systems. No one in a colo facility devised the notion of “immutable infrastructure.”
  • Configuration management. Or not. You have an opinion about it. (You’ve surely heard of Puppet, Chef, Ansible, etc. Yes?)
  • Security. At every layer.
  • Load balancing / proxying / replicating. (Of services, systems, components and processes.)
  • Command-line fu. A DevOps engineer is familiar with tools at his disposal for debugging, diagnosing and fixing issues on one or many servers, quickly. You know how pipes work, and you can count how many records contained some phrase in a log file with ease, for example.
  • Package management.
  • CI/CIT/CD — continuous integration, continuous integration testing, and continuous deployment. This is the closest thing to the real meaning of “DevOps” that a Systems Engineer will do.
  • Databases. All of them. SQL, NoSQL, whatever. Distributed ones, too!
  • Solid systems expertise. We’re talking about the networking stack, how hard disks work, how filesystems work, how system memory works, how CPU’s work, and how all these things come together. This is the traditional “operations” expertise you’ve heard about.

Phew! That’s a lot. Turns out, almost all of these skills are directly applicable to software engineering. The only difference is the breadth of domain, but a good software engineer will grow his breadth of domain expertise into operations naturally anyway! A DevOps engineer just starts his growth from a different side of the engineering career map.

Let’s stop and think for a moment about some things DevOps engineer is not. These details are critically important!

A DevOps engineer is not:

  • Easier than being a software engineer. (Ding! It is being a software engineer.)
  • Never writing code. I write tons of code.
  • Installing Linux and never touching your favorite OS again.
  • Working the third shift. (At least, it shouldn’t be; if it is, quit your job and come work with me.)
  • Inherently more “fun” than being a software engineer, although you may prefer it, if you’re into that kind of thing.
  • Greenfield. You’ll deal with old stuff in addition to new stuff. But as a good engineer, you care about business value and pragmatism.
  • An unsuccessful software engineer. Really: if you can’t write code, don’t expect to be a good DevOps engineer until you can.

A career shift

Here are a few things you should do to begin positioning yourself as a DevOps engineer.

  • Realize that you’re already an engineer, so becoming a DevOps engineer means you are just moving yourself to a different domain to grow and learn from a different direction.
  • Interview at a company that’s hiring DevOps. If you get hired, you’ll learn the operations side of things fast. Real fast. Or get fired. (Hint: you should disclose your experience honestly!) If you don’t get hired, you’ll learn what is still missing from your resume / experience that’s preventing you from becoming a full-time DevOps engineer. Incidentally, we’re hiring. 🙂
  • Tell your boss you want to become a DevOps engineer at your company. Your boss should help you to this end. If he/she does not, quit. Then come work at Bazaarvoice with me and a bunch of really awesome, super talented engineers working on some really awesome and challenging problems.
  • Obtain practical experience by using your skills as a software engineer to build tools rather than applications. Look at any of the open source projects Netflix has written for examples / ideas.
  • Learn OpenStack or some equivalent infrastructure-level project. (OpenStack has tremendous breadth, which is why I recommend it.) You can do this on your own time and budget. It’s not important whether OpenStack sucks compared to Rackspace Cloud. What’s important is that you understand all of the various components and why they are important. Have a wad of cash lying around? Learn Amazon Web Services or Google Compute Engine instead.
  • Bonus: learn about Apache Mesos and Kubernetes, and why they’re useful / important. Using them is less important than understanding them.
  • Participate in anything your team does involving operations — deployment, scale, etc. (See list above: “What DevOps is.”) If your team doesn’t do any of that (i.e., they send artifacts over to Operations and the Operations team does deployment), go over to the Operations team and sit in on a few deployments. You may be surprised!

Do I need to have deep operations experience to become a good devops engineer?

I’ve asked myself the same question. I come from a development background myself and only had less than a year of experience dealing with operations (part time) before becoming a DevOps engineer. (Granted, I had a referral vouching for me, which weighed in my favor.) Despite my less-than-stellar CS/algorithm skills (based on my complete lack of formal computer science education), I’ve had enough experience writing software that I could apply these concepts to systems in a similar fashion. That is, in the same way a software engineer needs to understand at what point his application code should be abstracted in support of future changes (i.e., refactored into smaller components), a DevOps engineer needs to understand at what point a component of his infrastructure should be abstracted in support of future changes (i.e., rebuilding all of his servers and rearchitecting infrastructure that’s already in production, despite the potential risk, in order to solve a problem, like allowing the architecture to scale to business needs). At its core, a good engineer is just as good whether he’s writing software or deploying it. Understanding complex systems and their interactions is a critical skill. But all of these are important for software engineers, whether you’re writing application code or not!

I hope this post helps you in your endeavor to become a DevOps engineer, or at least understand what it means to be a DevOps engineer at Bazaarvoice (as I said before, it may mean something totally different at other companies!). You should get your feet wet with some of the things we do. If it gets you tingly and excited, then come work with me at Bazaarvoice: http://www.bazaarvoice.com/careers/research-and-development/.


This article was originally posted as an answer on Quora. Due to surprising popularity, I’ve updated the article and posted it here.

Cross-Platform Mobile SDK Testing

This Bazaarvoice blog entry is co-authored by Tanvir Pathan as part of a Bazaarvoice internship project on the Bazaarvoice Mobile Team.

Automated testing of native mobile applications has long been a pain point in the world of mobile app development. If you are creating and distributing apps or open source SDKs across two or more major platforms (Android and iOS in our case), you can easily find yourself duplicating efforts to test the same source and business logic across different technology stacks. For example, if you have experienced developers and testers using Xcode for iOS apps, they may tend to automate testing with Instruments Automation, where Android developers and testers may automate with Espresso or UIAutomator. This becomes an expensive proposition for development and maintenance of unit tests, which can be costly as your test coverage increases.

Test strategy can also vary depending on the type of mobile app development your shop pursues: native, hybrid, cross-compile, mobile web. Hence, the selection of test tools will vary depending on how you build and deploy apps.

In this blog post, we’ll detail a novel solution to cross-platform testing of our native SDKs, along with some background of other mobile tool offerings. Our solution focuses on cross-platform open source mobile SDK testing utilizing Cordova to wrap our SDKs in a generic JavaScript interface, and Calabash to drive our cross-platform behavioral tests.

If you want to check out the full solution, the Cordova plugin and description on how to execute Calabash can be found in our Github repository.

How to View Mobile Application Development

Non-mobile app developers typically don’t actually know the difference between a web app, native, or hybrid app. If you work in any business that supports some kind of mobile solution (and you probably wouldn’t be reading this if you didn’t) it’s really important to understand some fundamental differences. It’s very easy to just throw out the word “mobile” in conversation and not realize there’s multiple parts to this elephant!

blindmen

The table below presents four general categories of mobile application development. Keep these categories in mind when talking about “mobile” in general and don’t fall in the trap of the blind men and the elephant.

Mobile Development Types & Tools

Type
Description
Tools
Native Application Development Developers creating purely native apps will write in the language supported by their target platform. For iOS apps, developers can write in Swift and/or Objective-C, while Android developers can write in Java (and C/C++ for lower level execution)
Cross-compilation Developers can also write apps for multiple platforms in a single language, such as Java Script. Cross-compilation tools will take a common language and actually convert it to the target language of the native platform. In this case, while developers aren’t writing in the native language, the tools create real native apps. Some of the most common tools are: Appcelerator (JavaScript), Xamarin (C#), React Native (Java Script)
Hybrid Applications Hybrid apps utilize Web Views to display content, typically written with common web development technologies such as Java Script, HTML, and CSS. Hybrid apps will typically have a “bridge” that allows javascript code to communicate with the native libraries to do things like access the camera, location services, or contacts. Cordova (aka PhoneGap) as the application container. Developers choose their favorite UI layer to work with Corodva: ionic, Sencha Touch, jQuery Mobile, Onsen, Framework 7.
Web Applications / Mobile Web A web application isn’t as much an application as it is a mobile optimized web site. Hence, you won’t find a Web Application in the App or Google Play Store, you just fire up your favorite mobile web browser and load the site.

Cross Platform Mobile UI Testing Tools

When developing for native mobile, developers will typically write unit tests to check individual pieces of functionality and business logic, perhaps even employ certain mocking techniques to test networking and user interface capabilities without the need for a full application. However, when it comes to full system testing of full applications and SDKs, making the right selection can be a tough process. However, if cross-platform testing is your objective and you want to write all your tests in one common scripting language, the options narrow quickly.

While there are platform-specific UI automation frameworks for Android (Robotium, UiAutomation) and iOS (Instruments Automation, Keep It Functional, EarlGrey), there currently only two (that we are aware of) that allow us to test cross-platform with a common script.

Tool
Summary
Appium Appium lets developers write tests for applications without having to add any additional code the applications. It works with native, hybrid, and mobile web applications.
Calabash Calabash is owned and maintained by Xamarin, and provides cross-platform testing for native or hybrid apps. Unit tests can be written in Ruby with Cucumber.

2 Birds, One Stone

kill2birds3

Making the decision to use Cordova and Calabash was fairly easy. First we already distribute our BBVSD via frameworks and libraries for iOS and Android. Second we know some of our customers are creating hybrid applications with Corodva. So we immediately thought: what if we could create a test environment that not only tests our SDK deliverables, but also provides our clients with an easy avenue to integrate Bazaarvoice services into their own Cordova app. Win! Win! As well, because we already use Cucumber extensively at Bazaarvoice, we decided to leverage our already strong in-house expertise and utilize an automation framework that is internally familiar.

Calabash Unit Tests

Another great thing about using Calabash at Bazaarvoice is that we already have an internal framework developed on top of Cucumber. Because Calabash layers on top of Cucumber, the paradigm and philosophy of writing human readable test cases still applies. The test cases utilize Behavior Driven Development  modeling tools to add meaning to your mobile app testing.

Let’s say you are creating the same app for multiple platforms. Typically, you would have to write completely different sets of code to run similar tests. With Calabash, this is not the case. You write one set of code tests and make slight adjustments depending on the platforms in question and you are done!  Best of all, in addition to Calabash being free, the test cases are super easy to write as a developer and even easier to read for others who may be interested in checking out the health of the project.

Needless to say, Calabash provides a lot of benefits for cross platform testing. Lets take a look at an example test case from the BVSDK Cordova Plugin project. Let’s go through a simple scenario based on the following app screens shots from the iOS simulator.

bvsdk_build_simulator bvsdk_running_simulator

Say you wanted to count the number of products that were recommended by our Product Recommendations API. If you were doing it manually you would go through the following steps:

  1. Wait for the app to launch
  2. Make sure you receive a success alert and press ok
  3. Click the Recommendations tab
  4. Then count how many products there are and compare them to what you were expecting

Now how would we code this? Calabash has two essential components: one feature file and one ruby file. The feature file is where you write out the tests and the ruby file is used primarily to make custom functions if needed (although most of what you need comes right out of the box). So returning to our problem, writing out the test case, you simply write down those exact steps in the feature file:

Feature File
Feature: BVSDK Demo App
@recommendations_test
  Scenario: As a user, I want to get new recommendations
    Given the app has launched
    Then I should see "BVSDK has been built successfully."
    Then I press the OK button
    Then I press Recommendations tab
    Then I check number of products

mindblown

That’s really all there is to it. Of course, tests can be also written to be more platform specific when needed.

Entering the Matrix – Travis CI

We use Travis CI for all our public repos at Bazaarvoice. It’s awesome. But, we have to support multiple build tools on different virtual machines. Configuring all these build machines with custom tools sounds and build scripts really scary! Freak out!

matrix

The really slick thing about Travis CI is that you can test multiple configuration, variations, permutations, salutations, etc, etc, etc, by building a matrix in Travis’ Config file (.travis.yml). For our testing, since XCode only runs on OS X and it’s the only way to build for iOS, we must have an OS X image. For the Android Studio and Gradle build tools, we build against Linux. In addition there’s some common tooling we can install for each build machine. The result is that we can use two different VMs for testing each platform, with just one set of tests. Note in the test result below, the build jobs are defined by the environment variables defined in the Travis config file.

travis_matrix

The .travis.yml script looks like this, where we build a matrix with environment variables and platforms:

matrix:
  include:
    - language: android
      env: TO_TEST=ANDROID
      jdk: oraclejdk8
    - os: osx
      osx_image: xcode8
      env: TO_TEST=IOS
  fast_finish: true
android:
  components:
    - platform-tools
    - tools
    - android-23
    - build-tools-23.0.3
    - extra-android-m2repository
    - extra-google-m2repository
    - sys-img-armeabi-v7a-android-19
install:
  - rvm install 2.2.0
  - if [ "$TO_TEST" = "ANDROID" ]; then gem install calabash-android; fi
  - if [ "$TO_TEST" = "IOS" ]; then gem install calabash-cucumber; fi
before_script:
  - if [ "$TO_TEST" = "ANDROID" ]; then chmod 755 createEmulator.sh; fi
  - if [ "$TO_TEST" = "ANDROID" ]; then ./createEmulator.sh; fi
script:
  - if [ "$TO_TEST" = "ANDROID" ]; then chmod 755 androidTest.sh; fi
  - if [ "$TO_TEST" = "ANDROID" ]; then ./androidTest.sh; fi
  - if [ "$TO_TEST" = "IOS" ]; then chmod 755 iosTest.sh; fi
  - if [ "$TO_TEST" = "IOS" ]; then ./iosTest.sh; fi

BVSDK Cordova Plugin Features

So what if I want to try out the BVSDK Cordova plugin? If you want more info or checkout the source code for the plugin and unit tests, just head over to our Cordova Github repo. There’s plenty of info in the README for running the examples and unit tests.

Open Source Contributions

If you are building a Cordova-based application and want to see other things added just let us know, or better yet submit a pull request and we’ll be happy to review it!