Fixing a performance problem a few days before release (Part 2)

In the previous post, we discussed a performance issue we were facing, and some of the steps we tried while investigating it to no avail.

Profiling Concurrent Requests

Running concurrent requests a few times, I could indeed reproduce the 3x slowdown for new code that we were seeing in the performance environment. The next step was to profile each version during the concurrent test run.

Using the default JProfiler settings, the server was only able to process a few requests per minute. That wasn’t enough to see the performance effects, plus it was clear that profiling itself was taking far too much time and would skew the results considerably. After talking to a few folks, I was shown the CPU profiling options. There are two primary types of CPU profiling: Dynamic Instrumentation and Sampling.

profiling_concurrent_1

Dynamic Instrumentation, as the name implies, instruments all classes as they are loaded by the VM. Every method called will log data into JProfiler, making really small and fast methods appear much more expensive than they truly are. This can skew the results considerably for small, fast methods that are called many many times.

Sampling takes a sample of the JVM state every few milliseconds, thereby storing which methods are executing at any given time and extrapolating how long each method is taking overall. This method doesn’t allow us to know overall method counts, and therefore we cannot know the average amount of time per method call. However, it takes far fewer resources than instrumentation, especially for smaller methods.

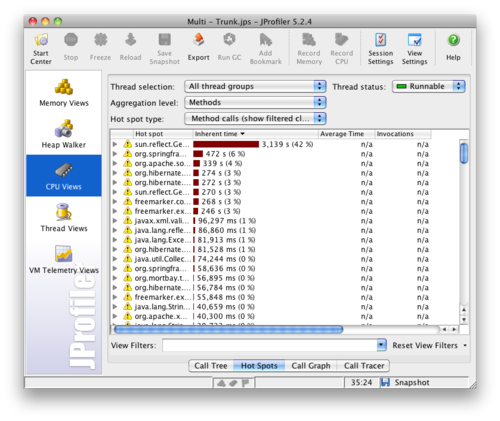
After switching the setting, the server started up much faster during profiling and the number of requests handled while profiling was much more reasonable. Looking at the individual results after several responses were processed in parallel, the individual method that was causing the most processor time was quite obvious:

profiling_concurrent_2

The first method in the list, using 42% of the processing time, definitely appeared to be the culprit. To determine the specific method, JProfiler normally indicates the class name along with the method name. However, the class name for the method was incorrect: JProfiler thought that the method was in a JVM Generated Method Accessor. I haven’t determined the cause of this problem, but the offending method is primarily called by one other method, so it was easy enough to find.

Taking the wrong path

The method itself should have been very simple: it simply returned the product ID from an XML object. Commenting out the call to this method and rerunning the tests confirmed that this was indeed the problem. Because there was no indication of where the actual problem was, I made a first guess that the problem had to do with XML processing, specifically XPath accessors. I attempted to fix this problem by using other methods of property retrieval, but nothing I tried solved the problem when running the concurrent test run.

I reran the profiler with the newest code to see if any new information would show up. It should be noted at this time that each test run takes several minutes to setup and execute, so it had been quite a few hours of trial and error so far. Running the application while profiling takes even longer, so I had avoided running it again up to this point.

After running the application again, the top hit was StringBuilder.append. That was an odd problem because that method wasn’t using StringBuilder at all. It did have a simple String concatenation, but that should be pretty small:

Assert.isNotNull(idAttribute, "Product is missing required 'id' attribute: " + product);

Behind the scenes, the Assert.isNotNull method is doing something like the following:

public static void isNotNull(Object value, String message) {
    if (value == null) {
        throw new IllegalArgumentException(message);
    }
}

The more interesting part is that, though idAttribute is null very rarely (and hopefully never), the String concatenation happens every single time the method is called, which is millions of times! Plus, the product variable is rather large, and its toString() method generates a large XML String from the data. This simple line turned out to be the entire slowdown of the app.

The quick solution since we were so close to release was to replace the line with the logic in the isNotNull method. Because the String concatenation was then guarded by the null check, it was never actually executed. In addition, we looked through the codebase for other similar concatenations and removed them in the same way.

The long-term solution was to change the Assert class methods so that they used MessageFormat:

public static void isNotNull(Object value, String message, Object... messageParams) {
    if (value == null) {
        throw new IllegalArgumentException(MessageFormat.format(message, messageParams));
    }
}

The isNotNull calls look like the following:

Assert.isNotNull(idAttribute, "Product is missing required "id" attribute: {0}", product);

The String concatenation and the product.toString() method never get called unless the assertion fails, which should be rare. MessageFormat.format is more expensive than a String concatenation, but since it is called so infrequently, the performance savings more than make up for the slight cost of each call. Plus, the code is very clear and much more expressive than even using the String concatenation method.

Lessons Learned

There were quite a few lessons learned throughout this process. The first and likely most important is that simple, seemingly innocuous code can sometimes have a dramatic impact on overall performance of the system. In addition, I (re)learned quite a bit about performance debugging in general, and learned a lot about the performance testing tools in particular.

Debugging performance problems tends to take quite a bit of time just because of the shear volume of data or requests that inevitably cause the problem to begin with. Getting reproduceable scenarios and tests that can produce the same results time and time again for comparison is an added challenge, but extremely important in order to determine where the true bottlenecks are. By replaying production request logs to simulate traffic, the requests are very reproduceable and much closer to real-world scenarios. Failing to get reproduceable scenarios will lengthen the entire process.

These types of problems don’t come up often, but when they do, it’s really important to get them identified and fixed quickly. Hopefully this experience will help other developers crack open any performance problems and come to a quick solution.

Fixing a performance problem a few days before release (Part 1)

The Problem

Every few weeks we release a major version of our software. Throughout the release, we have many processes in place to ensure we don’t cause regressions in our latest code. Since we serve up millions of pages each day, regressions in scalability are just as important as failures.

At code freeze, which is approximately one week prior to release, we start running performance tests. The tests themselves are pretty basic: we have scripts that hit a server running new code with a large number of concurrent requests. We then compare compare the results with a baseline computed by executing the same requests against a server running the previous version’s code on the same hardware and database. The results are usually within a reasonable margin of error. This time, however, the new code was only able to process about 1/3 of the requests that the old code could.

In our current product offering, we have two main parts of public access: content display and content submission. Either one of these pieces could have been the culprit since we typically run all types of requests through the system during the first run. A subsequent run of just display traffic proved that display was causing the majority of the slowdown, even without submissions added to the mix. Another key piece of information is that the database didn’t appear to be the culprit: the processors on the app server were pegged, and the database servers were handling queries as normal. One of the usual suspects had an alibi! Of course, we weren’t ruling out the possibility that the database was still an issue, or possibly even Solr.

Finding the Bottleneck

The results so far indicated that we would probably need to profile the app and not just look for bad queries. In order to find the offending code, most Java profilers must connect to the JVM in a way that gives them access to low-level data. We use JProfiler for these types of issues, and it integrates very well with IntelliJ IDEA, but that requires reproducing the issue locally: not always an easy thing to do when large systems with enormous databases are involved.

Running locally, I would get different performance results than running in the performance environment. In fact, sometimes my Mac Pro is faster than the performance environment. Therefore, I would need to run both new and old code on my box to see how they compare – and where the breaking point is.

We have a few options for local testing. The first option is to extract a large data set for use locally. This option means importing the data into a local MySQL DB and reindexing the content into Solr. Unfortunately this is a multi-hour process for a large set of data. In addition, the request logs span all traffic for a particular server, so that means a multi-GB data set. I decided to start the extraction and import process in case this was necessary, and move on to Option 2.

The next option is to attempt to access our lab databases. The databases in the lab don’t have as much data as the extractions, but they do have enough to do a quick-and-dirty performance test. The big issue is that the databases are on different hardware, so it was possible that they wouldn’t match perfectly. I decided to try it anyway, and as expected from the original performance tests, the new code performed about half as well as the old code for each request. I was able to see these results by just executing the requests serially, so I thought I had a good candidate for profiling.

Profiling, Take 1

Profiling a single request in the new version, I didn’t find any method call that really stood out:

The highest cost method above is only 4%, and it turns out to be in the HTML templating system we use. JProfiler has the ability to compare two snapshots, so I took a snapshot for the new code, and then reran the request for the old code while profiling. Comparing the two, we see that there is really no change between the two codebases for these calls:

It looks like Freemarker could be the culprit, but looking at the increasing and decreasing parts of the results, they seem to cancel each other out. This doesn’t make sense if all of our time is supposedly in Java.

DB slowdown?

Looking more closely at the JProfiler snapshot output, there’s an option to show which methods and threads are being filtered out. The threads in the output above were all in “Running” state. This makes sense if the problem is within running Java code, but what if the problem is in the database? In that case, our Java code would be waiting a lot. It turns out that JProfiler has a specific option to show the JDBC calls. Looking at the following output, we can see a few calls are taking 15% of the time while running with the new code:

The nice thing about saving off a snapshot for each of the code versions is that I can keep looking at the data long after the server has been shutdown. Looking at the comparison between new and old code again, we see that there are a few queries that are taking 10x longer to execute in the new system:

This is a problem, but at that point, I realized that this is not likely to be our main problem. Noticing the number of invocations, we don’t call these queries any more often in the new code than the old. Instead, the same exact queries are taking longer. This could mean that we changed the indexes on these tables (nope!), or there is much more data in the database (probably not the case), or (most likely) the hardware is affecting performance of the DB queries drastically.

Switching DBs

Back to square one. I needed to use the same DB hardware for these comparisons, because it skews the results too much, mainly because DB query time overshadows processing time. Also, since we weren’t seeing heavy load on the DB servers during these tests, we were still thinking that the problem was in the Java code.

At this point I didn’t yet have a local DB environment that was reliable, so I decided to run against the performance testing DBs directly. We had to shut down performance testing, but otherwise this was surprisingly easy. While testing it out, I ran into an unexpected bonus: both new and old code was able to run against the new schema! That meant truly testing against the exact same DB was possible.

I ran the serial tests again in both new and old code, and found that they were actually quite similar in performance. Profiling both versions confirmed this, as there were really no differences between the new and old code outside a normal margin of error. It definitely wasn’t taking 3x longer to process requests. However, there is a lot of local processor dead time when handling requests serially because there is a ton of time spent waiting for the DB. I wasn’t able to reproduce the negative results running requests one at a time.

In the conclusion of this post, we’ll get past the red herrings and drive to a solution.

Can’t get into your favorite conference? No problem. Just create your own!

One of the best things about working in Austin is the sheer number of great software companies in town. From web-based start-ups to established enterprise software giants, there is huge diversity in the locally available business models, technology stacks, market sectors, and experience levels. It’s a good bet that no matter what technology problem that you’re facing, a few Austin companies have already found, built, or bought a solution before you.

About a year ago, I was having dinner with a friend who happens to work at another local software company. Throughout dinner we discussed a couple of different infrastructure technologies that our teams had recently built, some problems we were facing, and we shared ideas that might help solve some of those problems. We each walked away not only with ideas that might help solve our upcoming challenges, but also with a list of things that had already been tried and abandoned. While we each have intellectual property that we aren’t at liberty to share, that line leaves a ton of room for technology and ideas that our companies don’t wish to protect as IP. The big remaining question was “How do we do this again, and how do we get more of our team members learning from each other?”

Based on that experience, a few months later Bazaarvoice hosted our first ‘tech talk’ for the outside community. We invited half a dozen other companies from around Austin to come and learn about our architecture and some technologies that we had built that might be useful to others. Specifically, our agenda for the night was:

1. An overview of Bazaarvoice for those in the audience that didn’t know us (5 min)

2. An overview of our application architecture to support scale and uptime (45 min)

3. An infrastructure technology to easily configure Spring for multiple environment types (20 min)

4. A technology to supporting backwards compatibility and versioning in a REST API (20 min)

In return, the attending companies agreed to host their own talks at some point in the future. Fast forward a year, and the group has heard from four different companies and we’ve added a few new teams to the roster. For the investment of presenting 90 minutes worth of material, our teams have all continued to learn from the cumulative successes and mistakes of the whole group.

The good news is that Austin is not unique. There are places all over the country with a rich software industry that can replicate this idea. Think of it as a way to open-source some of your good ideas without the overhead of starting a blog or supporting a true OSS project (though you might want to do those things too). If you do consider it (and I highly recommend it), here are some tips to help make your group successful:

1. You are who you work for

One of the keys for the group was to have participation be officially sanctioned by the companies in attendance. While I can attend a technology group as an individual, I can’t share any of the great things that I’m working on unless Bazaarvoice agrees that those ideas are not IP that we want to protect. When it comes to sharing the inside scoop about your team’s technology, you certainly don’t want any misunderstandings or gray areas about what is appropriate and what isn’t. This also made it easy to continue the group, as we had established up front that every company in attendance for the original Bazaarvoice talk was also willing to share in return.

2. Like building software, don’t over engineer it

Getting something up and running doesn’t take a lot of infrastructure. We organized the first few meetings via email with a representative from each company. Did we have a fancy logo? Nope. Did we have a website to manage attendees? Nope. Did we have a name for the group? Nope (although it has since been informally dubbed “Austin Scales”). Did we have a budget? Nope. We just invited everyone to our office and provided some frosty beverages (this last part is highly recommended). Then, I found a volunteer to present the next time and let them organize it. They did the same for the time after that. You can always add those other nice-to-haves once your group is successful.

3. The first rule of fight club is “No recruiting.” The second rule of fight club is “NO RECRUITING!”

While the companies in attendance may not be competing with each other on the business front, we are often at war when it comes to finding and recruiting top talent. No company will want to approve participation in the group if they believe it will result in their best engineers being lured away. Make sure that everyone in attendance is on the same page. If your company is hiring, leave it at the door.

Why Columns are Cool

Near real time analytics on a large data set = hard!

About two years ago we found ourselves adding a lot of analytical features to the Bazaarvoice Workbench, our client facing analytics product. We were implementing various new dashboards, reports, and alerts. Dashboards needed to be near real time, so we were forced to either find a way to run required SQL queries in real time, or pre-compute required data. As the main data store was MySQL, we found it impossible to aggregate large amounts of data on the fly in real time, so we were forced to pre-compute a lot of aggregates. Pre-computation happens to be error prone, so we eventually went looking for other solutions which would not require us to do as much pre-calculation.

As we looked at the queries which we were running to pre-compute aggregate data, we spotted a common theme, i.e. most of the queries filtered and aggregated data. In the select clause of the query there would normally be a small number of columns with most values being aggregates such as counts, sums and averages. So we went brainstorming what type of database would potentially be a better fit for such queries compared to a traditional row oriented relational DBMS.

We looked at a number of different data stores which could work for the problem we had. One of the alternatives considered was Apache SOLR which is a great NoSQL search server we had been using for a long time already with great success. SOLR supports filtering and faceting which allows us to implement most things we were doing with MySQL using SQL. However, there is quite a bit of dev work which needs to go into indexing data in SOLR and querying it.

Enter the world of column oriented databases

Imagine a database which stores the data by column rather than by row. For example, we might want to store the following employee data in a table:

ID, Name, Department, Salary

1, Chuck Norris, DEV, 10000

2, Gate Bills, SALES, 20000

3, Bart Simpson, HR, 15000

Traditional row oriented databases would store column values for each row sequentially, hence the data is stored like this:

1, Chuck Norris, DEV, 10000

2, Gate Bills, SALES, 20000

3, Bart Simpson, HR, 15000

A column oriented database serializes values of each column together:

1,2,3

Chuck Norris, Gate Bills, Bart Simpson

DEV, SALES, HR

10000, 20000, 15000

This approach has some advantages over row oriented databases:

  1. A columnar database does not need to read the whole row when a query only needs a small subset of columns. This is a typical pattern you see in queries performing aggregations. Not having to read the whole row from disk has an advantage of minimized disk I/O which really matters since databases are normally disk I/O bound these days.
  2. Another important factor is data compression. If data is stored by column, it’s normally possible to achieve high compression rate for each column. This in turn helps to minimize disk footprint of the database, so the disk I/O is minimized as well compared to non-compressed data bases. It often makes sense to take a hit decompressing the data on the fly compared to reading more data from disk.

Getting to know Infobright

One of the column oriented databases we evaluated is Infobright which is an open source database built on MySQL by changing the storage engine to be column oriented. Of course a significant change to storage layout also means that Infobright had to replace MySQL’s query execution engine with a custom engine capable of taking advantage of the columnar storage model. So, let’s jump straight to test results we got when evaluating Infobright using a data set with 100MM records in the main fact table.

As you can see, the average query execution time for analytical queries was 20x faster than MySQL’s.

Additionally, the disk footprint was over 10x smaller compared to MySQL due to data compression.

Also, we found that Infobright supported most of the SQL syntax we were already using in our queries including outer joins, sub-queries and unions. We found that a little tweaking was still required to make some queries perform well.

The benchmark numbers were impressive enough that we ended up using Infobright to implement near real time analytics in one of our products. It does a great job at calculating aggregates on the fly so we no longer needed to maintain as many aggregate tables (for instance, daily, and monthly aggregates).

Infobright – the secret sauce

What is the secret sauce in Infobright? First, its column oriented storage model which leads to smaller disk I/O. Second, its “knowledge grid” which is aggregate data Infobright calculates during data loading. Data is stored in 65K Data Packs. Data Pack nodes in the knowledge grid contain a set of statistics about the data that is stored in each of the Data Packs. For instance, Infobright can pre-calculate min, max, and avg value for each column in the pack during the load, as well as keep track of distinct values for columns with low cardinality. Such metadata can really help when executing a query since it’s possible to ignore data packs which have no data matching filter criteria. If a data pack can be ignored, there is no penalty associated with decompressing the data pack.

Compared to our MySQL implementation, Infobright eliminated the need to create and manage indexes, as well as to partition tables.

Infobright – Limitations

Infobright Community Edition is the open source version of Infobright. Unfortunetly, it does not support DML (inserts, updates, and deletes), so the only way to get data loaded is bulk loads using “LOAD DATA INFILE …” command. It’s still possible to append data to the table, however there is no way to update or delete existing data without having to re-load the table. For some types of data (such as log files or call detail records), this is not a significant issue since data is rarely edited or deleted. However, for other projects this limitation may be a show stopper unless the data set is small enough when it can be periodically re-loaded into Infobright.

Infobright chose to take the SMP (Symmetric MultiProcessing) approach, so there is no built-in support for MPP (Massively Parallel Processing). This certainly limits the size of the databases for which query performance would be acceptable. However, it’s possible to shard the data across multiple Infobright instances and then aggregate the results. Shard-Query is an open source project which makes it possible to query a data set partitioned across many database instances, and our test results confirm that this approach works really well.

Summary

Column oriented databases proved to be a great fit for analytical workloads. We managed to eliminate the need to maintain a large number of aggregate tables by migrating our data warehouse from MySQL to Infobright. This in turn let us support near real time visualizations in our analytics products.

Thanks, this is useful information about column-oriented databases.

What I learned from the Etsy CTO-turned-CEO

I’ll be the first to tell you that my background isn’t at all in engineering or software development. I’ve spent much of the last eight years in business advisory, communications consulting and operations roles. Still, one of the best things about working at Bazaarvoice has been working with and learning from highly-talented technology leaders. Mike Svatek, our chief product officer, Scott Bonneau, our VP of Engineering, and Jon Loyens, who leads BV Labs, are just a few of the people I’ve had the opportunity to work with in my first four months here.

But it’s not just the management team here at Bazaarvoice that has taught me plenty about the R&D functions of a tech company; last month I attended an event in New York (hosted by First Round Capital) where the CTO-turned-CEO of Etsy, Chad Dickerson, spoke about building a world-class dev organization. Going from CTO to CEO is not a traditional route even in today’s technology startup environment, but Chad stands out for making the transition amidst Etsy’s rapid growth. Under his watch, the company’s dev team grew from 20 to 80 engineers in around a year’s time and has seen page views go from 200 million to one billion per month. Talk about hyper-growth!

And what exactly did I learn from Chad’s talk? Well, for starters, he’s a big-time fan of Peter Drucker, one of the top business minds of the last century, who is credited with having shaped much of today’s common management theory and executive MBA programs. On several occasions, Chad quoted Drucker, including one of his most famous lines: “Culture eats strategy for breakfast.”

The culture Chad spoke of began with continuous deployment. He was very much in opposition of traditional “releases”, QA, lengthy and multi-layered “sign off” processes and having a single individual tasked with being the official release engineer. He cited each as reasons for delays in innovation and improvements to features that customers want more and more as the company grows, stating, “as you get bigger, the demands for new features goes up.” He shared that one of the job duties for every new engineer is to release code on their very first day on the job and agrees with Clay Shirky that, “process is an embedded reaction to prior stupidity.”

However, whether or not Etsy’s development policies and practices are directly related to the systems we have in place at Bazaarvoice wasn’t as important to me as the way Chad spoke about promoting an engineer-friendly, technology-driven culture. After all, our business models are very different. The culture piece, though, was of particular interest because here at Bazaarvoice we very much embrace many of the same concepts Chad spoke of when referring to Etsy.

At one point, Chad was asked a question about recruiting and he said, flat out, “Do what it takes to hire super stars.” Well, funny he should say that because every week it seems, we’re bringing on first-rate talent for our dev team, from proven technology business leaders to kick-ass coders. The culture here, the culture that enables us to be the perennial “Best Place to Work in Austin”, starts with people and top-notch talent. It also involves optimizing for developer happiness, something Chad mentioned, by finding ways to give our people the satisfaction of finishing a job. Drucker is the originator of that last statement, too.

As a self-described risk-taker, I loved what Chad had to say about this quality, again quoting Drucker:

“People who don’t take risks generally make about two big mistakes a year. People who do take risks generally make about two big mistakes a year.”

Chad said, “It’s better to be aggressive and make mistakes than be tentative and make mistakes.” Blameless post mortems, Chad said, was the key to creating an environment where small production changes are made daily will certainly lead to minor mistakes, but that small corrections typically address these issues. The tendency to pull back and slow things down was not their M.O., but rather to “roll forward” to progress. I’m a big fan of that mindset.

One of the last things Chad spoke about was doing things to make engineers heroes within the business, which is something customarily reserved for sales guys who bring in the revenue. He said that one of his 2011 goals as CEO is to have every engineer to blog for Etsy, significantly contribute to an open source project or speak at a conference to continue the company’s generosity-filled culture.

After having the privilege of hearing from Chad for two hours, I became doubly enamored with the technology leaders and the team they’re managing here at Bazaarvoice because many of these principles, even if not pulled directly from a Peter Drucker book, are applied in our business.

  • Faith in humanity
  • Sleepless nights
  • Informed risk taking
  • Incremental change

These were the four keys to dev team success listed by Chad. I haven’t had many sleepless nights since joining Bazaarvoice four months ago, and I’m comfortable saying the main reason is because the other three keys are top of mind every day.

Making sure pages still look good when Facebook inevitably goes down

I’m a technical guy, so this is a mostly technical post, but hopefully that’s why you’re reading it. At Bazaarvoice, especially in Labs, we do a lot of work with the Facebook APIs. This can be challenging, because Facebook isn’t exactly known for it’s great uptime or documentation, but it’s also very rewarding to be able to pull in rich social information so easily.

One of the original Facebook-related things that we did across a large group of clients (at least since I’ve been here) was to add the Facebook “Like” button to client’s product and category pages. The integration that Facebook gives is simple, and it seems easy enough, but there’s quite a lot of work involved in safely integrating the like button while still considering uptime, page performance and meta-data.

Most specifically, we quickly ran into a problem with Facebook uptime. Since the like button is essentially implemented via a cross-domain iframe, there is little information you can gather, and little you can do with JavaScript to try to watch things unfold. Things have certainly gotten better since the early days of the Like Button. Load times are better, and the entire Facebook infrastructure feels just a little more stable, though you might say that we felt that way as well the first time Facebook went down and left ugly error messages in the middle of many of our high-profile clients’ pages.

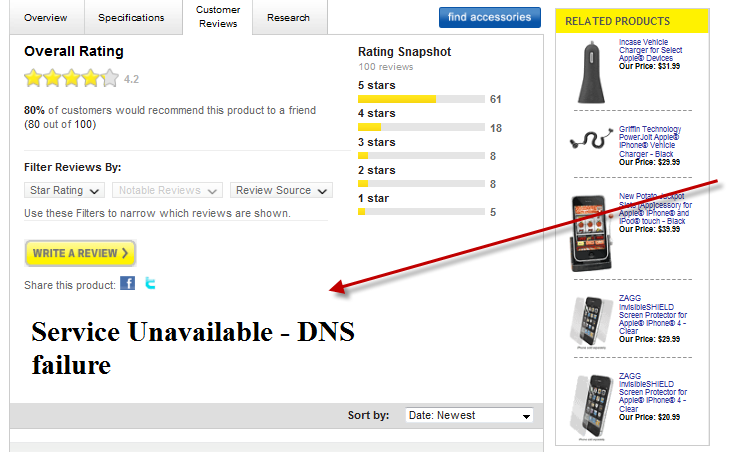
It was actually fairly interesting going around the internet the day that Facebook was down for a long period of time. I believe the issue ended up being a configuration failure, and Akamai was returning server errors, though I’m not sure they ever officially said anything. I do know that instead of Like Buttons showing up on pages, boxes containing big, bold, “service unavailable” messages were being injected all over the place.

fblikedown_png_scaled1000

This occurred on big and small sites alike, and there seemed to be nothing we could do about it. Well, as a company that serves as high quality, and as high quantity of customers as we do, it behooved us to try and figure out a way to let something like this fail more gracefully. So a meeting was born. I’m sorry to say to all the meeting-haters that a solution was also born that day too. One that I’m quite fond of.

We went through some of the code for the asynchronous injection of the FB Like Button. It seemed as if a URL was built, an iframe was injected, and then a size was chosen. Even though Facebook was down, people using the Asynchronous ‘injection’ version of the Like Button were still mostly affected. This is because this file is highly cached, and very popular. As long as someone had visited any site with Facebook integration (there are a few…), the script was likely cached and running regardless of the actual server status. Then, when the script finally decided to load in actual data, the iframe that it injected was filled with the resulting error.

This meant that we had to rely on things that we knew didn’t have to phone home to Facebook, or rather, that if something odd happened after phoning home to Facebook, then we’d know we’re on the right track. We took a look at the events that the Facebook SDK would fire and noticed that there was an event that happened directly after the iframe was injected into the site. There was also code that followed it to determine the correct height for the widget. So all we had to was set the initial height to 0 after the iframe was injected, and then allow the FB to set the correct height afterwards.

This worked great. If the inner-page of the FB Like iFrame never loaded the javascript that determined the height of itself (like when the server returns error messages instead of markup and code), then it could never relay the correct information to resize its height to the correct proportion. This meant that we could effectively hide the Like Button until we could guarantee that the server had responded with working code.

Here’s the snippet we used:

FB.Event.subscribe('xfbml.render', function(response) { jQuery('iframe#theFacebookIframe').css({ 'height' : '0' }); });

Again, this stops the Like button from ever appearing if the Facebook servers are down. It’s a nice solution for a problem that rarely happens, but is important to handle well when it does. I’d encourage you to consider not only third party security, but also third party uptime when talking to providers. Facebook, while extremely useful, has had a tendency to go under as soon as you think they won’t again. Your clients don’t end up caring why there are error messages on their pages, so it’s the duty of the league of implementors to tackle problems like this one, and make sure that none of their clients have issues.

Stop, collaborate and innovate: Engineering a company science fair

Many people are aware of Google’s “20 percent time,” and the number of innovations that have been produced because of it (Gmail, Google News, and AdSense to name a few). Several other companies have tried this before and after Google; one of the most famous examples of side-project innovation is 3M’s Post it Note. Software development companies are now emulating this model, holding hack-a-thons where flurries of innovation occur.At Bazaarvoice we’ve been holding regular Science Fairs every few months for well over the last year to allow our Engineering team to stretch their creative muscles. The format is simple; we schedule the two-day Science Fairs at times that are not likely to have a lot of conflicts with the regular release cycle, typically over a Thursday and a Friday. When the engineers arrive on Thursday, instead of working on the newest features in our evergreen platform, they get to choose what they want to work on. Teams of engineers (and designers) from across our Implementation, Development, Operations, and Support teams work together all day Thursday—often late into the night—and half of the day Friday to bring their ideas to life. After lunch on Friday the teams present their projects to a panel of judges and finalists, and winners are announced.

These types of events are an amazing addition to the company’s culture, and really help to drive new innovations into our products. Engineers walk away from the two days of coding with a new sense of empowerment, realizing just how much they can accomplish in such a short period of time. Additionally, many of the projects stretch the bounds of what our products can do already, showing us new areas for efficiency improvements, incredible new user experiences, or just plain fun new ways of looking at the same data.

Having done this for a year, we’ve learned a few things along the way about how to run a successful Science Fair. Here are my top three tips.

1. Get thematic

We’ve learned that providing some structure to the projects helps to give people direction. We’ve published a list of themes for the last two Science Fairs, and that has helped not only with the task of judging all of the projects by dividing it into manageable chunks, but has also been a way to help engineers discover projects that they are passionate about.

2. Don’t be afraid to show it off

Second, it is critical that participants be able to see as many of the projects as possible at the conclusion of the Science Fair. We still have room to improve on this, but including a Science Fair Open House the Monday after the fair provides everyone with a chance to see what their peers were able to accomplish.

3. Level set

Finally, it is worthwhile noting that you should not expect to get new features or products out of every event. It is much more valuable to keep the process very open and to allow everyone to enjoy themselves rather than feeling like they have to produce the next great thing.