
In the previous post, we discussed a performance issue we were facing, and some of the steps we tried while investigating it to no avail.
Profiling Concurrent Requests
Running concurrent requests a few times, I could indeed reproduce the 3x slowdown for new code that we were seeing in the performance environment. The next step was to profile each version during the concurrent test run.
Using the default JProfiler settings, the server was only able to process a few requests per minute. That wasn’t enough to see the performance effects, plus it was clear that profiling itself was taking far too much time and would skew the results considerably. After talking to a few folks, I was shown the CPU profiling options. There are two primary types of CPU profiling: Dynamic Instrumentation and Sampling.
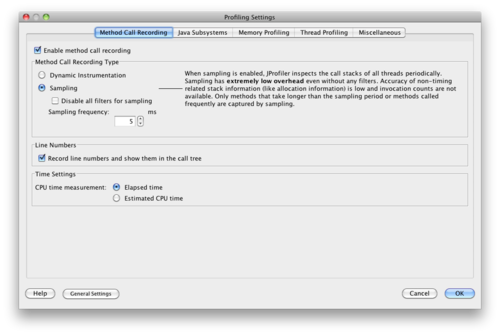
Dynamic Instrumentation, as the name implies, instruments all classes as they are loaded by the VM. Every method called will log data into JProfiler, making really small and fast methods appear much more expensive than they truly are. This can skew the results considerably for small, fast methods that are called many many times.
Sampling takes a sample of the JVM state every few milliseconds, thereby storing which methods are executing at any given time and extrapolating how long each method is taking overall. This method doesn’t allow us to know overall method counts, and therefore we cannot know the average amount of time per method call. However, it takes far fewer resources than instrumentation, especially for smaller methods.
After switching the setting, the server started up much faster during profiling and the number of requests handled while profiling was much more reasonable. Looking at the individual results after several responses were processed in parallel, the individual method that was causing the most processor time was quite obvious:
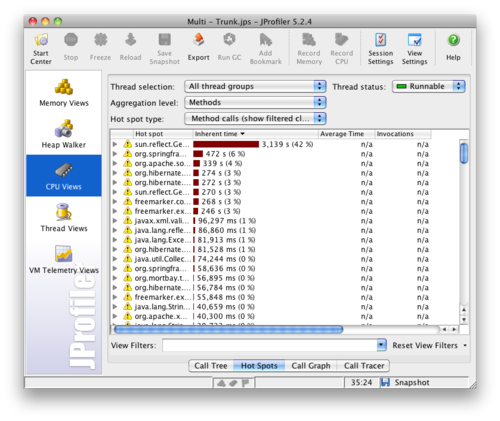
The first method in the list, using 42% of the processing time, definitely appeared to be the culprit. To determine the specific method, JProfiler normally indicates the class name along with the method name. However, the class name for the method was incorrect: JProfiler thought that the method was in a JVM Generated Method Accessor. I haven’t determined the cause of this problem, but the offending method is primarily called by one other method, so it was easy enough to find.
Taking the wrong path
The method itself should have been very simple: it simply returned the product ID from an XML object. Commenting out the call to this method and rerunning the tests confirmed that this was indeed the problem. Because there was no indication of where the actual problem was, I made a first guess that the problem had to do with XML processing, specifically XPath accessors. I attempted to fix this problem by using other methods of property retrieval, but nothing I tried solved the problem when running the concurrent test run.
I reran the profiler with the newest code to see if any new information would show up. It should be noted at this time that each test run takes several minutes to setup and execute, so it had been quite a few hours of trial and error so far. Running the application while profiling takes even longer, so I had avoided running it again up to this point.
After running the application again, the top hit was StringBuilder.append. That was an odd problem because that method wasn’t using StringBuilder at all. It did have a simple String concatenation, but that should be pretty small:
Assert.isNotNull(idAttribute, "Product is missing required 'id' attribute: " + product);Behind the scenes, the Assert.isNotNull method is doing something like the following:
public static void isNotNull(Object value, String message) {
    if (value == null) {
        throw new IllegalArgumentException(message);
    }
}
The more interesting part is that, though idAttribute is null very rarely (and hopefully never), the String concatenation happens every single time the method is called, which is millions of times! Plus, the product variable is rather large, and its toString() method generates a large XML String from the data. This simple line turned out to be the entire slowdown of the app.
The quick solution since we were so close to release was to replace the line with the logic in the isNotNull method. Because the String concatenation was then guarded by the null check, it was never actually executed. In addition, we looked through the codebase for other similar concatenations and removed them in the same way.
The long-term solution was to change the Assert class methods so that they used MessageFormat:
public static void isNotNull(Object value, String message, Object... messageParams) {
    if (value == null) {
        throw new IllegalArgumentException(MessageFormat.format(message, messageParams));
    }
}
The isNotNull calls look like the following:
Assert.isNotNull(idAttribute, "Product is missing required "id" attribute: {0}", product);The String concatenation and the product.toString() method never get called unless the assertion fails, which should be rare. MessageFormat.format is more expensive than a String concatenation, but since it is called so infrequently, the performance savings more than make up for the slight cost of each call. Plus, the code is very clear and much more expressive than even using the String concatenation method.
Lessons Learned
There were quite a few lessons learned throughout this process. The first and likely most important is that simple, seemingly innocuous code can sometimes have a dramatic impact on overall performance of the system. In addition, I (re)learned quite a bit about performance debugging in general, and learned a lot about the performance testing tools in particular.
Debugging performance problems tends to take quite a bit of time just because of the shear volume of data or requests that inevitably cause the problem to begin with. Getting reproduceable scenarios and tests that can produce the same results time and time again for comparison is an added challenge, but extremely important in order to determine where the true bottlenecks are. By replaying production request logs to simulate traffic, the requests are very reproduceable and much closer to real-world scenarios. Failing to get reproduceable scenarios will lengthen the entire process.
These types of problems don’t come up often, but when they do, it’s really important to get them identified and fixed quickly. Hopefully this experience will help other developers crack open any performance problems and come to a quick solution.