Category Archives: Open Source

Flyte 1 Year In

On the racetrack of building ML applications, traditional software development steps are often overtaken. Welcome to the world of MLOps, where unique challenges meet innovative solutions and consistency is king. 

At Bazaarvoice, training pipelines serve as the backbone of our MLOps strategy. They underpin the reproducibility of our model builds. A glaring gap existed, however, in graduating experimental code to production.

Rather than continuing down piecemeal approaches, which often centered heavily on Jupyter notebooks, we determined a standard was needed to empower practitioners to experiment and ship machine learning models extremely fast while following our best practices.

(cover image generated with Midjourney)

Build vs. Buy

Fresh off the heels of our wins from unifying our machine learning (ML) model deployment strategy, we first needed to decide whether to build a custom in-house ML workflow orchestration platform or seek external solutions.

When deciding to “buy” (it is open source after all), selecting Flyte as our workflow management platform emerged as a clear choice. It saved invaluable development time and nudged our team closer to delivering a robust self-service infrastructure. Such an infrastructure allows our engineers to build, evaluate, register, and deploy models seamlessly. Rather than reinventing the wheel, Flyte equipped us with an efficient wheel to race ahead.

Before leaping with Flyte, we embarked on an extensive evaluation journey. Choosing the right workflow orchestration system wasn’t just about selecting a tool but also finding a platform to complement our vision and align with our strategic objectives. We knew the significance of this decision and wanted to ensure we had all the bases covered. Ultimately the final tooling options for consideration were Flyte, Metaflow, Kubeflow Pipelines, and Prefect.

To make an informed choice, we laid down a set of criteria:

Criteria for Evaluation

Must-Haves:

  • Ease of Development: The tool should intuitively aid developers without steep learning curves.
  • Deployment: Quick and hassle-free deployment mechanisms.
  • Pipeline Customization: Flexibility to adjust pipelines as distinct project requirements arise.
  • Visibility: Clear insights into processes for better debugging and understanding.

Good-to-Haves:

  • AWS Integration: Seamless integration capabilities with AWS services.
  • Metadata Retention: Efficient storage and retrieval of metadata.
  • Startup Time: Speedy initialization to reduce latency.
  • Caching: Optimal data caching for faster results.

Neutral, Yet Noteworthy:

  • Security: Robust security measures ensuring data protection.
  • User Administration: Features facilitating user management and access control.
  • Cost: Affordability – offering a good balance between features and price.

Why Flyte Stood Out: Addressing Key Criteria

Diving deeper into our selection process, Flyte consistently addressed our top criteria, often surpassing the capabilities of other tools under consideration:

  1. Ease of Development: Pure Python | Task Decorators
    • Python-native development experience
  2. Pipeline Customization
    • Easily customize any workflow and task by modifying the task decorator

  3. Deployment: Kubernetes Cluster
  4. Visibility
    • Easily accessible container logs
    • Flyte decks enable reporting visualizations

  5. Flyte’s native Kubernetes integration simplified the deployment process.

The Bazaarvoice customization

As with any platform, while Flyte brought many advantages, we needed a different plug-and-play solution for our unique needs. We anticipated the platform’s novelty within our organization. We wanted to reduce the learning curve as much as possible and allow our developers to transition smoothly without being overwhelmed.

To smooth the transition and expedite the development process, we’ve developed a cookiecutter template to serve as a launchpad for developers, providing a structured starting point that’s standardized and aligned with best practices for Flyte projects. This structure empowers developers to swiftly construct training pipelines.

The most relevant files provided by the template are:

  • Pipfile    - Details project dependencies 
  • Dockerfile - Builds docker container
  • Makefile   - Helper file to build, register, and execute projects
  • README.md  - Details the project 
  • src/
    • tasks/
    • Workflows.py (Follows the Kedro Standard for Data Layers)
      • process_raw_data - workflow to extract, clean, and transform raw data 
      • generate_model_input - workflow to create train, test, and validation data sets 
      • train_model - workflow to generate a serialized, trained machine learning model
      • generate_model_output - workflow to prevent train-serving skew by performing inference on the validation data set using the trained machine learning model
      • evaluate - workflow to evaluate the model on a desired set of performance metrics
      • reporting - workflow to summarize and visualize model performance
      • full - complete Flyte pipeline to generate trained model
  • tests/ - Unit tests for your workflows and tasks
  • run - Simplifies running of workflows

In addition, a common challenge in developing pipelines is needing resources beyond what our local machines offer. Or, there might be tasks that require extended runtimes. Flyte does grant the capability to develop locally and run remotely. However, this involves a series of steps:

  • Rebuild your custom docker image after each code modification.
  • Assign a version tag to this new docker image and push it to ECR.
  • Register this fresh workflow version with Flyte, updating the docker image.
  • Instruct Flyte to execute that specific version of the workflow, parameterizing via the CLI.

To circumvent these challenges and expedite the development process, we designed the template’s Makefile and run script to abstract the series of steps above into a single command!

./run —remote src/workflows.py full

The Makefile uses a couple helper targets, but overall provides the following commands:

  • info       - Prints info about this project
  • init       - Sets up project in flyte and creates an ECR repo 
  • build      - Builds the docker image 
  • push       - Pushes the docker image to ECR 
  • package    - Creates the flyte package 
  • register   - Registers version with flyte
  • runcmd     - Generates run command for both local and remote
  • test       - Runs any tests for the code
  • code_style - Applies black formatting & flake8

Key Triumphs

With Flyte as an integral component of our machine learning platform, we’ve achieved unmatched momentum in ML development. It enables swift experimentation and deployment of our models, ensuring we always adhere to best practices. Beyond aligning with fundamental MLOps principles, our customizations ensure Flyte perfectly meets our specific needs, guaranteeing the consistency and reliability of our ML models.

Closing Thoughts

Just as racers feel exhilaration crossing the finish line, our team feels an immense sense of achievement seeing our machine learning endeavors zoom with Flyte. As we gaze ahead, we’re optimistic, ready to embrace the new challenges and milestones that await. 🏎️

If you are drawn to this type of work, check out our job openings.

Vger Lets You Boldly Go . . .

Are you working on an agile team? Odds are high that you probably are. Whether you do Scrum/Kanban/lean/extreme, you are all about getting work done with the least resistance possible. Heck, if you are still on Waterfall, you care about that.  But how well are you doing? Do you know? Is that something a developer or a lead should even worry about or is a SEP? That’s a trick question. If your team is being held accountable and there is a gap between their expectations and your delivery, by the transitive property, you should worry about some basic lean metrics.

Here at Bazaarvoice, we are agile and overwhelmingly leverage kanban. Kanban emphasizes the disciplines of flow and continuous improvement. In an effort to make data-driven decisions about our improvements, we needed an easy way to get the relevant data. With just JIRA and GitHub alone, access to the right data has a significant barrier to entry.

So, like any enterprising group of engineers, we built an app for that.

What we did

Some of us had recently gone through an excellent lean metric forecasting workshop with Troy Magennis from Focused Objective. In his training he presented the idea of displaying a quadrant of lean metrics in order to force a narrative for a teams behavior, and to avoid overdriving on a single metric. This really resonated with me and seemed like good paradigm for the app we wanted to build.

And thus, Vger was born.

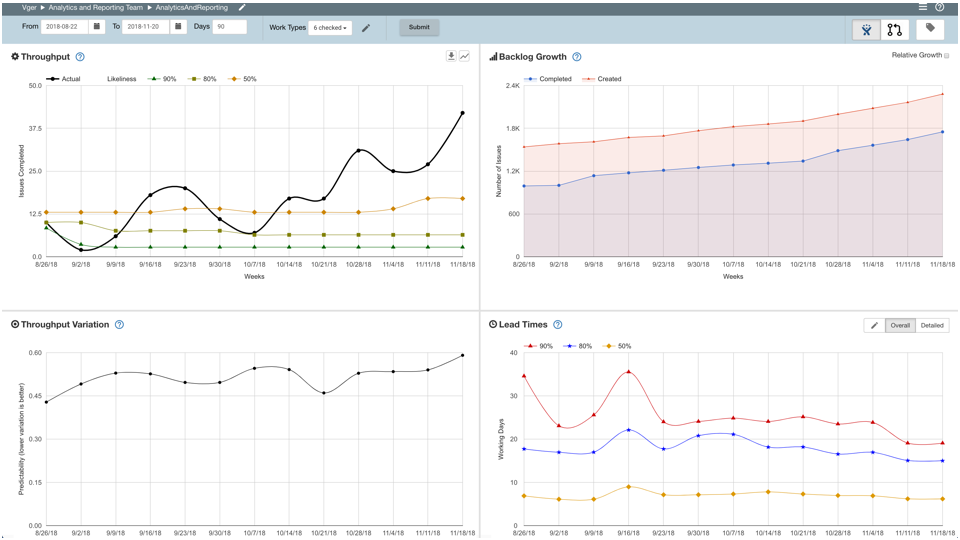
We went with a simple quadrant view with very bookmarkable url parameters. We made it simple to for teams to self-service by giving them an interface to make their own “Vger team” and add whatever “Vger boards” they need.  Essentially, if you can make a JQL query and give it a board in JIRA, Vger can graph the metrics for it. In the display, we provide a great deal of flexibility by letting teams configure date ranges for the dashboard, work types to be displayed, and the JIRA board columns to be considered as working/non-working.

Now the barrier to entry for lean metrics is down to “can you open a browser.”  Not too shabby.

The Quadrant View

We show the following in the quadrant view:

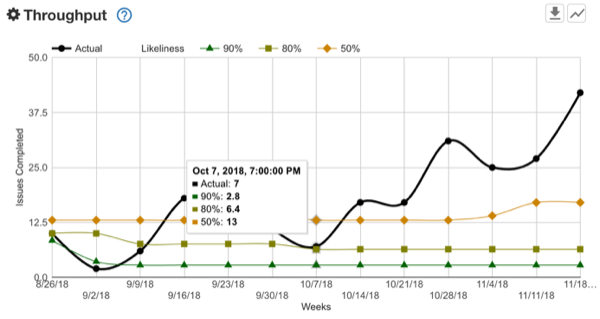
1. Throughput – The number of completed tickets per week.

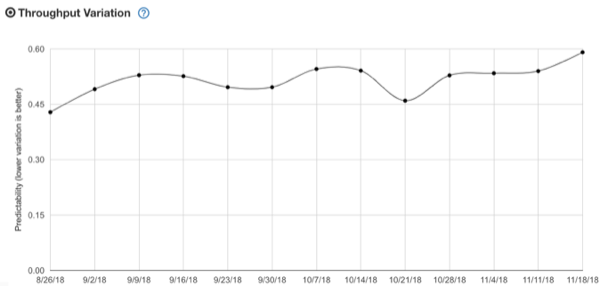
2. Variation – the variation (standard deviation/mean) for the Throughput.

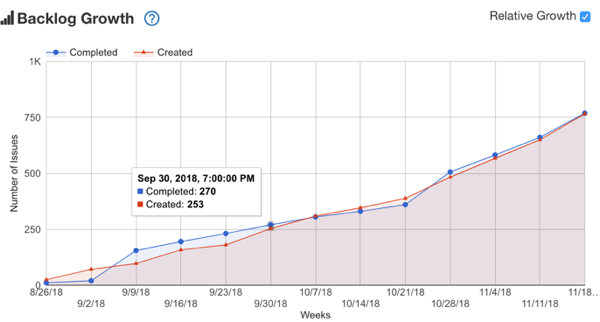
3. Backlog Growth – the tickets opened versus closed.

4. Lead Times – The lead times for the completed tickets. This also provides a detailed view by Jira board column to see where you spend most of your time.

We at Bazaarvoice are conservative gamblers, so you’ll see the throughput and lead time quadrants show the 50%, 80%, and 90% likelihood (the inverse of percentile).  We do this because relying on the average or mean is not your friend. Who want’s to bet on a coin toss? Not us. We like to be right say, eight out of ten times.

The Quarterly View

Later, we were asked to show throughput by quarter to help with quarterly goal planning. We created a side-car page for this.  It shows Throughput by quarter:

We also built a scatterplot for lead times so outliers could be investigated:

This view has zoomable regions and each point lets you click through to the corresponding JIRA ticket. So that’s nice.

But Wait! Git This….

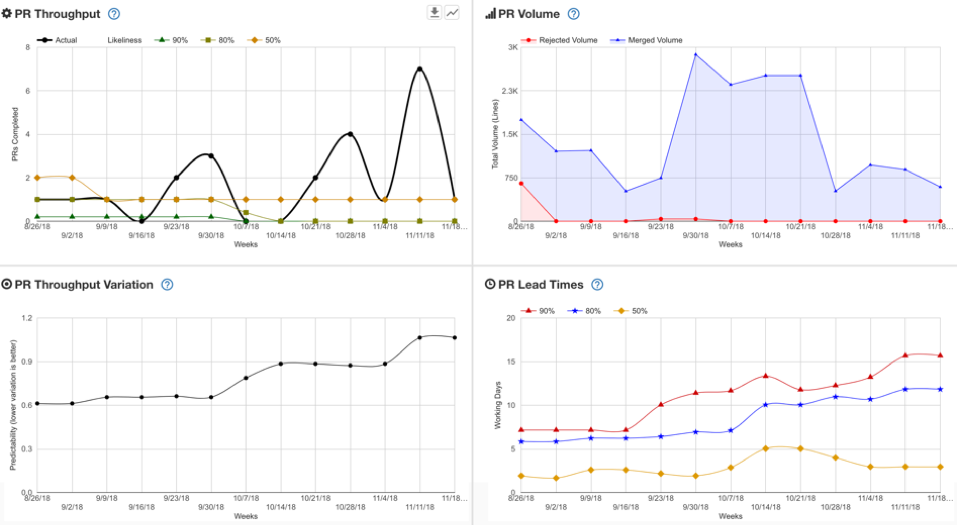
From day one, we chose to show the same Quadrant for GitHub Pull Requests.

Note that we show rejected and merged lines in the PR Volume quadrant.  We also support overlaying your git tags on both PR and JIRA ticket data.  Pretty sweet!

I Want to Do More

Vger lets you download throughput data from the Quadrant and Quarterly views. You can also download lead time from the Quarterly view too. This lets teams and individuals perform their own visualizations and investigations on these very useful lean metrics.

But Why?

Vger was built with three use cases in mind:

Teams should be informed in retros

Teams should have easy access to these key lean metrics in their retros. We recommend that they start off viewing the quadrant and seeing if they agree with the narrative the retro facilitator presents. They should also consider the results of any improvement experiments they tried. Did the new behavior make throughput go up as they hoped it would? It the new behavior reduce time spent in code review? Did it reduce the number open bugs? etc.  Certainly not everything in a retro should be mercilessly data-driven, but it is a key element to a culture of continuous improvement.

Managers should know this data and speak to it

Team managers commonly speak to how their teams are progressing. These discussions should be data-driven, and most importantly it should be driven by the same data the team has access to (and hopefully retros to). It should also be presented in a common format that still provides for some customization. NOTE: You should avoid comparing team to team in Vger or a similar visualization. In most situations, that way leads to futility, confusion, and frustration.

We should have data to drive data-driven decisions about the future

Lean forecasting is beyond the scope of this post however, Troy Magennis has a fine take on it.  My short two cents on the matter is: a reasonably functioning team with even a little bit of run time should never be asked “how long will it take?”  Drop that low value ritual and do the high value task of decomposing the work, then forecast with historical data. Conveniently, you can download this historical data from Vger you used in your spreadsheet of choice.  I happen to like monte carlo simulations myself.

Isn’t This for Kanban?

You’ll note I used the term “lean metrics” throughout. I wanted to avoid any knee-jerk “kanban vs scrum vs ‘how we do things'”reaction. These metrics apply no matter what methodology you consciously (or unconsciously) use for the flow of work through your team.  It was built for feature development teams in mind, but we had good success when our client implementation team started using it as an early adopter. It allowed them to have a clear view into their lead time details and ferret out how much time was really spent waiting on clients to perform an action on their end.

Cool. How Do I Get a Vger?

We open sourced it here, so help yourself. This presented as “it worked for us”-ware and is not as finely polished as it could be, so it has some caveats. It is a very simple serverless app. We use JIRA and GitHub, so only those tools are currently supported. If you use similar, give Vger a try!

What’s Next?

If your fingers are itching to contribute, here’s some ideas:

  • Vger’s ETL process could really use an update
  • The Quadrant view UI really needs an update to React to match the Quarterly view
  • Make it flexible for your chosen issue tracker or source control?
  • How about adding a nice Cumulative Flow Diagram?


Telling Your Data To “Back Off!” (or How To Effectively Use Streams)

Foreword

Our Curations engineering team makes heavy use of serverless architecture. While this typically gives us the benefit of reduced costs, flexibility, and rapid development, it also requires us to ensure that our processes will run within the tight memory and lifecycle constraints of serverless instances.

In this article, I will describe an actual case where a scheduled job had started to fail, the discovery of the root cause and the refactor that resolved the issue. I will assume you have at least a rudimentary knowledge of Node JS and Amazon Web Services.

Content Export

Months previously, we built a scheduled job using AWS Lambdas that would kick off an export of our social content every 24 hours. In a nutshell, its purpose was to:

  1. Query for social content documents stored in a MongoDB server.
  2. Transform each document to a row in CSV format.
  3. Write out the CSV rows to a file in S3.

The resulting CSV files were meant for ingestion into an analytics tool to measure web site conversion impact.

It all worked fine for months. Then recently, this job began to fail.

Drowning in Content

For your viewing pleasure, here is an excerpted, condensed section of the main code:

function runExport(query) {
  MongoClient.connect(MONGODB_URL)
    .then((db) => {
      let exportCount = 0;
      db
        .collection('content')
        .find(query)
        .forEach(
          // iterator function to perform on each document
          (content) => {
            // transform content doc to a csv row, then push to S3 writer
            s3.write(csvTransform(content));
            exportCount++;
          },
          // done function, no more documents
          () => {
            db.close();
            s3.close();
            logger.info(`documents exported: ${exportCount}`);
          }
        );
    });
}

Each document from the database query is transformed into a CSV row, then pushed to our S3 writer which buffered all content until an s3.close(). At this point, the CSV data would be flushed out to the S3 destination bucket.

It was obvious from this implementation that heap usage would grow unbounded, as documents from the database would be loaded into resident memory as CSV data. As we aggregated content over the previous months, the data pushed into our export process began to generate frequent “out of heap memory” errors in our logs.

Memory Profile

To gain visibility into the memory usage, I wrote a quick and dirty MemProfiler class whose purpose was to sample memory usage using process.memoryUsage(), collecting the maximum heap used over the process lifetime.

class MemProfiler {
  constructor(collectInterval) {
    this.heapUsed = {
      min : null,
      max : null,
    };
    if (collectInterval) {
      this.start(collectInterval);
    }
  }

  start(collectInterval = 500) {
    this.interval = setInterval(() => this.sample(), collectInterval);
  }

  stop() {
    if (this.interval) {
      clearInterval(this.interval);
    }
  }

  reset() {
    this.stop();
    this.heapUsed = {
      min : null,
      max : null,
    };
  }

  sample() {
    const mem = process.memoryUsage();
    if (this.heapUsed.min === null || mem.heapUsed < this.heapUsed.min) {
      this.heapUsed.min = mem.heapUsed;
    }
    if (this.heapUsed.max === null || mem.heapUsed > this.heapUsed.max) {
      this.heapUsed.max = mem.heapUsed;
    }
  }
}

I then added the MemProfiler to the runExport code:

function runExport(query) {
  memProf.start();
  MongoClient.connect(MONGODB_URL)
    .then((db) => {
      let exportCount = 0;
      db
        .collection('content')
        .find(query)
        .forEach(
          (content) => {
            // transform content doc to a csv row, then push to S3 writer
            s3.write(csvTransform(content));
            exportCount++;
            memProf.sample();
          },
          () => {
            db.close();
            s3.close();
            logger.info(`documents exported: ${exportCount}`);
            console.log('heapUsed:');
            console.log(` max: ${memProf.heapUsed.max/1024/1024} MB`);
            console.log(` min: ${memProf.heapUsed.min/1024/1024} MB`);
          }
        );
    });
}

Running the export against a small set of 16,900 documents yielded this result:

documents exported: 16900
heapUsed:
max: 30.32764434814453 MB
min: 8.863059997558594 MB

Then running against a larger set of 34,000 documents:

documents exported: 34000
heapUsed:
max: 36.204505920410156 MB
min: 8.962921142578125 MB

Testing with additional documents increased the heap memory usage linearly as we expected.

Enter the Stream

The necessary code rewrite had one goal in mind: ensure the memory profile was constant, whether a total of one document was processed or a million. Since this was a batch process, we could trade off memory usage for processing time.

Let’s reiterate the primary operations:

  1. Fetch a document
  2. Transform the document to a CSV row
  3. Write the CSV row to S3

If I may present an analogy, we have widgets moving down the assembly line from one station to the next. The conveyor belt on which the widgets are transported is moving at a constant rate, which means the throughput at each station is constant. We could increase the speed of that conveyor belt, but only as fast as can be handled by the slowest station.

In Node JS, streams are the assembly line stations, and pipes are the conveyor belt. Let’s examine the three primary types of streams:

  1. Readable streams: This is typically an upstream data source that feeds data to a writable or transform stream. In our case, this is the MongoDB find query.
  2. Transform streams: This typically takes upstream data, performs a calculation or transformation operation on it and feeds it out downstream. In our case, this would take a MongoDB document and transform it to a CSV row.
  3. Writable streams: This is typically the terminating point of a data flow. In our case this is the writing of a CSV row to S3.

Readable Stream

Conveniently, the MongoDB Node JS driver’s find() function returns a Cursor object that extends the Node JS Readable stream. How convenient!

const streamContentReader = db.collection('content').find(query);

Transform Stream

All we need to do is extend the Transform stream class, and override the _transform() method to transform the content to a CSV row, push it out the other end, and signal upstream that it is ready for the next content.

class CsvTransformer extends Transform {
  constructor(options) {
    super(options);
  }

  _transform(content, encoding, callback) {
    // write row
    const { _id, authoredAt, client, channel, mediaType, permalink , text, textLanguage } = content;
    const csvRow = `${_id},${authoredAt},${client},${channel},${mediaType},${permalink}${text},${textLanguage}\n`;
    this.push(csvRow);
    // signal upstream that we are ready to take more data
    callback();
  }
}

Writable Stream

Let’s purposely mock the S3 Writer for now. It does nothing here, but realistically, we would buffer up incoming data, then flush out the buffer in chunks over the network for best throughput.

class S3Writer extends Writable {
  constructor(options) {
    super(options);
  }

  _write(data, encoding, callback) {
    // TODO: probably use a fixed size buffer
    // that we write to and then flush out to S3 using
    // multipart data upload
    callback();
  }
}

Pipe ‘Em Up

We now create the three streams:

const streamContentReader = db.collection('content').find(query);
const streamCsvTransformer = new CsvTransformer({ objectMode: true });
const streamS3Writer = new S3Writer();

Streams alone do nothing. What makes them useful is connecting the output from one stream to the input of another. In stream terminology, this is called piping, and is accomplished using the stream’s pipe method:

streamContentReader.pipe(streamCsvTransformer).pipe(streamS3Writer)

Although the native pipe method is perfectly functional, I highly recommend using the pump library. In addition to being more readable by passing in an array of streams to pipe together, we can also invoke then() when the pipe has finished, as well as handle close or error events emitted by the streams:

pump([ streamContentReader, streamCsvTransformer, streamS3Writer ])
  .then(() => {
    console.log(`documents exported: ${exportCount}`);
  })
  .catch((err) => console.error(err));

CSV and S3 Write Streams

I purposely did not implement the S3Writer above, because npm is a treasure trove of solutions! The s3-write-stream library will take care of buffering, using multipart upload and handling retries, so we don’t have to get our hands too dirty. And wouldn’t you know it, there is also the csv-write-stream library that will generate properly escaped CSV rows.

As an exercise, you the reader may want to try using the s3-write-stream and csv-write-stream. Trust me, once you get the hang of streaming, you will enjoy it!

Back Off!

Let’s touch back on the issue of memory usage.

What if a write stream becomes blocked for a period of time? Maybe we are writing data to a third-party service over HTTP and network congestion or service throttling is slowing the write rate. The readable stream will happily pump data in as fast as it can. Won’t that cause increased heap usage as all that data gets backed up and buffered?

The quick answer is “no”. In the implementation of the _write() method of your writable stream, when done with the data chunk (after writing to a file for example), call callback(). This signals to the incoming stream that it is ready to receive the next chunk. You can also provide a highWaterMark to the writable stream constructor to give a specific number of objects to buffer before pausing the incoming stream. This is all handled internally by the Node JS streams implementation. No more unbounded buffering!

For a deep dive into the concept of backpressure control, read this great article on Backpressuring in Streams.

Stream ‘Em If You Got ’em!

Our team is now in the process of utilizing Node JS streams whenever we read in volumes of data, process that data, then write out the results. We are now seeing great gains in both stability and maintainability!

References

Node JS Streams APIhttps://nodejs.org/api/stream.html

Article: Backpressuring in Streams: https://nodejs.org/en/docs/guides/backpressuring-in-streams/

MongoDB Cursor Streamhttp://mongodb.github.io/node-mongodb-native/2.2/api/Cursor.html

Pump Modulehttps://www.npmjs.com/package/pump

CSV Write Stream Module: https://www.npmjs.com/package/csv-write-stream

S3 Write Stream Module: https://www.npmjs.com/package/s3-write-stream


Testing for Application Front End Performance with Web Page Test

taco-meter

‘Taco-meter’ – a device used to measure how quickly you can obtain tacos from your current location

If you’ve followed Bazaarvoice’s R&D blog, you’ve probably read some of our posts on web application performance testing with tools like Jmeter here and here.

In this post, we’ll continue our dive into web app performance, this time, focusing on testing front end applications.

API Response Time vs App Usability:

Application UI testing in general can be challenging as the cost of doing so (in terms of both time, labor and money) can become quite expensive.

In our previous posts highlighted above, we touched on testing RESTful APIs – which revolves around sending a set of requests to a target, measuring their response times and checking for errors.

For front-end testing, you could do the same – automate requesting the application’s front-end resources and then measuring their collective response times.  However, there are additional considerations for front end testing that we must account for – such as cross-browser issues, line speed constraints (i.e. broadband vs. a mobile 3G) as well as client side loading and execution (especially important for JavaScript).

Tools like Jmeter can address some of these concerns, though you may be limited in what can be measured.  Plugins for Jmeter that allow Webdriver API access exist but can be difficult to configure, especially in a CI environment (read through these threads from Stack Overflow on getting headless Webdriver to work in Jenkins for example).

There are 3rd party services available that are specialized for UI-focused load tests (e.g. Blazemeter) but these options can sometimes be expensive.  This may be too much for some teams in terms of time and money – especially if you’re looking for a solution for introductory, exploratory testing as opposed to something larger in scale.

Webpagetest.org:

Webpagetest.org is an open source project backed by multiple partners such as Google, Akamai and Fastly, among others.  You can check out the project’s github page here.

Webpagetest.org is a publicly available service.  Its main goal is to provide performance information for web applications, allowing designers and engineers to measure and improve application speed.

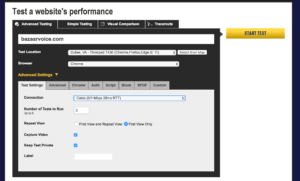
Let’s check out Webpagetest.org’s public facing page – note the URL form field.  We can try out the service’s basic reporting features by pasting the URL of a website or application into the field and submitting the form.  In this case, let’s test the performance of Bazaarvoice’s home page.

Before submitting the form however, note some of the additional options made available to us:

  • Browser type
  • Location
  • Number of tests
  • Connection

webpagetest.org form

Webpagetest.org’s initial submission form

This service allows us to configure our tests to simulate user requests from a slow, mobile, 3G device in the US to a desktop client with a fiber optic connection in Singapore (just to name a few).

Go ahead and submit the test form.  Once the test resolves, you’ll first notice the waterfall snapshot Webpagetest.org returns.  This is a reading of the application’s resources (images, JavaScript execution, external API calls, the works).  It should look very familiar if you have debugged a web site using a browser’s developer tools console.

webpagetest waterfall

Webpagetest.org’s waterfall report

This waterfall readout gives us a visual timeline of all the assets our web page must load for it to be active for the end user, in the order they are loaded, while recording the time taken to load and/or execute each element.

From here, we can determine which resources which have the longest load times, the largest physical foot prints and give us a clue as to how we might better optimize the application or web page.

Webpagetest.org’s content breakdown chart

In addition to our waterfall chart, our test results can provide any more data points, including but not limited to:

  • Content breakdown by asset type
  • CPU utilization
  • Bandwidth utilization
  • Screen shots and video capture of page load

Armed with this information from our test execution, you can begin to see where we might decide to make adjustment to our site to increase client-side performance.

Getting Programmatic:

Webpagetest.org’s web UI provides some great, easy-to-use features.  However, we can automated these tests using Webpagetest.org’s API.

In our next couple of steps, we’ll demonstrate how to do just that using Jenkins, some command line tools and Webpagetest.org’s public API, which you can read more about here.

Before Going Forward:

There are a few limitations or considerations regarding using Webpagetest.org and its API:

  • All test results are publicly viewable
  • API usage requires you to submit an email address to generate an API key
  • API requests are limited to 200 test runs per day
  • The maximum number of concurrent test runs allowed is 9

If test result confidentiality or scalability is a major concern, you may want to skip to the end of this article where we discuss using private instances of Webpagetest.org’s service.

Requirements:

 As mentioned above, we need an API key from Webpagetest.org. Just visit https://www.webpagetest.org/getkey.php and submit the form made available there.  You’ll then receive an email containing your API key.

Once you have your API key – lets set up a test using as CI service.  For this, like in our other test tutorials, we’ll be using Jenkins.

For this walkthrough, we’ll use the following:

  • Webpagetest’s public API
  • Jenkins
  • NodeJS (be sure your Jenkins instance has at least 1 server capable of using NodeJS 6 or above)
  • Webpagetest (a node module that provides a command-line wrapper for their API)
  • Jq-cli (a node module that provides JQ – a JSON query tool)
  • Wget-improved (a node implementation of the wget CLI tool – skip this if your Jenkins servers already have this binary installed).

Setting Up the Initial Job:

First, let’s get the Jenkins job up and running and make sure we can use it to reach our primary testing tool.

Do the following:

  • Log into Jenkins
  • Navigate to a project folder you wish your job to reside in
  • Click New Item
  • Give the job a name, select Freestyle Project from the menu and click OK

Now that the job is created, let’s set a few basic parameters:

  • Check ‘Discard old builds’
  • Set the Max # of Builds value to 100
  • Check the ‘Provide Node & npm bin/ folder to PATH’ option then choose your desired Node version (if this option is unavailable, see your system administrator).

jenkins-node

Specifying a NodeJs version for Jenkins to use

Next, let’s create a temporary build step to verify our job can reach Webpagetest.org

  • Click the ‘Add Build Step’ menu button
  • Select ‘Execute shell’
  • In the text box that appears, past in the following Curl command:
    •  curl http://webpagetest.org -s –f 
  • Save changes to your job and click the build option on the main job settings screen

Once the job has executed, click on the build icon and select the console output option.  Review the console output captured by Jenkins.  If you see HTML output captured at the end of the job, congratulations, your Jenkins instance can talk to Webpagetest.org (and its API).

Now we are ready to configure our actual job.

The Task at Hand:  

 The next steps will walk you through creating a test script.  The purpose of this script is as follows:

  • Install a few command line tools in our Jenkins instance when executed
  • Use these tools to execute a test using Webpagetest.org’s API
  • Determine when our test execution is complete
  • Collect and preserve our results in the following manner:
    • HAR (HTTP Archive)The entire test result data in JSON format
    • A PNG of our application’s waterfall
  • Filter our results for a specific element’s statistic we wish to know about

Adding Tools:

Click on the configure link for your job and scroll to the shell execution window.  Remove your curl command and copy the following into the window:

npm install -g webpagetest
npm install -g jq-cli-wrapper
npm install -g wget-improved

If you know that your Jenkins environments comes deployed with wget already installed, you can skip the last npm install command above.

Once this portion of the script executes, we’ll now have a command line tool to execute tests against Webpagetest’s API.  This wrapper makes it somewhat easier to work with the API, reducing the amount of syntax we’ll need for this script.

Next in our script, we can declare this command that will kick off our test:

webpagetest test $SITE -k $APIKEY -r $RUNS &gt; test_exec.json
&lt;span style="font-size: 1rem;"&gt;testId=$(cat test_exec.json | jq .data.testId)
&lt;/span&gt;testId="${testId%\"}"
testId="${testId#\"}"
echo $testId

This script block calls the API, passing it some variables (which we’ll get to in a minute) then saves the results to a JSON file.

Next, we use the command line tools cat and jq to sort our response file, assigning the testId key value from that file to a shell variable.  We then use some string manipulation to get rid of a few extraneous quotation marks in our variable.

Finally, we print the testId variable’s contents to the Jenkins console log.  The testId variable in this case should now be set to a unique string ID assigned to our test case by the API.  All future API requests for this test will require this ID.

Adding Parameters:

Before we go further, let’s address the 3 variables we mentioned above.  Using shell variables in the confines of the Jenkins task will give us a bit more flexibility in how we can execute our tests.  To finish setting this part up, do the following:

  • In the job configuration screen, scroll to and check the ‘This build is parameterized’ option.
  • From the dropdown menu, select String Parameter
  • In the name field, enter SITE
  • For the default field, enter a URL you wish to test (e.g. http://www.bazaarvoice.com)
  • Repeat this process for the APIKEY and RUNS variables
  • Set the RUNS parameter to a value of 1
  • Set the default value for the APIKEY parameter to your Webpagetest.org API key.

Save changes to your job and try running it.  See if it passes.  If you view the console output form the run, there’s probably not much you’ll find useful.  We have more work to do.
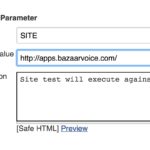
site-parameter

Your site parameter should look like this
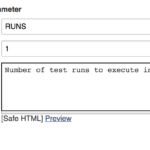
Your runs parameter should look like this
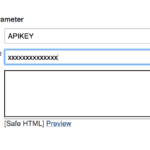
And your key parameter should looks like this

Waiting in Line:

The next portion of our script is probably the trickiest part of this exercise.  When executing a test with the Webpagetest.org web form, you probably noticed that as your test run executes, your test is placed into a queue.

waiting

Cue the Jeopardy! theme…

Depending current API usage, we won’t be able to tell how long we may be waiting in line for our test execution to finish.  Nor will we know exactly how long a given test will take.

To account for that, next we’ll have to modify our script to poll the API for our test’s status until our test is complete.  Luckily, Webpagetest.org’s API provides a ‘status’ endpoint we can utilize for this.

Add this to your script:

webpagetest status $testId -o status.json
testStatus=$(cat status.json | jq .data.testsCompleted)

Using our API wrapper for webpage test and jq, we’re posting a request to the API’s status endpoint, with our test ID variable passed as an argument.  The response then is saved to the file, status.json.

Next, we use cat and jq to filter the content of status.json, returning the contents of the ‘testsCompleted’ (which is a child of the ‘data’ node) within that file.  This gets assigned to a new variable – testStatus.

Still Waiting in Line:


long line

Just like going to the DMV

The response returned when polling the status endpoint contains a key called ‘status’ with possible values set to ‘In progress’ or ‘Completed’.  This seems like the perfect argument we would want to check to monitor our test status.However, in practice, this key-value pair can be set prematurely – returning a value of ‘Completed’ when not necessarily every run within our test set has finished.  This can result in our script attempting to retrieve an unfinished test result – which would be partial or empty.

After some trial and error, it turns out that reading the ‘testsCompleted’ key from the status response is a more accurate read as to the status of our tests.  This key contains an integer value equal to the number of test runs you specified that have completed execution.

Add this to your script:

while [ "$testStatus" != "$RUNS" ]
do
sleep 10
webpagetest status $testId -o status.json
testStatus=$(cat status.json | jq .data.testsCompleted)
done

This loop compares the number of tests completed with the number of runs we specified via our Jenkins string variable, $RUNS.

While those two variables are not equal, we request our test’s status, overwrite the status.json file with our new response, filter that file again with jq and assign our updated ‘testsCompleted’ value to our shell variable.

Note that the 10 second sleep command within the loop is optional.  We added that as to not overload the API with requests every second for our test’s status.

Once the condition is met, we know that the number of tests runs we requested should be the same number completed. We can now move on.

Getting The Big Report:

Once we have passed our while loop, we can assume that our test has completed.  Now we simply need to retrieve our results:

webpagetest har $testId -o results.har

webpagetest results $testId -o results.json

Webpagetest’s API provides multiple options to retrieve result information for any given test.  In this case, we are asking the API to give us the test results via HAR format.

Note – if you wish to deliver your test results in HAR format, you will need a 3rd party application or service to view .har files.  There are several options available including stand-alone applications such as Charles Proxy and Har Viewer.

Additionally, we are going to retrieve the test results from our run using the API’s results endpoint and assign this to a JSON file – results.json.

Now would be a great time to save the changes we’ve made to your test.

Getting the Big Picture:

Next, we want to retrieve the web application’s waterfall image – similar to what was returned when executing our test via the Webpagetest.org web UI.

To do so, add this to your script:

waterfallImage=$(cat results.json | jq '.data.runs."1".firstView'.images.waterfall)
waterfallImage="${waterfallImage%\"}"
waterfallImage="${waterfallImage#\"}"
nwget $waterfallImage -O waterfall.png

Since we’ve already retrieved our test results and saved them to the results.json file, we simply need to filter this file for a key-value pair that contains the URL for where our waterfall snapshot resides online.

In the results.json file, the main parent that contains all test run information is the ‘data’ node.  Within that node, our results are divided up amongst each test run.  Here we will further filter our results.json object based on the 1st test run.

Within that test run’s ‘firstView’ node, we have an images node that contains our waterfall image.

We then assign the value of that node to another shell variable (and then use some string manipulation to trim off some unnecessary leading and ending quotation characters).

Finally, as we installed the nwget module at the beginning of this script, we invoke it, passing the URL of our waterfall image as an argument and the option to output the result to a PNG file.

Archiving Results:

Upon each execution, we wish to save our results files so that we can build a collection of historical data as we continue to build and test our application.  Doing this within Jenkins is easy

Just click on the ‘Add Post Build Action’ button within the Jenkins job configuration menu and select ‘Archive the artifacts’ from the menu.

In the text field provided for this new step, enter ‘*.har, results.json, waterfall.png’ and click save.

Now, when you run your test job – once the script succeeds, it will save each instance of our retrieved HAR, waterfall image and results.json file to each respective Jenkins run.

Once you save your job configuration, click the ‘Build with Parameters’ button and try running it.  Your artifacts should be appended to each job run once it completes.

results

Collecting your results in Jenkins

Like a Key-Value Pair in a JSON Haystack:

Next, we’re going to talk about result filtering.  The results.json provided initially by the API is exhaustive in size.  Go ahead and scroll through that file saved from your last successful test run (you will probably be scrolling for a while).  There’s a mountain of data there but let’s see if we can fish some information out of the pile.

The next JSON-relative trick we’re going to show you is how you can filter the results.json from Webpagetest.org down to a specific object you wish to measure statistics for.

The structure of the results.json lists every web element (from .js libraries to images, to .css files) called during the test and enumerates some statistics about it (e.g. time to load, size, etc.).  What if your goal is to monitor and measure statistics about a very specific element within your application (say, a custom .js library you ship with your app)?

needle-in-a-haystack

That’s one way of finding it…

For that purpose, we’ll use cat and js again to filter our results down to one, specific file/element’s results.  Try adding something like this to your script:

cat results.json | jq '.data.runs."1".firstView.requests[] | select(.url | contains(" <a unique identifying string for your web element> "))' > stats.json

This is similar to how we filtered our results to obtain our waterfall image above.  In this case, each test result from Webpagetest.org contains a JSON array called ‘requests’.  Each item in the array is delineated by the URL for each relative web element.

Our script command above parses the contests of results.json, pulling the ‘results’ array out of the initial test run, then filtering that array based on the ‘url’ key, provided that key matches the string we provided to jq’s ‘contains’ method.

These filtered results are then output to the stats.json file.  This file will contain the specific test result statistics for your specific web element.

Add stats.json to the list of artifacts you wish to archive per test run.  Now save and run your test again.  Note, you may need to experiment with the arguments passed to JQ’s contains method to filter your results based on your specific needs.

Next Steps:

At this point, we should have a Jenkins job that contains a script that will allow us to execute tests against Webpagetest.org’s public API and retrieve and archive test results in a set of files and formats.

This can be handy in of itself but what if you have team or organization members who need access to some or all of this data but do not have access to Jenkins (for security purposes or otherwise)?

Some options to expose this data to other teams could be:

  • Sync your archived elements to a publicly available bucket in Amazon S3
  • Have a 3rd party monitoring service (Datadog, Sumo Logic, etc.) read and report test findings
  • Send out email notifications if some filtered stat within our results exceeds some threshold

There’s quite a few ideas to expand upon for this kind of testing and reporting.  We’ll cover some of these in a future blog post so stay tuned for that.

Private or Testing and Wrap-Up:

If you find this method of performance testing useful but are feeling a bit limited by Webpagetest.org’s restrictions on their public API (or the fact that all test results are made public), it is worth mentioning that if you’re needing something more robust or confidential, you can host your own, private instance of the free, open-source API (see Webpagetest.org’s github project for documentation).

Additionally, Webpagetest.org also has pre-built versions of their app available as Amazon EC2 AMIs for use by anyone with AWS access.  You can find more information on their free AMIs here.

Additionally, here’s the script we’ve put together through this post in its entirety:


npm install -g webpagetest
npm install -g jq-cli-wrapper
npm install -g wget-improved

webpagetest test $SITE -k $APIKEY -r $RUNS &gt; test_exec.json
&lt;span style="font-size: 1rem;"&gt;testId=$(cat test_exec.json | jq .data.testId)
&lt;/span&gt;testId="${testId%\"}"
testId="${testId#\"}"
echo $testId

webpagetest status $testId -o status.json
testStatus=$(cat status.json | jq .data.testsCompleted)

while [ "$testStatus" != "$RUNS" ]
do
sleep 10
webpagetest status $testId -o status.json
testStatus=$(cat status.json | jq .data.testsCompleted)
done

waterfallImage=$(cat results.json | jq '.data.runs."1".firstView'.images.waterfall)
waterfallImage="${waterfallImage%\"}"
waterfallImage="${waterfallImage#\"}"
nwget $waterfallImage -O waterfall.png

cat results.json | jq '.data.runs."1".firstView.requests[] | select(.url | contains(" <a unique identifying string for your web element> "))' > stats.json

We hope this article has been helpful in demonstrating how some free tools and services can be used to quickly stand up performance testing for your web applications.  Please check back with our R&D blog soon for future articles on this and other performance related topics.



My Hacktoberfest

This past October I participated in an awesome Open Source event called “Hacktoberfest”, sponsored by Digital Ocean and GitHub.

Hacktoberfest is a month-long celebration of Open Source where developers are encouraged to contribute to the community. Participation is easy:

  1. Pull requests can be made in any GitHub-hosted repositories/projects.
  2. A contribution can be anything—fixing bugs, creating new features, or updating and writing documentation.

Further, if you opened four pull requests in Open Source repositories between October 1st and October 31st you would win a cool Hacktoberfest t-shirt and other swag.

Maintainers of Open Source projects (including some here at BV) were asked to tag open issues with “Hacktoberfest” if they wanted help with that issue during the event. GitHub provides the ability to search issues based tags, so it was really easy to find cool projects and issues to work on.

I personally started off small, helping one team track down a bug with their JSON files, and another finish a database for movies used by their front-end application (similar to IMDB).

Next I found a Hacktoberfest issue in the the New York Times’s kyt repository. Kyt is a build, test and development tool for advanced JavaScript apps. I ended up helping them fix a bug in one of their setup scripts.

Then came my Hacktoberfest pièce de résistance.

In my 20% time here at Bazaarvoice I had been playing around with browser extensions / add-ons, specifically in an effort to make implementing our products easier for our clients. So when I saw that Mozilla and the Mozilla Developer Network (MDN) were asking for someone to create a browser extension for them, I was immediately interested.

They noticed that a popular type of extension being authored was what they were calling a “replacement” add-on, something that would replace words or phrases in a web page with alternate words, or images, etc.

In their Web Extensions Examples repository, they were looking for an example of such an add-on that they could turn into a “How to Write your First Add-On” tutorial. Thus their two main requirements were:

  1. The code must be simple and easy to follow for beginners.
  2. The code must be performant because it would likely be copied a lot.

Seeing as how readability and performance are two of the main things that we check for in every code review here at Bazaarvoice, this was right up my alley!

I was so excited that I stayed up all weekend to finish the project:

I submitted my pull request, worked with the developers at Mozilla, and was so proud when my Emoji Substitution contribution was merged into their repository. What a rush!

As we traded Hacktoberfest-themed emoji (???? and ???? were my favorites), fixed bugs, and fleshed out their projects, it was really cool to lend my expertise and experience the gratitude of all the teams I worked with – this is what Open Source is all about!

I had a great time participating in Hacktoberfest this year and will definitely do it again next year. You should join me!

Cross-Platform Mobile SDK Testing

This Bazaarvoice blog entry is co-authored by Tanvir Pathan as part of a Bazaarvoice internship project on the Bazaarvoice Mobile Team.

Automated testing of native mobile applications has long been a pain point in the world of mobile app development. If you are creating and distributing apps or open source SDKs across two or more major platforms (Android and iOS in our case), you can easily find yourself duplicating efforts to test the same source and business logic across different technology stacks. For example, if you have experienced developers and testers using Xcode for iOS apps, they may tend to automate testing with Instruments Automation, where Android developers and testers may automate with Espresso or UIAutomator. This becomes an expensive proposition for development and maintenance of unit tests, which can be costly as your test coverage increases.

Test strategy can also vary depending on the type of mobile app development your shop pursues: native, hybrid, cross-compile, mobile web. Hence, the selection of test tools will vary depending on how you build and deploy apps.

In this blog post, we’ll detail a novel solution to cross-platform testing of our native SDKs, along with some background of other mobile tool offerings. Our solution focuses on cross-platform open source mobile SDK testing utilizing Cordova to wrap our SDKs in a generic JavaScript interface, and Calabash to drive our cross-platform behavioral tests.

If you want to check out the full solution, the Cordova plugin and description on how to execute Calabash can be found in our Github repository.

How to View Mobile Application Development

Non-mobile app developers typically don’t actually know the difference between a web app, native, or hybrid app. If you work in any business that supports some kind of mobile solution (and you probably wouldn’t be reading this if you didn’t) it’s really important to understand some fundamental differences. It’s very easy to just throw out the word “mobile” in conversation and not realize there’s multiple parts to this elephant!

blindmen

The table below presents four general categories of mobile application development. Keep these categories in mind when talking about “mobile” in general and don’t fall in the trap of the blind men and the elephant.

Mobile Development Types & Tools

Type
Description
Tools
Native Application Development Developers creating purely native apps will write in the language supported by their target platform. For iOS apps, developers can write in Swift and/or Objective-C, while Android developers can write in Java (and C/C++ for lower level execution)
Cross-compilation Developers can also write apps for multiple platforms in a single language, such as Java Script. Cross-compilation tools will take a common language and actually convert it to the target language of the native platform. In this case, while developers aren’t writing in the native language, the tools create real native apps. Some of the most common tools are: Appcelerator (JavaScript), Xamarin (C#), React Native (Java Script)
Hybrid Applications Hybrid apps utilize Web Views to display content, typically written with common web development technologies such as Java Script, HTML, and CSS. Hybrid apps will typically have a “bridge” that allows javascript code to communicate with the native libraries to do things like access the camera, location services, or contacts. Cordova (aka PhoneGap) as the application container. Developers choose their favorite UI layer to work with Corodva: ionic, Sencha Touch, jQuery Mobile, Onsen, Framework 7.
Web Applications / Mobile Web A web application isn’t as much an application as it is a mobile optimized web site. Hence, you won’t find a Web Application in the App or Google Play Store, you just fire up your favorite mobile web browser and load the site.

Cross Platform Mobile UI Testing Tools

When developing for native mobile, developers will typically write unit tests to check individual pieces of functionality and business logic, perhaps even employ certain mocking techniques to test networking and user interface capabilities without the need for a full application. However, when it comes to full system testing of full applications and SDKs, making the right selection can be a tough process. However, if cross-platform testing is your objective and you want to write all your tests in one common scripting language, the options narrow quickly.

While there are platform-specific UI automation frameworks for Android (Robotium, UiAutomation) and iOS (Instruments Automation, Keep It Functional, EarlGrey), there currently only two (that we are aware of) that allow us to test cross-platform with a common script.

Tool
Summary
Appium Appium lets developers write tests for applications without having to add any additional code the applications. It works with native, hybrid, and mobile web applications.
Calabash Calabash is owned and maintained by Xamarin, and provides cross-platform testing for native or hybrid apps. Unit tests can be written in Ruby with Cucumber.

2 Birds, One Stone

kill2birds3

Making the decision to use Cordova and Calabash was fairly easy. First we already distribute our BBVSD via frameworks and libraries for iOS and Android. Second we know some of our customers are creating hybrid applications with Corodva. So we immediately thought: what if we could create a test environment that not only tests our SDK deliverables, but also provides our clients with an easy avenue to integrate Bazaarvoice services into their own Cordova app. Win! Win! As well, because we already use Cucumber extensively at Bazaarvoice, we decided to leverage our already strong in-house expertise and utilize an automation framework that is internally familiar.

Calabash Unit Tests

Another great thing about using Calabash at Bazaarvoice is that we already have an internal framework developed on top of Cucumber. Because Calabash layers on top of Cucumber, the paradigm and philosophy of writing human readable test cases still applies. The test cases utilize Behavior Driven Development  modeling tools to add meaning to your mobile app testing.

Let’s say you are creating the same app for multiple platforms. Typically, you would have to write completely different sets of code to run similar tests. With Calabash, this is not the case. You write one set of code tests and make slight adjustments depending on the platforms in question and you are done!  Best of all, in addition to Calabash being free, the test cases are super easy to write as a developer and even easier to read for others who may be interested in checking out the health of the project.

Needless to say, Calabash provides a lot of benefits for cross platform testing. Lets take a look at an example test case from the BVSDK Cordova Plugin project. Let’s go through a simple scenario based on the following app screens shots from the iOS simulator.

bvsdk_build_simulator bvsdk_running_simulator

Say you wanted to count the number of products that were recommended by our Product Recommendations API. If you were doing it manually you would go through the following steps:

  1. Wait for the app to launch
  2. Make sure you receive a success alert and press ok
  3. Click the Recommendations tab
  4. Then count how many products there are and compare them to what you were expecting

Now how would we code this? Calabash has two essential components: one feature file and one ruby file. The feature file is where you write out the tests and the ruby file is used primarily to make custom functions if needed (although most of what you need comes right out of the box). So returning to our problem, writing out the test case, you simply write down those exact steps in the feature file:

Feature File
Feature: BVSDK Demo App
@recommendations_test
  Scenario: As a user, I want to get new recommendations
    Given the app has launched
    Then I should see "BVSDK has been built successfully."
    Then I press the OK button
    Then I press Recommendations tab
    Then I check number of products

mindblown

That’s really all there is to it. Of course, tests can be also written to be more platform specific when needed.

Entering the Matrix – Travis CI

We use Travis CI for all our public repos at Bazaarvoice. It’s awesome. But, we have to support multiple build tools on different virtual machines. Configuring all these build machines with custom tools sounds and build scripts really scary! Freak out!

matrix

The really slick thing about Travis CI is that you can test multiple configuration, variations, permutations, salutations, etc, etc, etc, by building a matrix in Travis’ Config file (.travis.yml). For our testing, since XCode only runs on OS X and it’s the only way to build for iOS, we must have an OS X image. For the Android Studio and Gradle build tools, we build against Linux. In addition there’s some common tooling we can install for each build machine. The result is that we can use two different VMs for testing each platform, with just one set of tests. Note in the test result below, the build jobs are defined by the environment variables defined in the Travis config file.

travis_matrix

The .travis.yml script looks like this, where we build a matrix with environment variables and platforms:

matrix:
  include:
    - language: android
      env: TO_TEST=ANDROID
      jdk: oraclejdk8
    - os: osx
      osx_image: xcode8
      env: TO_TEST=IOS
  fast_finish: true
android:
  components:
    - platform-tools
    - tools
    - android-23
    - build-tools-23.0.3
    - extra-android-m2repository
    - extra-google-m2repository
    - sys-img-armeabi-v7a-android-19
install:
  - rvm install 2.2.0
  - if [ "$TO_TEST" = "ANDROID" ]; then gem install calabash-android; fi
  - if [ "$TO_TEST" = "IOS" ]; then gem install calabash-cucumber; fi
before_script:
  - if [ "$TO_TEST" = "ANDROID" ]; then chmod 755 createEmulator.sh; fi
  - if [ "$TO_TEST" = "ANDROID" ]; then ./createEmulator.sh; fi
script:
  - if [ "$TO_TEST" = "ANDROID" ]; then chmod 755 androidTest.sh; fi
  - if [ "$TO_TEST" = "ANDROID" ]; then ./androidTest.sh; fi
  - if [ "$TO_TEST" = "IOS" ]; then chmod 755 iosTest.sh; fi
  - if [ "$TO_TEST" = "IOS" ]; then ./iosTest.sh; fi

BVSDK Cordova Plugin Features

So what if I want to try out the BVSDK Cordova plugin? If you want more info or checkout the source code for the plugin and unit tests, just head over to our Cordova Github repo. There’s plenty of info in the README for running the examples and unit tests.

Open Source Contributions

If you are building a Cordova-based application and want to see other things added just let us know, or better yet submit a pull request and we’ll be happy to review it!

Injecting Applications onto Third-Party Webpages Made Easy

Bazaarvoice’s Small Web App Technologies (SWAT) team is pleased to announce that we are open sourcing swat-proxy – a tool to inject applications onto third-party webpages.

In third-party web application development it is difficult to be certain how our applications will look and behave on a client’s webpage until they are implemented. Any number of things could interfere – including other third-party applications! Delivering applications that don’t work can obviously have a severe negative impact on both our clients and us.

One solution is to inject – or proxy – our applications onto the client’s web page. This way we can ensure they work correctly – before they go into production. I wrote swat-proxy to do exactly that, acting as a man-in-the-middle between browser and web server. As the browser requests web pages from the server, swat-proxy intercepts the response and proxies our application into it. The browser renders the web page as if it contained our application all along – exactly simulating the client having implemented it. Now we can be certain how our applications will look and behave.

Other tools exist to accomplish this task, but none are as front-end developer-friendly as swat-proxy: it is written entirely in Javascript – plugging in nicely to our existing workflows – and uses familiar CSS selectors to target DOM elements when injecting content. It is run locally using NodeJS and is very easy to use.

We have found swat-proxy to be incredibly useful when rapidly iterating on prototypes and ensuring the behavior of our applications before they are released to production – we hope you do too! We are releasing it to the larger world as open source, under the Apache 2.0 license. Please download it, try it out, and let us know what you think (in comments below, or as issues or pull requests on Github).

Front End Application Testing with Image Recognition

One of the many challenges of software testing has always been cross-browser testing. Despite the web’s overall move to more standards compliant browser platforms, we still struggle with the fact that sometimes certain CSS values or certain JavaScript operations don’t translate well in some browsers (cough, cough IE 8).

In this post, I’m going to show how the Curations team has upgraded their existing automation tools to allow for us to automate spot checking the visual display of the Curations front end across multiple browsers in order to save us time while helping to build a better product for our clients.

The Problem: How to save time and test all the things

The Curations front end is a highly configurable product that allows our clients to implement the display of moderated UGC made available through the API from a Curations instance.

This flexibility combined with BV’s browser support guidelines means there are a very large number ways Curations content can be rendered on the web.

Initially, rather than attempt to test ‘all the things’, we’ve codified a set of possible configurations that represent general usage patterns of how Curations is implemented. Functionally, we can test that content can be retrieved and displayed however, when it comes whether that the end result has the right look-n-feel in Chrome, Firefox and other browsers, our testing of this is largely manual (and time consuming).

How can we better automate this process without sacrificing consistency or stability in testing?

Our solution: Sikuli API

Sikuli is an open-source Java-based application and API that allows users to automate web, mobile and OS applications across multiple platforms using image recognition. It’s platform based and not browser specific, so it enables us to circumvent limitations with screen capture and compare features in other automation tools like Webdriver.

Imagine writing a test script that starts with clicking the home button within an iOS simulator, simply by providing the script a .png of the home button itself. That’s what Sikuli can do.

You can read more about Sikuli here. You can check out their project here on github.

Installation:

Sikuli provides two different products for your automation needs – their stand-alone scripting engine and their API. For our purposes, we’re interested in the Sikuli API with the goal to implement it within our existing Saladhands test framework, which uses both Webdriver and Cucumber.

Assuming you have Java 1.6 or greater installed on your workstation, from Sikuli.org’s download page, follow the link to their standalone setup JAR

http://www.sikuli.org/download.html

Download the JAR file and place it in your local workstation’s home directory, then open it.

Here, you’ll be prompted by the installer to select an installation type. Select option 3 if wish to use Sikuli in your Java or Jython project as well as have access to its command line options. Select option 4 if you only plan on using Sikuli within the scope of your Java or Jython project.

Once the installation is complete, you should have a sikuli.jar file in your working directory. You will want to add this to your collection of external JARs for your installed JRE.

For example, if you’re using Eclipse, go to Preferences > Java > Installed JREs, select your JRE version, click Edit and add Sikuli.jar to the collection.

Alternately, if you are using Maven to build your project, you can add Sikuli’s API to your project by adding the following to your POM.XML file:

<dependency>
    <groupId>org.sikuli</groupId>
    <artifactId>sikuli-api</artifactId>
    <version>1.2.0</version>
</dependency>

Clean then build your project and now you’re ready to roll.

Implementation:

Ultimately, we wanted a method we could control using Cucumber that allows us to articulate a web application using Webdriver that could take a screen shot of a web application (in this case, an instance of Curations) and compare it to a static screen shot of specific web elements (e.g. Ratings and Review stars within the Curations display).

This test method would then make an assumption that either we could find a match to the static screen element within the live web application or have TestNG throw an exception (test failure) if no match could be found.

First, now that we have the ability to use Sikuli, we created a new helper class that instantiates an object from their API so we can compare screen output.

import org.sikuli.api.*;
import java.io.IOException;
import java.io.File;
/**
* Created by gary.spillman on 4/9/15.
*/
public class SikuliHelper {

public boolean screenMatch(String targetPath) {
new ImageTarget(new File(targetPath));

Once we import the Sikuli API, we create a simple class with a single class method. In this case, screenMatch is going to accept a path within the Java project relative to a static image we are going to compare against the live browser window. True or false will be returned depending on if we have a match or not.

//Sets the screen region Sikuli will try to match to full screen
ScreenRegion fullScreen = new DesktopScreenRegion();

//Set your taret to compare from
Target target = new ImageTarget(new File(targetPath));

The main object type Sikuli wants to handle everything with is ScreenRegion. In this case, we are instantiating a new screen region relative to the entire desktop screen area of whatever OS our project will run on. Without passing any arguments to DesktopScreenRegion(), we will be defining the region’s dimension as the entire viewable area of our screen.

double fuzzPercent = .9;

try {
    fuzzPercent = Double.parseDouble(PropertyLoader.loadProperty(&quot;fuzz.factor&quot;));
}
catch (IOException e) {
    e.printStackTrace();
}
new ImageTarget(new File(targetPath));

Sikuli allows you to define a fuzzing factor (if you’ve ever used ImageMagick, this should be a familiar concept). Essentially, rather than defining a 1:1 exact match, you can define a minimal acceptable percentage you wish your screen comparison to match. For Sikuli, you can define this within a range from 0.1 to 1 (ie 10% match up to 100% match).

Here we are defining a default minimum match (or fuzz factor) of 90%. Additionally, we load in from a set of properties in Saladhand’s test.properties file a value which, if present can override the default 90% match – should we wish to increase or decrease the severity of test criteria.

target.setMinScore(fuzzPercent);
new ImageTarget(new File(targetPath));

Now that we know what fuzzing percentage we want to test with, we use target’s setMinScore method to set that property.

ScreenRegion found = fullScreen.find(target);

//According to code examples, if the image isn't found, the screen region is undefined
//So... if it remains null at this point, we're assuming there's no match.

if(found == null) {
    return false;
}
else {
    return true;
}
new ImageTarget(new File(targetPath));

This is where the magic happens. We create a new screen region called found. We then define that using fullScreen’s find method, providing the path to the image file we will use as comparison (target).

What happens here is that Sikuli will take the provided image (target) and attempt to locate any instance within the current visible screen that matches target, within the lower bound of the fuzzing percentage we set and up to a full, 100% match.

The find method either returns a new screen region object, or returns nothing. Thus, if we are unable to find a match to the file relative to target, found will remain undefined (null). So in this case, we simply return false if found is null (no match) or true of found is assigned a new screen region (we had a match).

Putting it all together:

To completely incorporate this behavior into our test framework, we write a simple cucumber step definition that allows us to call our Sikuli helper method, and provide a local image file as an argument for which to compare it against the current, active screen.

Here’s what the cucumber step looks like:

public class ScreenShotSteps {

    SikuliHelper sk = new SikuliHelper();

    //Given the image &quot;X&quot; can be found on the screen
    @Given(&quot;^the image \&quot;([^\&quot;]*)\&quot; can be found on the screen$&quot;)
    public void the_image_can_be_found_on_the_screen(String arg1) {

        String screenShotDir=null;

        try {
            screenShotDir = PropertyLoader.loadProperty(&quot;screenshot.path&quot;).toString();
        }
        catch (IOException e) {
            e.printStackTrace();
        }

        Assert.assertTrue(sk.screenMatch(screenShotDir + arg1));
    }
    new ImageTarget(new File(targetPath));
}

We’re referring to the image file via regex. The step definition makes an assertion using TestNG that the value returned from our instance of SikuliHelper’s screen match method is true (Success!!!). If not, TestNG throws an exception and our test will be marked as having failed.

Finally, since we already have cucumber steps that let us invoke and direct Webdriver to a live site, we can write a test that looks like the following:

Feature: Screen Shot Test
As a QA tester
I want to do screen compares
So I can be a boss ass QA tester

Scenario: Find the nav element on BV's home page
Given I visit &quot;http://www.bazaarvoice.com&quot;
Then the image &quot;screentest1.png&quot; can be found on the screen
new ImageTarget(new File(targetPath));

In this case, the image we are attempting to find is a portion of the nav element on BV’s home page:

screentest1

Considerations:

This is not a full-stop solution to cross browser UI testing. Instead, we want to use Sikuli and tools like it to reduce overall manual testing as much as possible (as reasonably as possible) by giving the option to pre-warn product development teams of UI discrepancies. This can help us make better decisions on how to organize and allocate testing resources – manual and otherwise.

There are caveats to using Sikuli. The most explicit caveat is that tests designed with it cannot run heedlessly – the test tool requires a real, actual screen to capture and manipulate.

Obviously, the other possible drawback is the required maintenance of local image files you will need to check into your automation project as test artifacts. How deep you will be able to go with this type of testing may be tempered by how large of a file collection you will be able to reasonably maintain or deploy.

Despite that, Sikuli seems to have a large number of powerful features, not limited to being able to provide some level of mobile device testing. Check out the project repository and documentation to see how you might be able to incorporate similar automation code into your project today.

Scoutfile: A module for generating a client-side JS app loader

A couple of years ago, my former colleague Alex Sexton wrote about the techniques that we use at Bazaarvoice to deploy client-side JavaScript applications and then load those applications in a browser. Alex went into great detail, and it’s a good, if long, read. The core idea, though, is pretty simple: an application is bootstrapped by a “scout” file that lives at a URL that never changes, and that has a very short TTL. Its job is to load other static resources with long TTLs that live at versioned URLs — that is, URLs that change with each new deployment of the application. This strategy balances two concerns: the bulk of application resources become highly cacheable, while still being easy to update.

In order for a scout file to perform its duty, it needs to load JavaScript, load CSS, and host the config that says which JS and CSS to load. Depending on the application, other functionality might be useful: the ability to detect old IE; the ability to detect DOM ready; the ability to queue calls to the application’s methods, so they can be invoked for real when the core application resources arrive.

At Bazaarvoice, we’ve been building a lot of new client-side applications lately — internal and external — and we’ve realized two things: one, it’s very silly for each application to reinvent this particular wheel; two, there’s nothing especially top secret about this wheel that would prevent us from sharing it with others.

To that end, I’m happy to release scoutfile as an NPM module that you can use in your projects to generate a scout file. It’s a project that Lon Ingram and I worked on, and it provides both a Grunt task and a Node interface for creating a scout file for your application. With scoutfile, your JavaScript application can specify the common functionality required in your scout file — for example, the ability to load JS, load CSS, and detect old IE. Then, you provide any code that is unique to your application that should be included in your scout file. The scoutfile module uses Webpack under the hood, which means you can use loaders like json! and css! for common tasks.

The most basic usage is to npm install scoutfile, then create a scout file in your application. In your scout file, you specify the functionality you need from scoutfile:

var App = require('scoutfile/lib/browser/application');
var loader = require('scoutfile/lib/browser/loader');

var config = require('json!./config.json');
var MyApp = App('MyApp');

MyApp.config = config;

loader.loadScript(config.appJS);
loader.loadStyleSheet(config.appCSS);

Next, you can generate your scout file using a simple Node script:

var scout = require('scoutfile');
scout.generate({
  appModules: [
    {
      name: 'MyApp',
      path: './app/scout.js'
    }
  ],

  // Specify `pretty` to get un-uglified output.
  pretty: true
}).then(function (scout) {
  console.log(scout);
});

The README contains a lot more details, including how to use flags to differentiate production vs. development builds; how to configure the Grunt task; how to configure the “namespace” that is occupied on window (a necessary evil if you want to queue calls before your main application renders); and more.

There are also several open issues to improve or add functionality. You can check out the developer README if you’re interested in contributing.

Open sourcing cloudformation-ruby-dsl

Cloudformation is a powerful tool for building large, coordinated clusters of AWS resources. It has a sophisticated API, capable of supporting many different enterprise use-cases and scaling to thousands of stacks and resources. However, there is a downside: the JSON interface for specifying a stack can be cumbersome to manipulate, especially as your organization grows and code reuse becomes more necessary.

To address this and other concerns, Bazaarvoice engineers have built cloudformation-ruby-dsl, which turns your static Cloudformation JSON into dynamic, refactorable Ruby code.

https://github.com/bazaarvoice/cloudformation-ruby-dsl

The DSL closely mimics the structure of the underlying API, but with enough syntactic sugar to make building Cloudformation stacks less painful.

We use cloudformation-ruby-dsl in many projects across Bazaarvoice. Now that it’s proven its value, and gained some degree of maturity, we are releasing it to the larger world as open source, under the Apache 2.0 license. It is still an earlier stage project, and may undergo some further refactoring prior to it’s v1.0 release, but we don’t anticipate major API changes. Please download it, try it out, and let us know what you think (in comments below, or as issues or pull request on Github).

A big thanks to Shawn Smith, Dave Barcelo, Morgan Fletcher, Csongor Gyuricza, Igor Polishchuk, Nathaniel Eliot, Jona Fenocchi, and Tony Cui, for all their contributions to the code base.