Your product catalog is more than just a list of items; it’s the backbone of your online presence and the engine that powers dynamic experiences for your customers. For Bazaarvoice clients, a well-structured and meticulously maintained product catalog is especially vital. It ensures that your valuable user-generated content (UGC)—like ratings, reviews —submitted and displayed flawlessly for its respective products.
At Bazaarvoice, our systems rely on your product catalog as the definitive source of truth for all product-related information. Whether you’re updating your catalog via a feed or by uploading an Excel file directly to the Bazaarvoice portal, adhering to a few best practices will unlock the full potential of your UGC program.
Let’s explore the key elements to focus on for an optimal product catalog:
1. The Power of a Precise Product Name
The product name is arguably the most critical piece of information in your catalog. It’s how your customers identify items on your site, and it’s equally important for our hosted display solutions and APIs.
Best Practice: Always ensure every product in your catalog has a clear, accurate, and consistent product name. This enables our APIs to retrieve and display product information correctly, ensuring that your reviews and ratings are always associated with the right item and appear prominently on your product pages. A complete product name allows for a rich, informative display that enhances the customer journey.
2. The Clarity of Consistent Category Information
Categories help organize your products and, by extension, your UGC. They allow customers to filter, browse, and discover content relevant to specific product types.
Best Practice: Assign every product to a valid and appropriate category ID within your catalog. Furthermore, ensure that the category names associated with these IDs are consistently provided and accurate. Proper category data facilitates seamless content submission by guiding user contributions to the correct product groupings. It also empowers your customers with intuitive navigation and filtering options on your hosted display solutions, making it easier for them to find the reviews that matter most to them.
3. Naming Conventions for Optimal Integration
Beyond simply having a name and category, the format of these identifiers can significantly impact how smoothly our systems process and display your data.
Best Practice: For product and category IDs, it’s highly recommended to use only hyphens (-) and underscores (_) as separators for multi-word identifiers. Avoid spaces, plus signs (+), and other HTML characters (like &, <, >, etc.). For a comprehensive list of HTML characters and their entities, you can refer to resources like the W3C HTML Entities list. This practice ensures compatibility across various systems and prevents potential encoding issues when data is transferred via APIs, leading to more robust and predictable data flow.
Your Catalog: The Core
Your product catalog information, securely housed within the Bazaarvoice database, is the ultimate source of truth for all your product data. By ensuring its accuracy and completeness, you establish a strong foundation that empowers every Bazaarvoice service you utilize.
When you consistently provide precise product ID, product names, category ID and valid category names in your catalog—whether through feeds or direct Excel uploads—you actively contribute to:
Seamless Display: Ensuring all your products and their rich UGC are accurately visible and attributed across Bazaarvoice display solutions and your website (if using our APIs).
Smooth Submissions: Guaranteeing that new reviews are submitted flawlessly and effortlessly linked to the correct products and categories.
Enhanced Data Integrity: Building a clean, reliable dataset that drives superior analytics and insights.
By embracing these best practices in your product catalog management, you empower your Bazaarvoice solutions to deliver the most impactful and engaging experiences for your customers, ultimately driving trust and conversions.
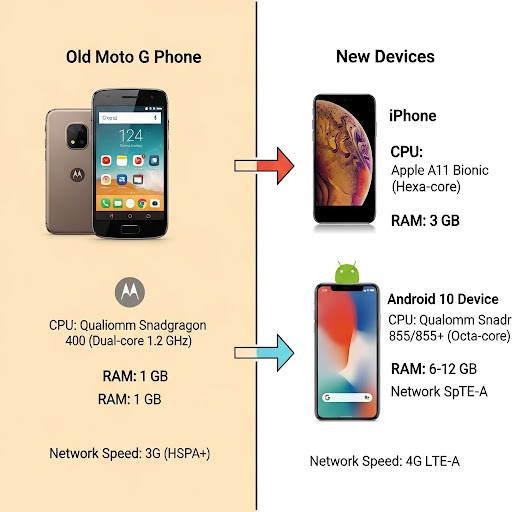
For years, the gold standard for benchmarking web performance, particularly for Google’s Core Web Vitals (CWV), has been a mobile device baseline—specifically, a throttled connection and CPU designed to simulate a Moto G4. This approach was established with good intentions: to ensure websites are accessible to users on older, lower-end devices and slower networks. It was a one-size-fits-all solution for a global audience.
However, the world has changed. The devices your customers use today are a far cry from the Moto G of years past. Relying on this outdated benchmark device is no longer an accurate measure of your user experience and, more importantly, it can lead to a poor return on investment (ROI) for your performance optimization efforts in the web layer.
This document will walk you through why a shift is necessary and present a new, data-driven benchmarking strategy based on the reality of your user traffic.
The Problem with the old Benchmark
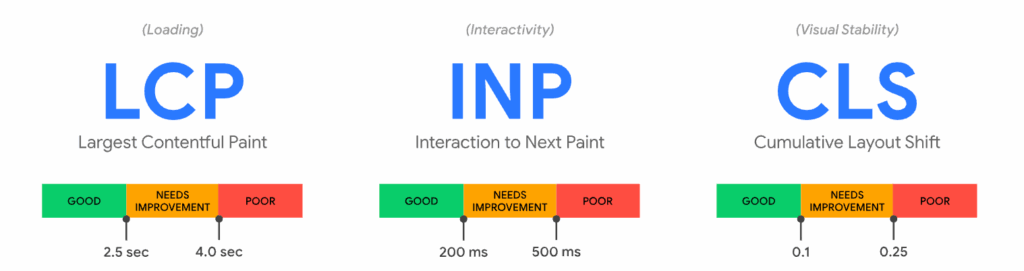
The Core Web Vitals we focus on—Largest Contentful Paint (LCP), Interaction to Next Paint (INP), and Cumulative Layout Shift (CLS)—are all heavily influenced by a device’s hardware and network. The Moto G benchmark, while a useful reference, presents three critical problems for e-commerce businesses:
The Hardware Mismatch: The Moto G4 was released in 2016, running on Android 6.0.1 (Marshmallow). Modern traffic data, however, tells a very different story. Our internal data from the Bazaarvoice Hosted Display component, which powers ratings and reviews on thousands of e-commerce sites, shows that the oldest version of iOS we see reaching our services is on an iPhone X, while the oldest Android OS is Android 10. Optimizing for a device running an OS that is multiple generations behind a significant portion of your user base is a fundamental mismatch.
The Network Gap: The Moto G benchmark simulates a slow 3G/4G network connection. Today’s reality is that the world is rapidly adopting faster networks. By the end of 2024, global 4G network coverage reached 90% of the population, and 5G mid-band population coverage was at 40% [1]. These modern networks, combined with the faster CPUs of current devices, drastically reduce the time needed for critical tasks like DNS lookups and SSL handshakes, which heavily influence your Time to First Byte (TTFB) and, consequently, your LCP.
The Negative ROI: The Moto G benchmark represents a minuscule, and frankly, a declining portion of your audience. The cost and effort of optimizing for the technical limitations of these devices—such as slow CPU and memory processing of HTTP/2 responses—simply do not provide a meaningful ROI. The Moto G itself is no longer in production, further cementing its irrelevance as a modern performance target.
Infographics – Market trends from 2024
Here is a look at some of the latest mobile market trends from 2024:
The Bazaarvoice Way (A Data-Driven Alternative)
At Bazaarvoice, our performance optimization strategy is driven by our clients’ real-world traffic data, not a static global benchmark. Our data reveals a powerful truth about your customers:
75%+ of all traffic to our Hosted Display component comes from mobile devices. This is a metric that is validated by global e-commerce trends, with multiple industry reports confirming that over 70% of e-commerce traffic is now mobile-driven [2, 3]. This highlights the critical importance of mobile performance.
The most-used devices are far more powerful than the Moto G. For example, we see that 41% of all traffic comes from iOS devices, with a significant concentration on recent versions. We also see that 21% of traffic comes from Android 10+ devices, with Android 10 itself generating a substantial amount of traffic at 15%. This mirrors broader market trends, especially in high-income regions, where iOS and newer Android devices dominate e-commerce traffic [4, 5].
This data allows us to propose a new, intelligent benchmarking strategy that delivers better user experience and a higher ROI.
Infographics – Device capacity comparison
This infographic illustrates the hardware and network gap between the old and new mobile devices:
The New Benchmarking Strategy
Instead of optimizing for an obsolete device, we recommend a two-pronged approach:
The “Golden Path” Benchmark: Optimize your web services and UI components for the devices your customers use most. In our case, this would mean ensuring exceptional performance on the newest iOS and Android devices, as they represent the majority of your traffic.
The “Long Tail” Benchmark: Use the oldest high-traffic devices in your dataset (e.g., iPhone X, Android 10) as your baseline to ensure a good experience for the widest possible audience. This approach focuses on the reality of your user base and prevents a small, but still relevant, group from having a poor experience.
By using this approach, you can take full advantage of the improved capabilities of modern devices. Faster CPUs and higher RAM on newer phones allow for quicker processing of complex JavaScript and UI rendering, leading to better LCP and INP values. This means your ratings and reviews content can appear faster, enhancing consumer trust and driving conversions without the compromises required by a legacy benchmark.
Infographics – Suggested benchmarking approaches
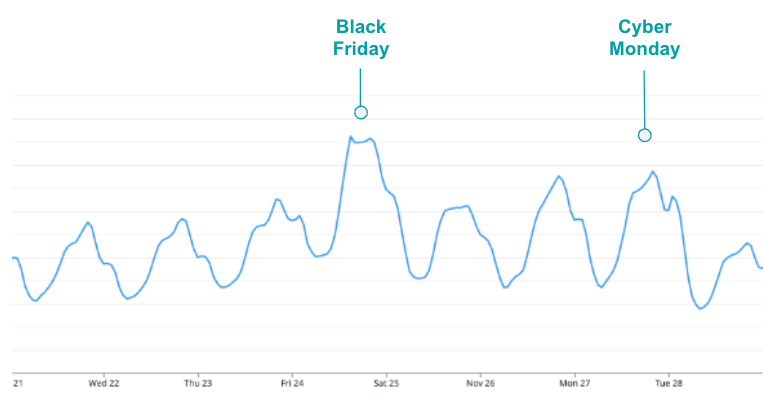
Data from BFCM 2024 traffic
Black Friday and Cyber Monday (BFCM) represent the peak traffic period for eCommerce, significantly boosting sales across all consumer segments. BFCM 2024 witnessed unprecedented mobile traffic, with industry reports indicating that mobile devices accounted for over 70% of all e-commerce traffic during this period. This underscores the critical importance of mobile-first optimization strategies.
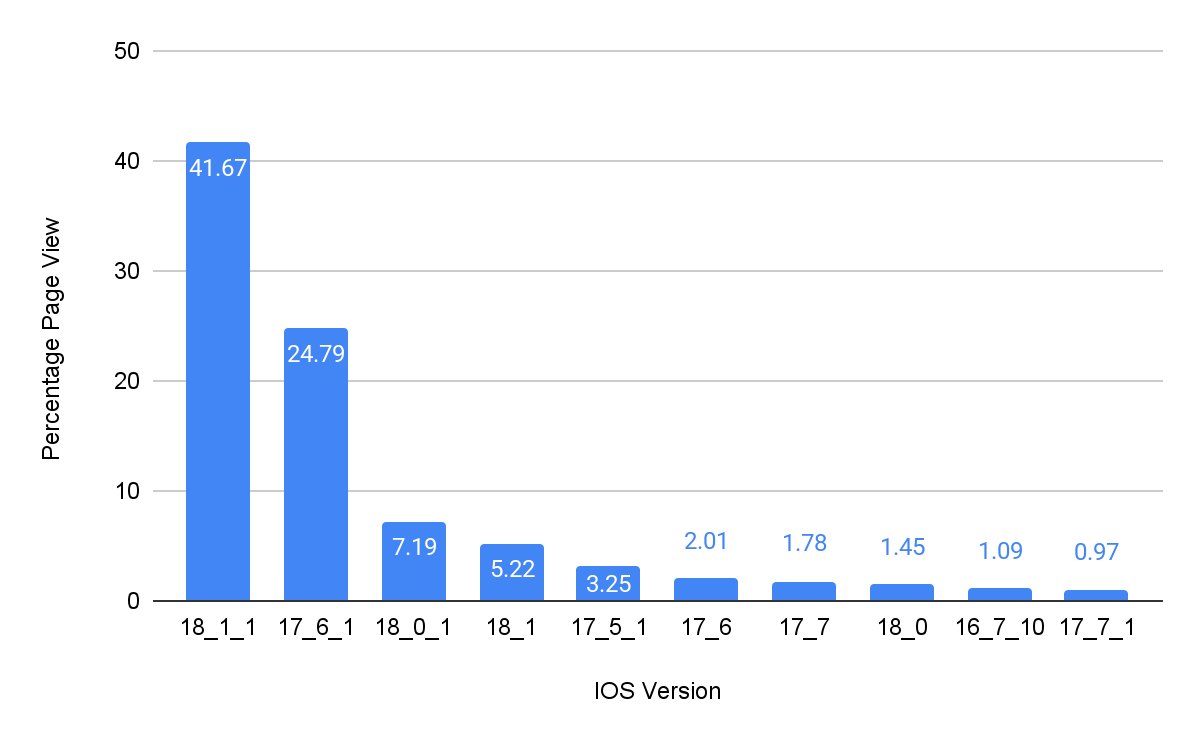
Data of iOS versions during the BFCM 2024
Here’s a look at iOS version data, showing how customers using Bazaarvoice clients check out Ratings & Reviews and other related stuff from us.
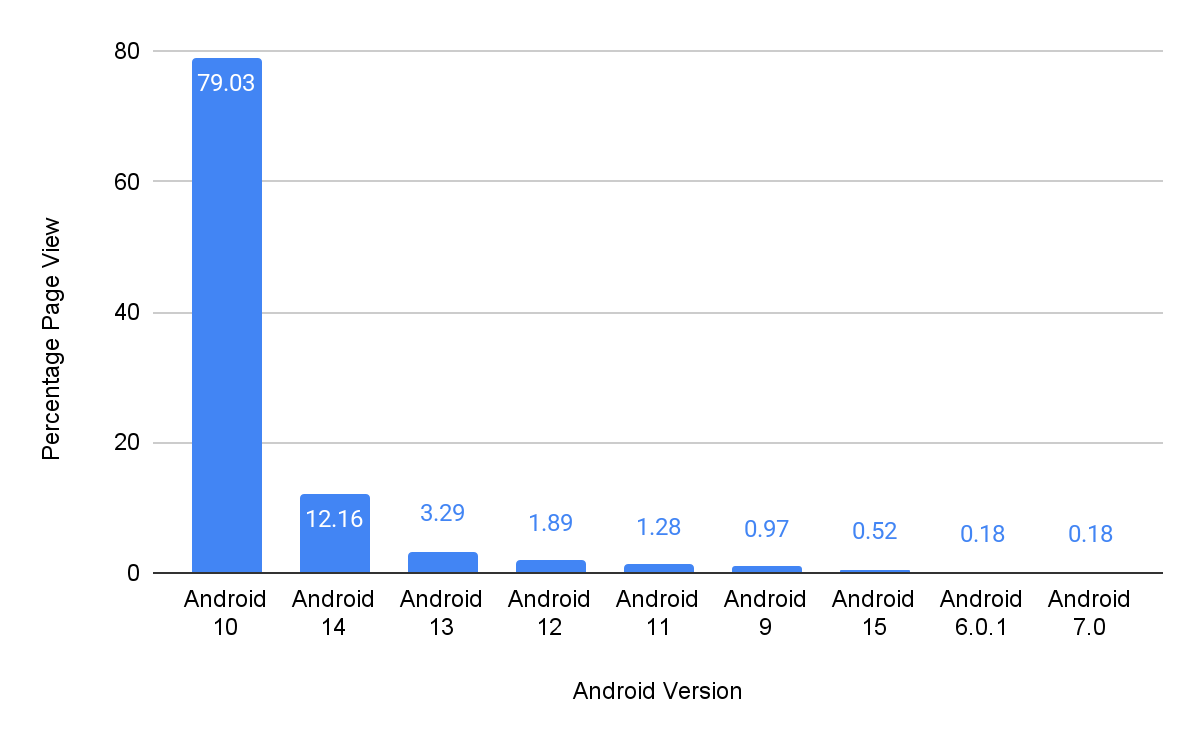
Data of Android versions during the BFCM 2024
This data details Android OS versions used by customers accessing Bazaarvoice Ratings & Reviews, and other related content.
The Bazaarvoice Baseline: A Long-Tail Approach
Given this data-driven reality, Bazaarvoice is officially adopting a new, more comprehensive baseline for measuring and publishing Core Web Vitals (CWV) performance for our Hosted Display component. This strategic shift is driven by a deep understanding of user behavior and the diverse range of devices used to access our clients’ sites. Our new standard will be meticulously based on the oldest high-traffic device, which robustly represents the “long-tail” of your customer base—those users who might not have the latest flagship smartphones or the most powerful internet connections.
By setting this critical benchmark on a device like the iPhone X or an Android 10 phone, we achieve several key objectives. Firstly, we ensure that our performance optimizations are robust enough to provide a truly great and consistent experience for a significant and often underserved portion of your users. This approach directly addresses the real-world conditions many customers face, preventing a fragmented experience where only those with top-tier devices enjoy optimal performance. Secondly, and critically, this also means that all newer, more powerful devices will naturally exceed this rigorous benchmark, delivering an even faster, smoother, and more delightful experience to the vast majority of your audience. This tiered benefit ensures that while we elevate the experience for all, the most powerful devices continue to perform at their peak.
This strategy allows us to provide a transparent, objective, and highly actionable measure of performance that directly correlates with the actual user experience your customers are having, rather than a theoretical or idealized one based solely on cutting-edge hardware. It moves beyond abstract metrics to focus on tangible improvements that impact real people. By focusing on the foundational experience for the “long-tail,” we establish a rising tide that lifts all boats, guaranteeing a superior and more equitable browsing experience across the entire spectrum of your audience. This commitment to real-world performance underscores Bazaarvoice’s dedication to optimizing the user journey for every customer, irrespective of their device’s age or capabilities.
CWV metrics with new Baseline devices
Below are the CWV metrics for the Hosted Display application version as on Aug 13, 2025 and tested with different devices using the LTE network for the devices.
It includes the following fields:
Mobile Device: Specifies the type of mobile device used for testing (e.g., Google Pixel, iPhone X).
CWV Metrics: Indicates the specific Core Web Vital metric being measured (e.g., LCP – Largest Contentful Paint, INP – Interaction to Next Paint, CLS – Cumulative Layout Shift, TBT – Total Blocking Time).
First View (in seconds): Shows the performance metric for the initial page load.
Repeat View (in seconds): Shows the performance metric for subsequent page loads.
The table’s purpose is to demonstrate the performance of the Hosted Display application on different devices under specific network conditions, providing data for a new benchmarking strategy based on real-world traffic
Mobile Device
CWV Metrics
First View (in seconds)
Repeat View (in seconds)
Google Pixel (Low end device by BV traffic)
LCP
2.5
1.7
INP
NA
NA
CLS
0
0
TBT
0.131
00.113
Google Pixel 4XL (High end device by BV traffic)
LCP
1.6
00.9
INP
NA
NA
CLS
0
0
TBT
0.016
0
iPhone X (Low end device by BV traffic)
LCP
1.29
0.69
INP
NA
NA
CLS
0.006
0.006
TBT
0
0
iPhone 15 (High end device by BV traffic)
LCP
1.31
0.66
INP
NA
NA
CLS
0.006
0.006
TBT
0
0
Taking Control of Your E-commerce Performance
The era of a single, universal device benchmark is over. The global market has shifted, and so should your performance strategy. Research from sources like IDC and Opensignal confirm that users are upgrading to more powerful devices with access to faster networks at a rapid pace [6, 7].
Your performance optimization efforts should be an investment in the experience of your actual customers, not an abstract user from years past. By using your own traffic data to create a custom benchmarking strategy, you can ensure that every millisecond of optimization translates into a better user experience, higher engagement, and a more robust ROI for your business.
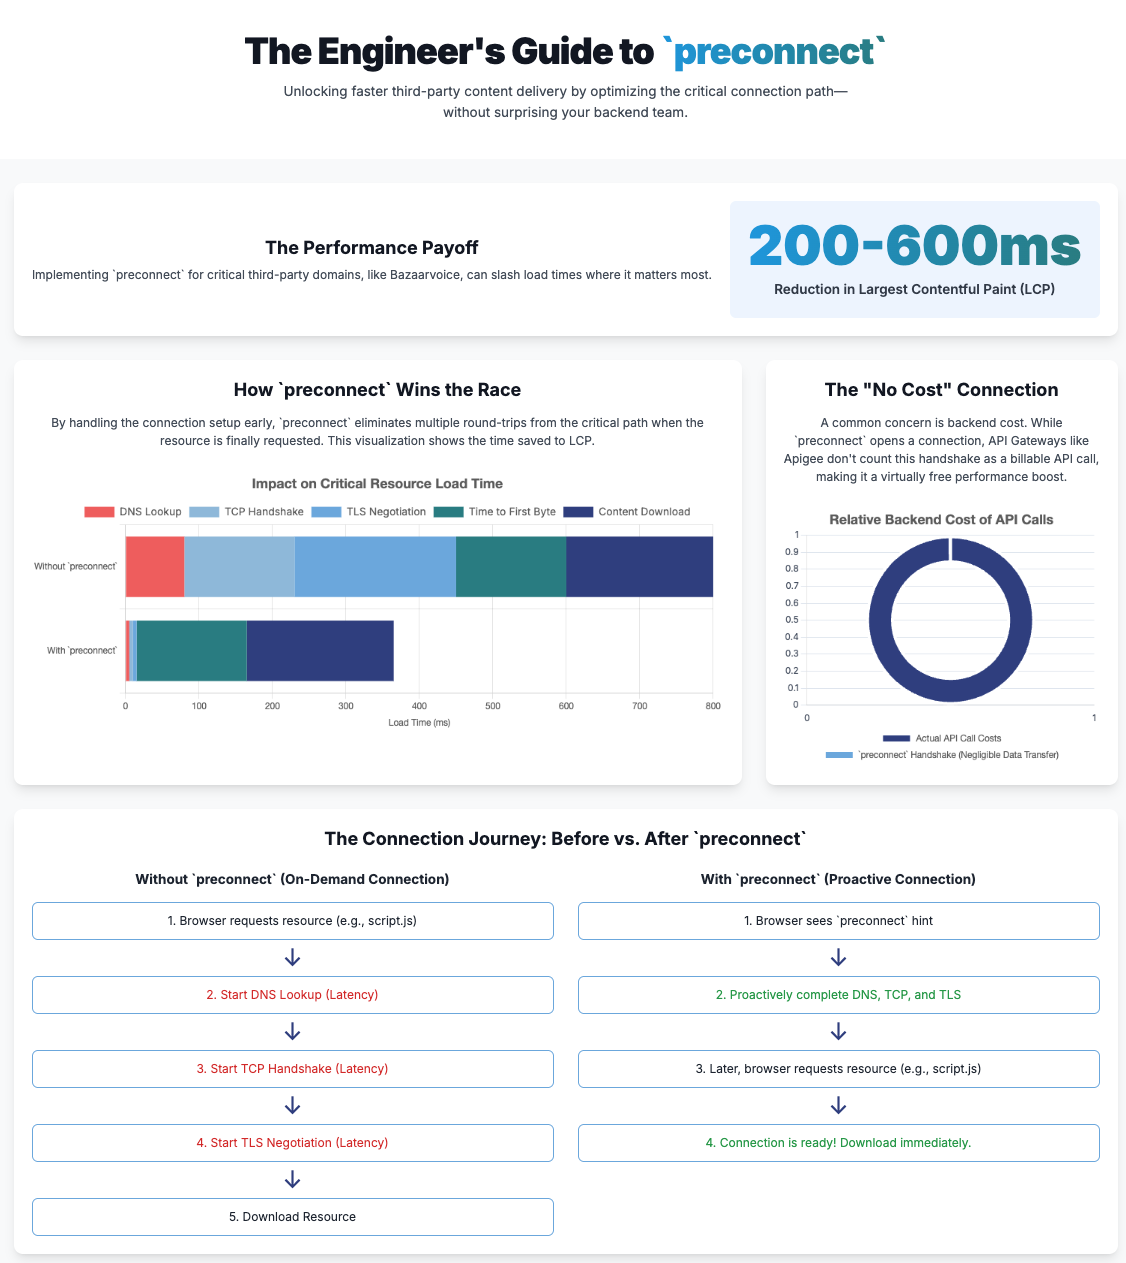
As software engineers, we’re constantly striving to deliver the fastest, most seamless web experiences possible. In today’s interconnected digital landscape, that often means integrating a variety of third-party content – from analytics and ads to rich user-generated content like ratings and reviews. While these integrations are essential, they introduce a common performance challenge: network latency. Every time your browser needs to fetch something from a new domain, it incurs a series of network round-trips for DNS resolution, TCP handshake, and, for secure connections, TLS negotiation.1 These cumulative delays can significantly impact your page’s load time and, critically, your users’ perception of speed.
This is where resource hints become invaluable. These simple HTML <link> elements act as early signals to the browser, proactively informing it about resources that are likely to be needed soon.3 By leveraging these hints, we can instruct the browser to perform speculative network operations in the background, effectively masking latency and improving perceived performance.
For a company like Bazaarvoice, which delivers embedded ratings and reviews across a vast network of retail and brand websites, performance isn’t just an optimization; it’s a core business driver. Our content is a critical touchpoint for user engagement on product pages. The primary performance bottleneck for a website integrating Bazaarvoice content isn’t typically the payload size, but the overhead of initiating communication with our servers.This initial connection setup is crucial for optimizing Largest Contentful Paint (LCP), a key metric within Core Web Vitals, which measures page loading performance and influences user perception of speed. Preconnect is precisely designed to address this, allowing the browser to establish connections preemptively so our content loads and renders significantly faster, directly boosting the host site’s performance.4
This article explores Bazaarvoice’s strategy for optimizing third-party content delivery. It demonstrates how preconnect can significantly enhance frontend performance while incurring minimal to no additional call costs, addressing often-ignored backend implications.
Resource Hints: Your Browser’s Proactive Network Assistant
Understanding the nuances of various resource hints is crucial for their effective application. Each hint serves a distinct purpose, operating at different stages of the network request lifecycle and offering varying levels of performance gain versus resource overhead.
dns-prefetch: A subtle hint, this directive tells the browser to resolve a domain’s DNS before requesting resources 6. Useful for future cross-origin access, it’s a low-overhead optimization that primarily reduces DNS lookup latency.
preconnect: This hint goes a step further than dns-prefetch. It instructs the browser to proactively establish a full connection—encompassing DNS resolution, TCP handshake, and for HTTPS, the TLS negotiation—to a critical third-party origin.3 This pre-establishment significantly reduces the cumulative round-trip latency that would otherwise occur when the actual resource is requested.
The Full Network Handshake:
DNS Lookup: Resolves the domain name to its IP address.1
TCP Handshake: The three-way handshake (SYN, SYN-ACK, ACK) to set up a reliable connection.
TLS Negotiation: For HTTPS, the complex exchange of cryptographic keys and certificates to establish an encrypted channel.1
crossorigin Attribute: For resources loaded in anonymous mode (e.g., web fonts) or those requiring Cross-Origin Resource Sharing (CORS), the crossorigin attribute must be set on the <link rel="preconnect"> tag. Without it, the browser might only perform the DNS lookup, negating the TCP and TLS benefits.6
Important Distinction: It’s crucial to distinguish rel="preconnect" (a browser directive to pre-establish a connection for future HTTP/HTTPS requests) from the HTTP CONNECT method. The HTTP CONNECT method is used for creating TCP tunnels through proxies (e.g., for secure communication over HTTP proxies or VPN-like scenarios). While both involve connection setup, their purposes and mechanisms are distinct.
preload: A high-priority instruction for the browser to fetch and cache resources (like scripts or styles) essential for the current page’s rendering, even if discovered late.9 It initiates an early fetch, unlike preconnect which only establishes a connection. Requires the as attribute for resource type10.
prefetch: This browser hint suggests that a resource may be required for future navigations or interactions.1 It’s a speculative fetch designed to accelerate subsequent user journeys (e.g., prefetching the next page in a multi-step form). Resources are fetched and stored in the browser’s cache, ideally during idle periods when network resources are not under contention.14
prerender: The most aggressive resource hint. It instructs the browser to not only fetch but also execute an entire page in the background.1 If the user then navigates to that page, it can appear almost instantaneously. Due to its high resource consumption (bandwidth, CPU, memory), it’s often deprecated or used with extreme caution.1
Here’s a quick comparison of these hints:
Hint Type
Purpose
Network Stages Covered
Overhead/Risk
Optimal Use Case
dns-prefetch
Resolve domain names early
DNS
Minimal
Many cross-origin domains, non-critical
preconnect
Establish full connection early
DNS, TCP, TLS
Client CPU, minor bandwidth for TLS certs
Critical cross-origin domains (1-3)
preload
Fetch critical resource for current page
DNS, TCP, TLS, Data Fetch
Can disrupt browser priorities if misused
Critical resources needed early in render
prefetch
Speculatively fetch resource for future navigation
DNS, TCP, TLS, Data Fetch
Bandwidth waste if unused, skewed analytics
Resources for likely next page/interaction
Comparison for Resource hints
The Preconnect Advantage: Accelerating Third-Party Content Delivery
Preconnect directly tackles the significant latency introduced by the multi-stage network handshake. By completing DNS resolution, TCP handshake, and TLS negotiation preemptively, it effectively removes several critical round-trips from the critical rendering path when the actual resource is eventually requested.2 This pre-optimization can lead to measurable and substantial improvements in key performance metrics, including Largest Contentful Paint (LCP).10 This is particularly impactful if the third-party content, such as Bazaarvoice review widgets or critical scripts, is a significant component of the LCP element or is essential for the initial visual completeness of the page.
For Bazaarvoice, which serves Ratings and Reviews on product detail and listing pages across various websites, preconnect is a perfect solution. Our Display service retrieves content (static and dynamic) from apps.bazaarvoice.com, which is always a third-party domain to the client website. While our Display component is designed for lazy loading, the initial DNS lookup and TCP/SSL connection still consume valuable time, especially on mobile 3G networks.
By adding a preconnect hint for apps.bazaarvoice.com, the browser can proactively prepare the DNS lookup and SSL socket after the necessary TLS handshake. This means that by the time our Display component initiates its call to the backend, the underlying network connection is already “warm” and ready. This approach has demonstrably reduced the Largest Contentful Paint (LCP) value by 200-600ms, with the exact improvement varying by network capacity. This directly improves the Core Web Vitals metrics (LCP) for our Display component, making the reviews appear much faster for end-users.
Backend Implications: The (No) Count and (Low) Cost of preconnect
This is where we address the critical, often overlooked, aspect of preconnect: its influence on backend infrastructure and associated costs. While preconnect is a frontend hint, its strategic implementation requires understanding its server-side footprint.
When a browser honors a preconnect hint, it opens a TCP socket and initiates TLS negotiation. A key concern is what happens if this preconnected origin isn’t actually utilized within a reasonable timeframe. For instance, Chrome will automatically close an idle preconnected connection if it remains unused for approximately 10 seconds.14 In such cases, the resources expended on establishing that connection—including client-side CPU cycles and the minimal network bandwidth consumed by the handshake packets (around 3KB per connection for TLS certificates 14)—are effectively wasted. Preconnecting to too many origins can accumulate unnecessary CPU load on the user’s device and potentially compete with more critical assets for bandwidth.
From a backend perspective, every incoming connection, even just for a handshake (DNS, TCP, TLS), consumes some server-side resources: CPU cycles for TLS termination, memory to maintain connection context, and network capacity to handle handshake packets. While the resource consumption for an individual handshake is minuscule, the aggregate impact at scale can become considerable.
API Gateway and CDN Considerations: Pricing Models and Our Findings
The impact of preconnect on API Gateway and CDN costs requires a nuanced understanding of their billing models.
API Gateways (e.g., AWS API Gateway, Google Apigee): These services primarily charge based on the number of “requests” processed (e.g., per million API calls).15 A preconnect operation itself does not constitute a “request” in the billing sense, as it’s a network handshake intended to prepare for a future request, not an actual data or API call that hits a backend endpoint. Therefore, preconnect operations do not directly incur per-request charges on these models.
Bazaarvoice’s Own Testing: This is a crucial finding for us. We initiated preconnect calls from the browser and checked the usage metrics of APIGEE. Our analysis confirmed that these CONNECT calls were not counted or charged as API calls.17 This directly addresses the common concern about backend billing for preconnect operations.
Data Transfer Fees: The small amount of data exchanged during the TLS certificate negotiation (approx. 3KB) would count towards data transfer fees.14 While negligible per preconnect, it is a non-zero component at massive scale.
CDNs (Content Delivery Networks): CDNs typically base their pricing on data transfer volume and the number of requests served. preconnect itself does not involve the transfer of content, so it does not directly incur content delivery costs. Similar to API Gateways, the TLS handshake data would contribute minimally to CDN metrics. The primary benefit of preconnect for CDN-served assets is the acceleration of content delivery after the connection is established.
The Bottom Line on Cost:preconnect operations incur minimal direct financial cost in terms of “requests” on typical API Gateway or CDN billing models, as they primarily involve connection setup rather than full data requests. They do consume a small amount of bandwidth for TLS certificates and some server-side CPU/memory for managing the connection. The most significant “cost” associated with preconnect is the potential for wasted client and server resources if the established connection is ultimately unused.
Strategic Implementation: Bazaarvoice’s Approach and Your Takeaways
Effective preconnect implementation demands a strategic approach. It involves careful identification of critical origins and balancing performance gains with backend efficiency.
For Bazaarvoice, the strategy was clear: target the domains serving our core content. This primarily means apps.bazaarvoice.com, which delivers our Display service. Since this domain is always a third-party origin for our clients, it’s a prime candidate for preconnect.
Our Display component is designed to lazy-load, but the initial DNS lookup and TCP/SSL connection still consume significant time. By adding a preconnect hint for apps.bazaarvoice.com, client browsers can proactively perform the DNS lookup and establish the SSL socket, including the necessary TLS handshake, before the Display component even starts requesting data.
The Results: Our implementation of preconnect for *.bazaarvoice.com has demonstrably reduced the Largest Contentful Paint (LCP) value, depending on network capacity. This directly improved the Core Web Vitals metrics for our Display component.
Crucially, our internal testing with APIGEE confirmed that these preconnect calls were not counted or charged as API calls. This validates the “no count, low cost” aspect for backend services, proving that you can achieve significant frontend performance gains without unexpectedly inflating your API Gateway bill.
Your Actionable Takeaways:
Identify Critical Origins: Don’t preconnect everything. Focus on the 1-3 most critical cross-origin domains that are essential for your page’s initial render or LCP. Over-preconnecting can be counterproductive.4
Use crossorigin: If your preconnected resource uses CORS or is loaded anonymously (like fonts), always include the crossorigin attribute.6
Connect Promptly: Ensure actual resource calls occur within 10 seconds of preconnect. Connections idle for longer than this timeframe will be lost, requiring a new TCP handshake, though DNS resolution will remain cached based on its TTL.
Monitor and Iterate: Performance optimization is an ongoing process. Use tools like Lighthouse, WebPageTest, and Real User Monitoring (RUM) to track frontend metrics. Simultaneously, keep an eye on your backend: active connection counts, CPU utilization, and API Gateway logs. This holistic view helps ensure frontend optimizations don’t create new backend bottlenecks or unexpected costs.
Test for Cost: If you’re concerned about API Gateway or CDN costs, do your own small-scale tests, just like we did with APIGEE. Verify how preconnect operations are logged and billed by your specific providers.
Infographics
Conclusion
Preconnect is a powerful, yet nuanced, tool in the web performance toolkit. Its primary strength lies in its ability to significantly improve the perceived performance of web pages by proactively accelerating the loading of critical cross-origin resources. By completing DNS resolution, TCP handshake, and TLS negotiation preemptively, it ensures that when the actual resource is needed, the connection is already warm and ready, reducing critical path delays.
It is crucial that the actual resource calls occur within 10 seconds of the preconnect being established. Exceeding this timeframe will result in the loss of the socket and necessitate another TCP handshake. Nevertheless, the DNS lookup time will be reduced due to DNS resolution, which is governed by the DNS TTL.
While preconnect itself does not directly incur significant monetary costs in terms of “requests” on typical backend API Gateway billing models (as Bazaarvoice’s APIGEE testing confirmed), it’s not entirely “cost-free.” It consumes client-side CPU resources, minor network bandwidth, and requires server-side resources for connection management. Overuse or misapplication can lead to wasted resources.
Strategic implementation is paramount. By identifying critical origins and diligently monitoring both frontend performance and backend resource consumption, you can leverage preconnect to deliver faster, more responsive web experiences to your users, without incurring unexpected backend costs. It’s about smart, targeted optimization that benefits everyone.
Discover how Bazaarvoice migrated millions of UGC records from RDS MySQL to AWS Aurora – at scale and with minimal user impact. Learn about the technical challenges, strategies, and outcomes that enabled this ambitious transformation in reliability, performance, and cost efficiency
Bazaarvoice ingests and serves millions of user-generated content (UGC) items—reviews, ratings, questions, answers, and feedback—alongside rich product catalog data for thousands of enterprise customers. This data powers purchasing decisions for consumers and delivers actionable insights to clients. As e‑commerce volume and catalog breadth grew, our core transactional datastore on Amazon RDS for MySQL approached operational limits. Performance bottlenecks and scale risks were not acceptable for downstream systems or client-facing SLAs.
This post describes why we moved, what we ran before, the constraints we hit, and how a two‑phase modernization—first standardizing on MySQL 8.0, then migrating to Amazon Aurora MySQL—unlocked scale, resiliency, and operational efficiency.
Technical drivers for migration
Our decision was driven by clear, repeatable pain points across regions and clusters:
Elasticity and cost efficiency: RDS tightly couples compute and storage; scaling IOPS forced larger instances even when CPU/RAM headroom was unnecessary, leading to overprovisioning and costly peak-capacity sizing.
Read scalability and freshness: Minutes of replica lag during heavy write bursts degraded downstream experiences and analytics.
Operational agility: Routine maintenance (major/minor upgrades, index/build operations) required long windows and coordination, increasing risk and toil.
Availability and recovery: We needed stronger RTO (Recovery Time Objective)/RPO (Recovery Point Objective) posture across AZs (Availability Zones)/regions with simpler failover.
Currency and security: MySQL 5.7 end of life increased support cost and security exposure.
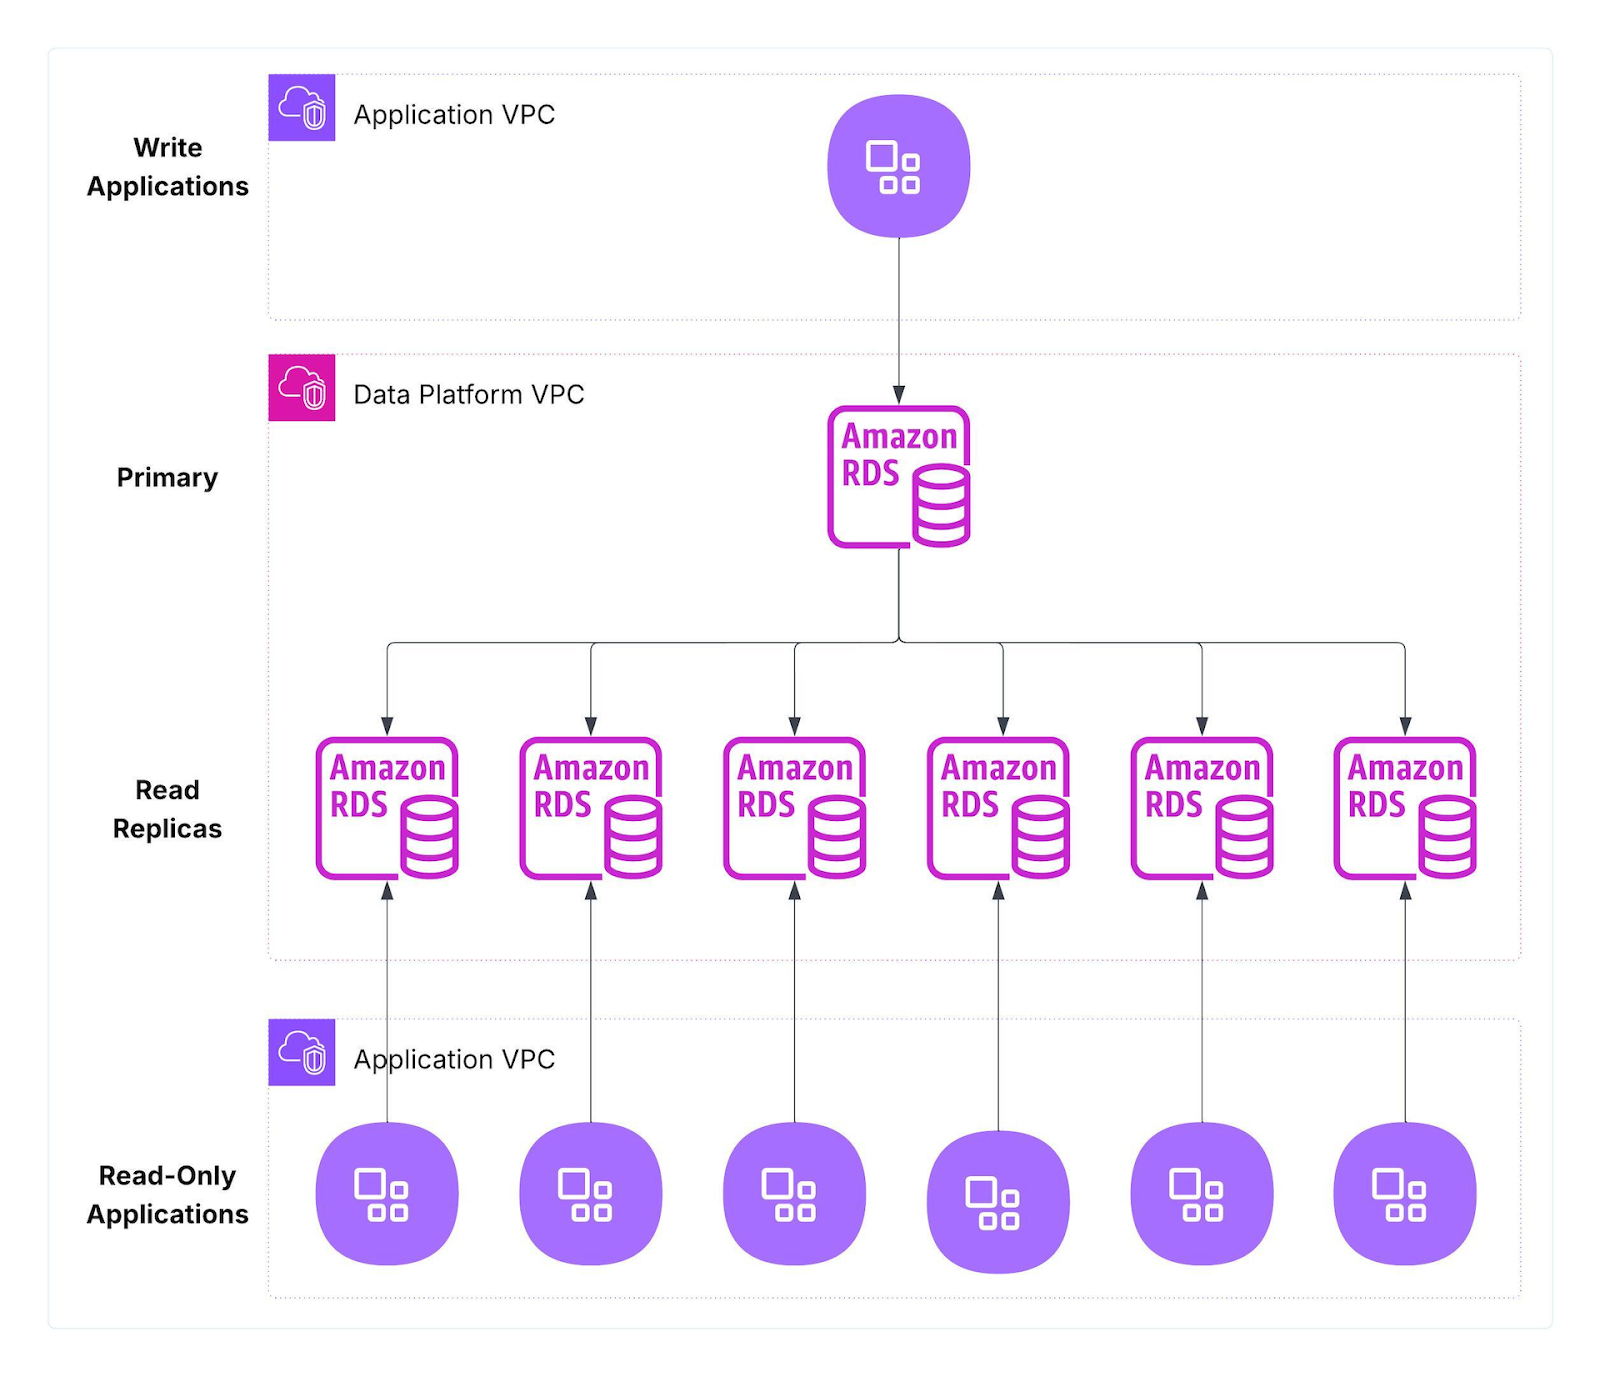
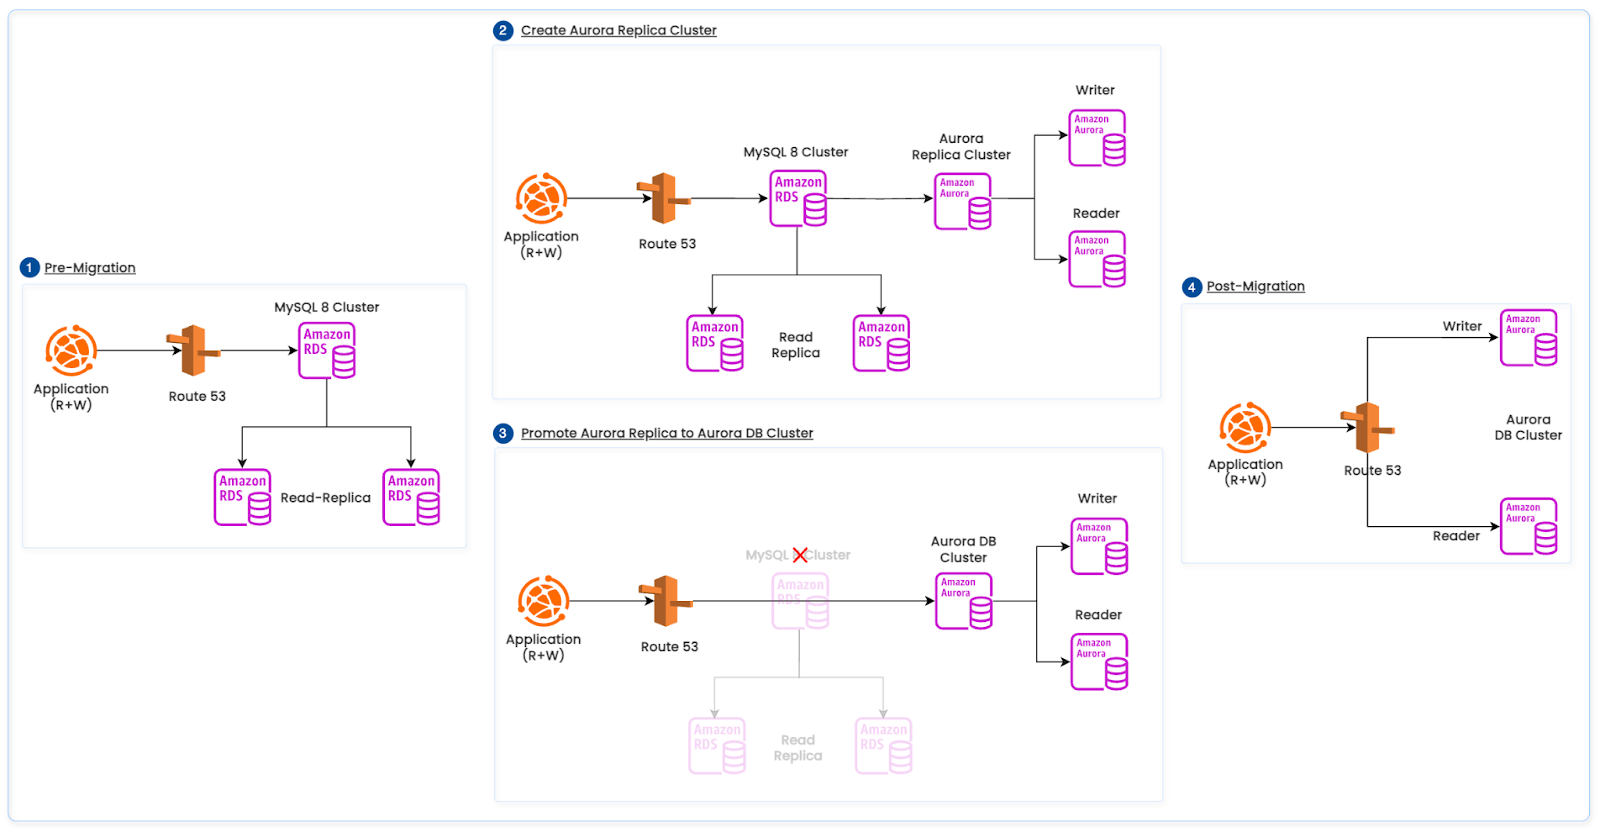
Current architecture (before)
This design served us well, but growth revealed fundamental constraints.
Our PRR (Product Reviews & Ratings) platform ran a large fleet of Amazon RDS for MySQL clusters deployed in the US and EU for latency and data residency. Each cluster had a single primary (writes) and multiple read replicas (reads), with application tiers pinned to predefined replicas to avoid read contention.
Figure 1: Previous RDS-based architecture
Observed Constraints and impact
Elasticity and cost: To gain IOPS we upsized instances despite CPU/RAM headroom, leading to 30–50% idle capacity off‑peak; resizing required restarts (10–30 min impact).
Read scalability and freshness: Under write bursts, replica lag p95 reached 5–20 minutes; read‑after‑write success fell below 99.5% at peak; downstream analytics SLAs missed.
Operational agility: Multi‑TB index/DDL work consumed 2–6 hours/change; quarterly maintenance totaled 8–12 hours/cluster; change failure rate elevated during long windows.
Availability and recovery: Manual failovers ran 3–10 minutes (RTO); potential data loss up to ~60s (RPO) during incidents; cross‑AZ runbooks were complex.
Large‑table contention: Long scans increased lock waits and p95 query latency by 20–40% during peaks.
Platform currency: MySQL 5.7 EOL increased support, security exposure and extended support costs.
Our modernization plan
We executed a two‑phase approach to de‑risk change and accelerate value:
Upgrade all clusters to MySQL 8.0 to eliminate EOL risk, unlock optimizer and engine improvements, and standardize client compatibility.
Migrate to Amazon Aurora MySQL to decouple compute from storage, minimize replica lag, simplify failover, and reduce operational overhead.
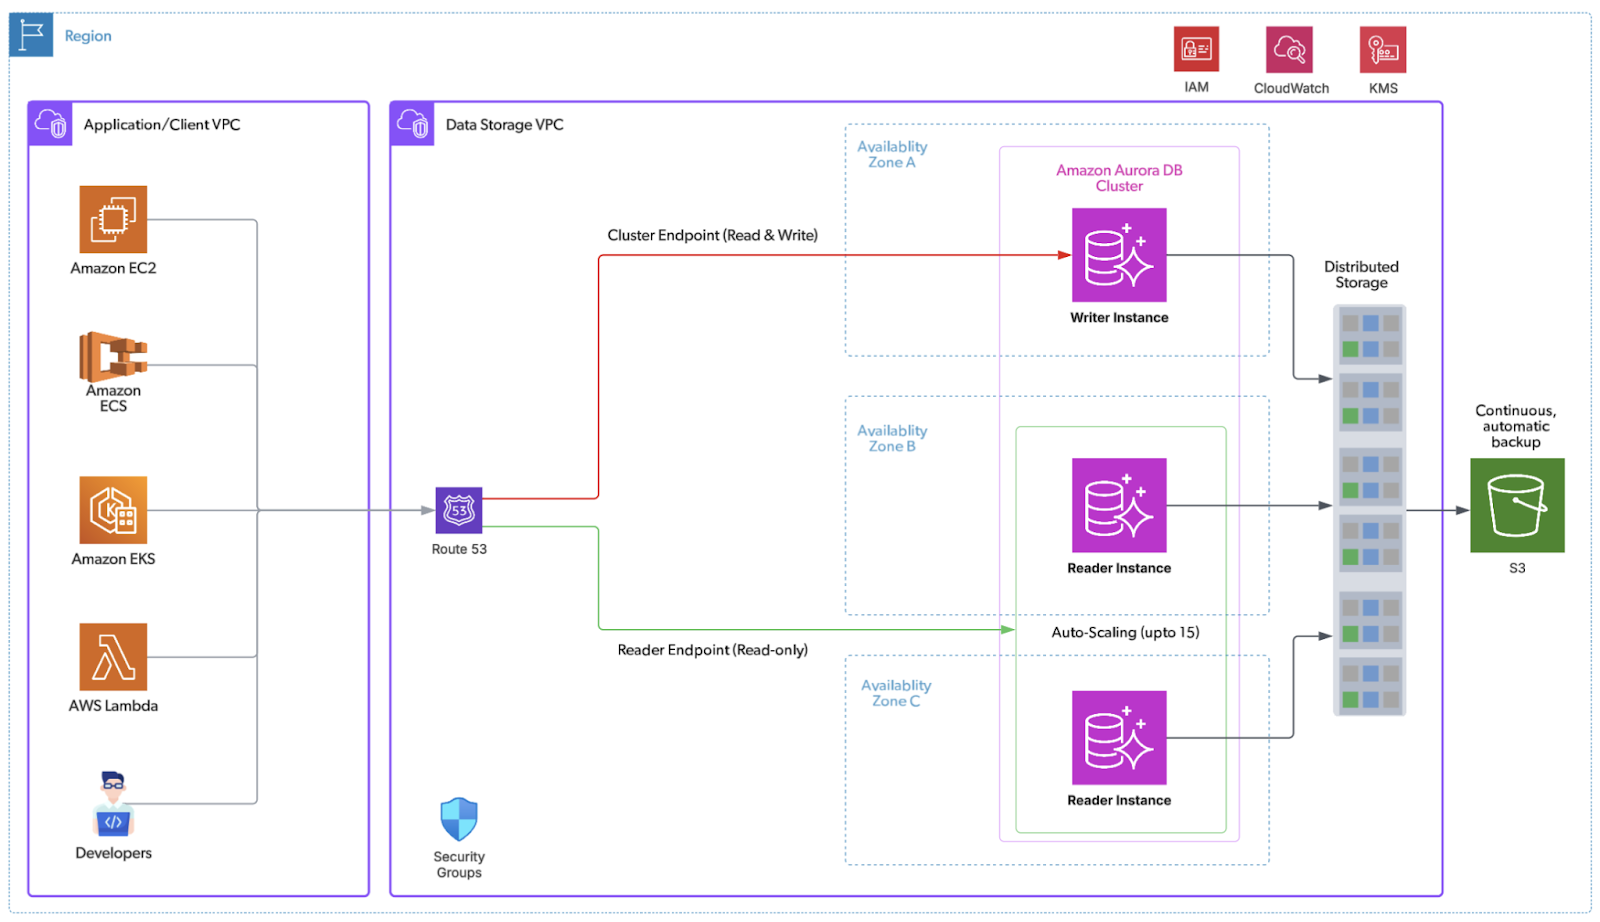
The below diagram illustrates our target Aurora Architecture.
Figure 2: Target Aurora-based architecture
Phase 1: Upgrading From MySQL 5.7 to MySQL 8.0 (blue‑green)
Objective: Achieve currency and immediate performance/operability wins with minimal downtime.
Approach
Stood up a parallel “green” MySQL 8.0 environment alongside the existing 5.7 “blue”.
Ran compatibility, integration, and performance tests against green; validated drivers and connection pools.
Orchestrated cutover: freeze writes on blue, switch application endpoints to green, closely monitor, then decommission.
Rollback strategy: No supported downgrade from 8.0 to 5.7; keep blue (5.7) intact and time‑box a 4‑hour rollback window during low traffic; on SLO regression set green read‑only, switch endpoints back to blue, re‑enable writes, and reconcile by replaying delta transactions from the upstream cache.
Key considerations and fixes
SQL and deprecated features: Refactored incompatible queries and stored routines; reviewed optimizer hints.
Character set: Validated/standardized on utf8mb4; audited column/ index lengths accordingly.
Authentication: Planned client updates for 8.0’s default caching_sha2_password vs mysql_native_password.
Auto‑increment lock mode: Verified innodb_autoinc_lock_mode defaults and replication mode to avoid duplicate key hazards.
Regular expression guards: Tuned regexp_time_limit / regexp_stack_limit where long‑running regex filters were valid.
Buffer pool warm state: Tuned innodb_buffer_pool_load_at_startup to preload hot pages on startup for faster warmup; paired with innodb_buffer_pool_dump_at_shutdown to persist cache at shutdown.
Reduced future migration risk by standardizing engines and drivers ahead of Aurora Migration.
The below diagram illustrates the above RDS MySQL upgradation path.
Figure 3: MySQL 5.7 to MySQL 8.0 Upgradation Path
Phase 2: Migrating to Aurora MySQL (minimal downtime)
Why Amazon Aurora MySQL
Aurora’s cloud-native architecture directly addresses the core constraints—scalability, cost and operational inefficiencies, and replication/high availability—outlined in the Technical Drivers for Migration section.
Decoupled compute and storage: Writer and readers share a distributed, log‑structured storage layer that auto‑scales in 10‑GB segments, with six copies across three AZs.
Near‑zero replica lag: Readers consume the same storage stream; typical lag is single‑digit milliseconds.
Fast, predictable failover: Reader promotion is automated; failovers complete in seconds with near‑zero data loss (strong RPO/RTO posture). For further reading Aurora DB Cluster – High Availability
Right‑sized elasticity: Independently scale read capacity; add/remove readers in minutes without storage moves.
Operational simplicity: Continuous backups to S3, point‑in‑time restore, fast database cloning (copy‑on‑write) for testing/ops.
Advanced capabilities: Parallel Query for large scans, Global Database for cross‑region DR, and optional Serverless v2 for spiky workloads.
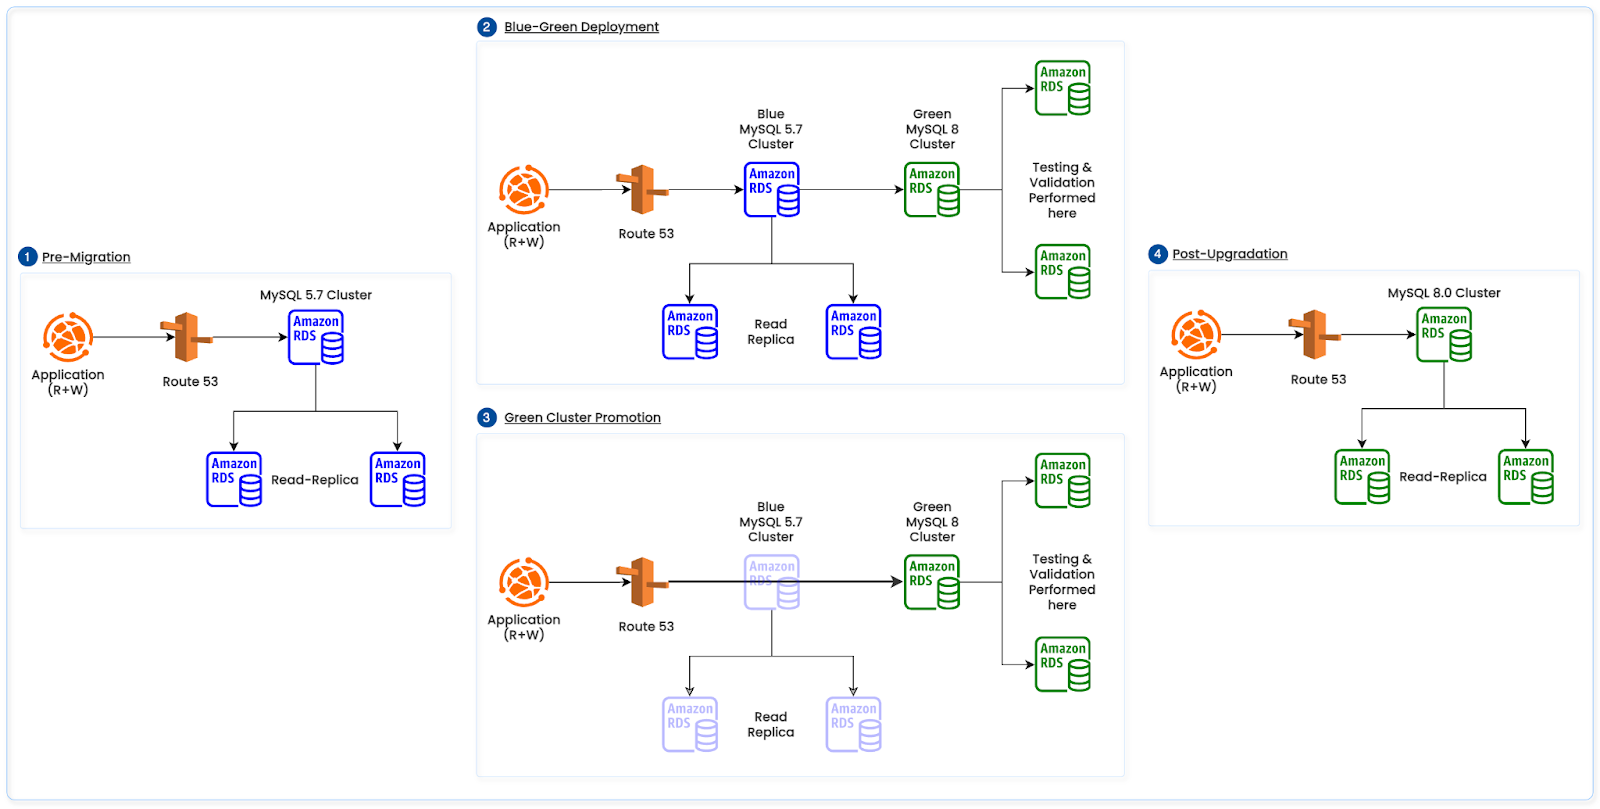
Migration Strategy
Our goal is a low-downtime move from RDS MySQL to Aurora MySQL and keeping a fast rollback path.
Minimize write downtime and application risk.
Maintain an immediate rollback option.
Migration Path
Source RDS (STATEMENT): Maintain the primary on STATEMENT binlog_format to satisfy existing downstream ETL requirements.
This emits row-based events required for Aurora Replica Cluster replication changing the primary.
Validation and query replay (pre-cutover)
Parity checks: Continuous row counts/checksums on critical tables; spot data sampling.
Shadow reads: Route a portion of read traffic to the Aurora reader endpoint; compare results/latency.
Query replay: Capture representative workload (from binlogs/proxy mirror) and replay against Aurora to validate execution plans, lock behavior, and performance.
Real-time replication monitoring: Continuously track replication lag, error rates, and binlog position between RDS and Aurora to ensure data consistency and timely sync before cutover.
Traffic shift and promotion
Phase 1 — Shift reads: Gradually route read traffic to the Aurora reader endpoint; monitor replica lag, p95/p99 latency, lock waits, and error rates.
Phase 2 — Promote: Promote the Aurora replica cluster to a standalone Aurora DB cluster (stop external replication).
Phase 3 — Shift writes: Redirect application writes to the Aurora writer endpoint; keep reads on Aurora readers.
Operational safeguards
Coordination: Quiesce non‑critical writers and drain long transactions before promotion.
DNS endpoint management: Before migration, set the DNS TTL to 5 seconds to enable rapid propagation. Update the existing DNS CNAME to point to Aurora cluster endpoints during cutover, then revert as needed for rollback.
Config hygiene: Update connection strings/secrets atomically; ensure pools recycle to pick up new endpoints.
Monitoring: Watch replica lag, query latency, deadlocks, and parity checks throughout and immediately after cutover.
Rollback: If SLOs degrade or parity fails, redirect writes back to RDS; the standby rollback replica can be promoted quickly for clean fallback.
Runbooks: Every migration step was governed by clear-cut runbooks, practiced and tested in advance using a parallel setup to ensure reliability and repeatability.
The below diagram illustrates the above RDS MySQL to Aurora MySQL migration path.
Figure 4: RDS MySQL to Aurora MySQL Migration Path
Results and what improved
Data freshness: Replica lag = 0s; read-after-write ≥ 99.9%; analytics staleness p95 ≤ 5 min.
Scalability: Read scaling efficiency ≥ 0.8; writer CPU ≤ 70%.
Operability: PITR restore ≤ 15 min; fast clone ≤ 60s; maintenance time −50% vs. baseline.
Cost alignment: No storage over provisioning – Replicas reduced from 7 to 1, yielding ~40% total cost reduction.
What Made Our Aurora Migration Unique to Bazaarvoice
While Aurora’s scalability and reliability are well known, our implementation required engineering solutions tailored to Bazaarvoice’s scale, dependencies, and workloads:
Foundational discovery: Three months of in-depth system analysis to map every dependency — the first such effort for this platform — ensuring a migration with zero blind spots.
Large-scale dataset migration: Handled individual tables measured in terabytes, requiring specialized sequencing, performance tuning, and failover planning to maintain SLAs.
Replica optimization: Reduced the read replica footprint through query pattern analysis and caching strategy changes, delivering over 50% cost savings without performance loss.
Beyond defaults: Tuned Aurora parameters such as auto_increment_lock_mode and InnoDB settings to better match our workload rather than relying on out-of-the-box configurations.
Replication format constraint: Our source ran statement-based replication with ETL triggers on read replicas, which meant we couldn’t create an Aurora reader cluster directly. We engineered a migration path that preserved ETL continuity while moving to Aurora.
Custom workload replay tooling: Developed scripts to filter RDS-specific SQL from production query logs before replaying in Aurora, enabling accurate compatibility and performance testing ahead of staging.
Environment-specific tuning: Applied different parameter groups and optimization strategies for QA, staging, and production to align with their distinct workloads.
These deliberate engineering decisions transformed a standard Aurora migration into a BV-optimized, cost-efficient, and risk-mitigated modernization effort.
Learnings and takeaways
Standardize early to remove surprises: Commit to utf8mb4 (with index length audits), modern auth (caching_sha2_password), and consistent client libraries/connection settings across services. This eliminated late rework and made test results portable across teams.
Build safety into rollout, not after: Shadow reads and row‑level checksums caught drift before cutover; plan diffs and feature flags kept risk bounded. Go/no‑go gates were tied to SLOs (p95 latency, error rate), not gut feel, and a rehearsed rollback made the decision reversible.
Rollback is a design requirement: With no supported 8.0→5.7 downgrade, we ran blue‑green, time‑boxed a 4‑hour rollback window during low traffic, kept low DNS/ALB TTLs, and pre‑captured binlog coordinates. On regression: set green read‑only, flip endpoints to blue, re‑enable writes, then reconcile by replaying delta transactions from the upstream cache.
Backward replication helps but is brittle: Short‑lived 8.0‑primary→5.7‑replica mirroring de‑risked bake windows, yet required strict session variable alignment and deferring 8.0‑only features until validation completed.
Partition first, automate always: Domain partitioning lets us upgrade independently and reduce blast radius. Automation handled drift detection, endpoint flips, buffer pool warm/cold checks, and post‑cutover validation so humans focused on anomalies, not checklists.
Operability hygiene pays compounding dividends: Keep transactions short and idempotent; enforce parameter discipline; cap runaway regex (regexp_time_limit/regexp_stack_limit); validate autoinc lock mode for your replication pattern; and keep instances warm by pairing innodb_buffer_pool_dump_at_shutdown with innodb_buffer_pool_load_at_startup. Snapshots + PITR isolated heavy work, and regular failover drills made maintenance predictable.
Measurable outcome: Replica lag dropped to milliseconds; cutovers held downtime to minutes; read scale‑out maintained p95 latency within +10% at target QPS with writer CPU ≤ 70% and read scaling efficiency ≥ 0.8; replicas reduced from 7 to 1, driving ~40% cost savings.
Conclusion
The strategic migration from Amazon RDS to Amazon Aurora MySQL was a significant milestone. By upgrading to MySQL 8.0 and then migrating to Aurora, we successfully eliminated replication bottlenecks and moved the responsibility for durability to Aurora’s distributed storage. This resulted in tangible benefits for our platform and our customers, including:
Improved Data Freshness: Replica lag was reduced to milliseconds, significantly improving downstream analytics and client experiences.
Enhanced Scalability and Cost Efficiency: We can now right-size compute resources independently of storage, avoiding over-provisioning for storage and IOPS. Read capacity can also be scaled independently.
Higher Availability: The architecture provides faster failovers and stronger multi-AZ durability with six-way storage replication.
Simplified Operations: Maintenance windows are shorter, upgrades are easier, and features like fast clones allow for safer experimentation.
This new, resilient, and scalable platform gives us the freedom to move faster with confidence as we continue to serve billions of consumers and our customers worldwide.
Acknowledgements
This milestone was possible thanks to many people across Bazaarvoice — our Database engineers, DevOps/SRE, application teams, security and compliance partners, product, principal engineering community and leadership stakeholders. Thank you for the rigor, patience, and craftsmanship that made this transition safe and successful.
Large language models are fantastic tools for unstructured text, but what if your text doesn’t fit in the context window? Bazaarvoice faced exactly this challenge when building our AI Review Summaries feature: millions of user reviews simply won’t fit into the context window of even newer LLMs and, even if they did, it would be prohibitively expensive.
In this post, I share how Bazaarvoice tackled this problem by compressing the input text without loss of semantics. Specifically, we use a multi-pass hierarchical clustering approach that lets us explicitly adjust the level of detail we want to lose in exchange for compression, regardless of the embedding model chosen. The final technique made our Review Summaries feature financially feasible and set us up to continue to scale our business in the future.
The Problem
Bazaarvoice has been collecting user-generated product reviews for nearly 20 years so we have a lot of data. These product reviews are completely unstructured, varying in length and content. Large language models are excellent tools for unstructured text: they can handle unstructured data and identify relevant pieces of information amongst distractors.
LLMs have their limitations, however, and one such limitation is the context window: how many tokens (roughly the number of words) can be put into the network at once. State-of-the-art large language models, such as Athropic’s Claude version 3, have extremely large context windows of up to 200,000 tokens. This means you can fit small novels into them, but the internet is still a vast, every-growing collection of data, and our user-generated product reviews are no different.
We hit the context window limit while building our Review Summaries feature that summarizes all of the reviews of a specific product on our clients website. Over the past 20 years, however, many products have garnered thousands of reviews that quickly overloaded the LLM context window. In fact, we even have products with millions of reviews that would require immense re-engineering of LLMs to be able to process in one prompt.
Even if it was technically feasible, the costs would be quite prohibitive. All LLM providers charge based on the number of input and output tokens. As you approach the context window limits for each product, of which we have millions, we can quickly run up cloud hosting bills in excess of six figures.
Our Approach
To ship Review Summaries despite these technical, and financial, limitations, we focused on a rather simple insight into our data: Many reviews say the same thing. In fact, the whole idea of a summary relies on this: review summaries capture the recurring insights, themes, and sentiments of the reviewers. We realized that we can capitalize on this data duplication to reduce the amount of text we need to send to the LLM, saving us from hitting the context window limit and reducing the operating cost of our system.
To achieve this, we needed to identify segments of text that say the same thing. Such a task is easier said than done: often people use different words or phrases to express the same thing.
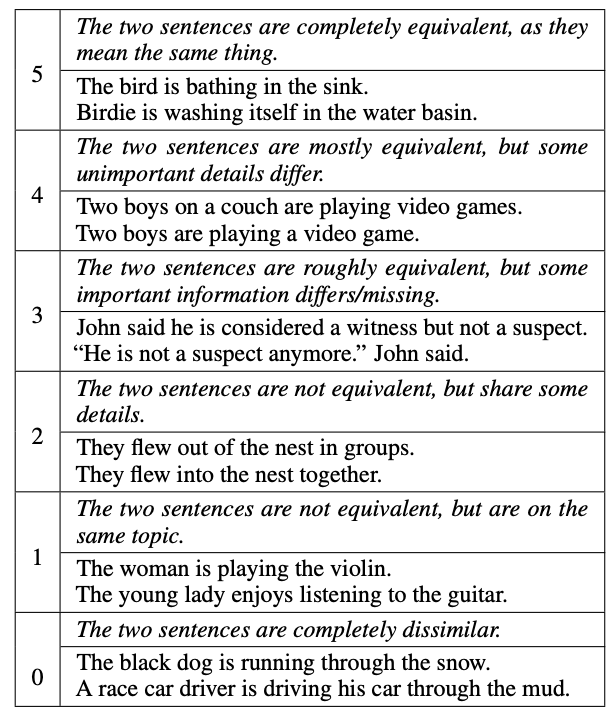
Fortunately, the task of identifying if text is semantically similar has been an active area of research in the natural language processing field. The work by Agirre et. al. 2013 (SEM 2013 shared task: Semantic Textual Similarity. In Second Joint Conference on Lexical and Computational Semantics) even published a human-labeled data of semantically similar sentences known as the STS Benchmark. In it, they ask humans to indicate if textual sentences are semantically similar or dissimilar on a scale of 1-5, as illustrated in the table below (table from Cer et. al., SemEval-2017 Task 1: Semantic Textual Similarity Multilingual and Crosslingual Focused Evaluation):
The STSBenchmark dataset is often used to evaluate how well a text embedding model can associate semantically similar sentences in its high-dimensional space. Specifically, Pearson’s correlation is used to measure how well the embedding model represents the human judgements.
Thus, we can use such an embedding model to identify semantically similar phrases from product reviews, and then remove repeated phrases before sending them to the LLM.
Our approach is as follows:
First, product reviews are segmented the into sentences.
An embedding vector is computed for each sentence using a network that performs well on the STS benchmark
Agglomerative clustering is used on all embedding vectors for each product.
An example sentence – the one closest to the cluster centroid – is retained from each cluster to send to the LLM, and other sentences within each cluster are dropped.
Any small clusters are considered outliers, and those are randomly sampled for inclusion in the LLM.
The number of sentences each cluster represents is included in the LLM prompt to ensure the weight of each sentiment is considered.
This may seem straightforward when written in a bulleted list, but there were some devils in the details we had to sort out before we could trust this approach.
Embedding Model Evaluation
First, we had to ensure the model we used effectively embedded text in a space where semantically similar sentences are close, and semantically dissimilar ones are far away. To do this, we simply used the STS benchmark dataset and computed the Pearson correlation for the models we desired to consider. We use AWS as a cloud provider, so naturally we wanted to evaluate their Titan Text Embedding models.
Below is a table showing the Pearson’s correlation on the STS Benchmark for different Titan Embedding models:
So AWS’s embedding models are quite good at embedding semantically similar sentences. This was great news for us – we can use these models off the shelf and their cost is extremely low.
Semantically Similar Clustering
The next challenge we faced was: how can we enforce semantic similarity during clustering? Ideally, no cluster would have two sentences whose semantic similarity is less than humans can accept – a score of 4 in the table above. Those scores, however, do not directly translate to the embedding distances, which is what is needed for agglomerative clustering thresholds.
To deal with this issue, we again turned to the STS benchmark dataset. We computed the distances for all pairs in the training dataset, and fit a polynomial from the scores to the distance thresholds.
This polynomial lets us compute the distance threshold needed to meet any semantic similarity target. For Review Summaries, we selected a score of 3.5, so nearly all clusters contain sentences that are “roughly” to “mostly” equivalent or more.
It’s worth noting that this can be done on any embedding network. This lets us experiment with different embedding networks as they become available, and quickly swap them out should we desire without worrying that the clusters will have semantically dissimilar sentences.
Multi-Pass Clustering
Up to this point, we knew we could trust our semantic compression, but it wasn’t clear how much compression we could get from our data. As expected, the amount of compression varied across different products, clients, and industries.
Without loss of semantic information, i.e., a hard threshold of 4, we only achieved a compression ratio of 1.18 (i.e., a space savings of 15%).
Clearly lossless compression wasn’t going to be enough to make this feature financially viable.
Our distance selection approach discussed above, however, provided an interesting possibility here: we can slowly increase the amount of information loss by repeatedly running the clustering at lower thresholds for remaining data.
The approach is as follows:
Run the clustering with a threshold selected from score = 4. This is considered lossless.
Select any outlying clusters, i.e., those with only a few vectors. These are considered “not compressed” and used for the next phase. We chose to re-run clustering on any clusters with size less than 10.
Run clustering again with a threshold selected from score = 3. This is not lossless, but not so bad.
Select any clusters with size less than 10.
Repeat as desired, continuously decreasing the score threshold.
So, at each pass of the clustering, we’re sacrificing more information loss, but getting more compression and not muddying the lossless representative phrases we selected during the first pass.
In addition, such an approach is extremely useful not only for Review Summaries, where we want a high level of semantic similarity at the cost of less compression, but for other use cases where we may care less about semantic information loss but desire to spend less on prompt inputs.
In practice, there are still a significantly large number of clusters with only a single vector in them even after dropping the score threshold a number of times. These are considered outliers, and are randomly sampled for inclusion in the final prompt. We select the sample size to ensure the final prompt has 25,000 tokens, but no more.
Ensuring Authenticity
The multi-pass clustering and random outlier sampling permits semantic information loss in exchange for a smaller context window to send to the LLM. This raises the question: how good are our summaries?
At Bazaarvoice, we know authenticity is a requirement for consumer trust, and our Review Summaries must stay authentic to truly represent all voices captured in the reviews. Any lossy compression approach runs the risk of mis-representing or excluding the consumers who took time to author a review.
To ensure our compression technique was valid, we measured this directly. Specifically, for each product, we sampled a number of reviews, and then used LLM Evals to identify if the summary was representative of and relevant to each review. This gives us a hard metric to evaluate and balance our compression against.
Results
Over the past 20 years, we have collected nearly a billion user-generated reviews and needed to generate summaries for tens of millions of products. Many of these products have thousands of reviews, and some up to millions, that would exhaust the context windows of LLMs and run the price up considerably.
Using our approach above, however, we reduced the input text size by 97.7% (a compression ratio of 42), letting us scale this solution for all products and any amount of review volume in the future. In addition, the cost of generating summaries for all of our billion-scale dataset reduced 82.4%. This includes the cost of embedding the sentence data and storing them in a database.
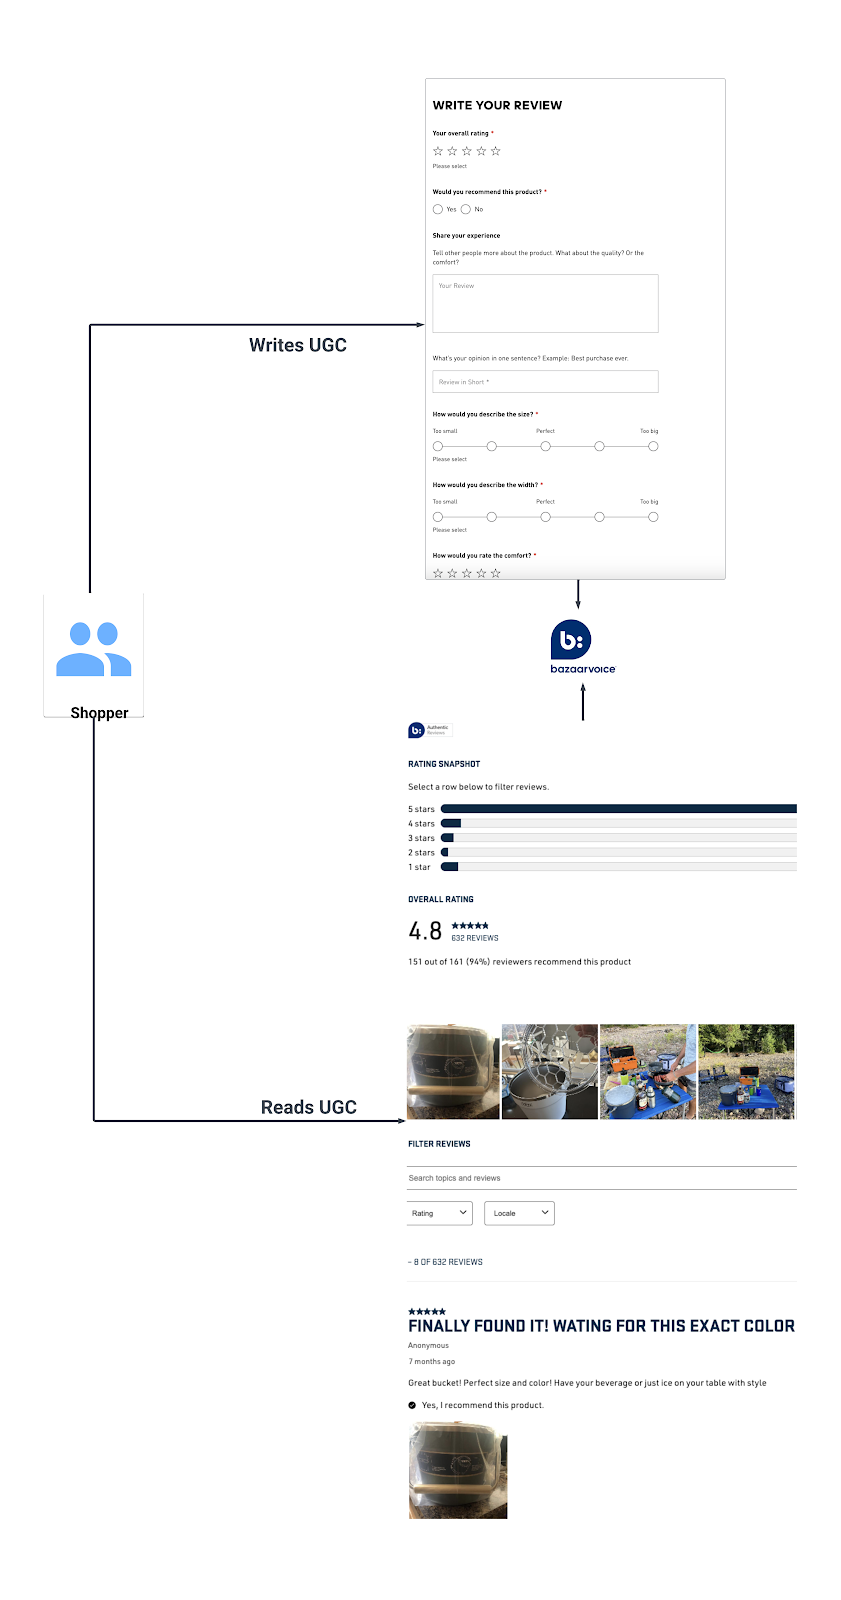
Bazaarvoice has thousands of clients including brands and retailers. Bazaarvoice has billions of records of product catalog and User Generated Content(UGC)from Bazaarvoice clients. When a shopper visits a brand or retailer site/app powered by Bazaarvoice, our APIs are triggered.
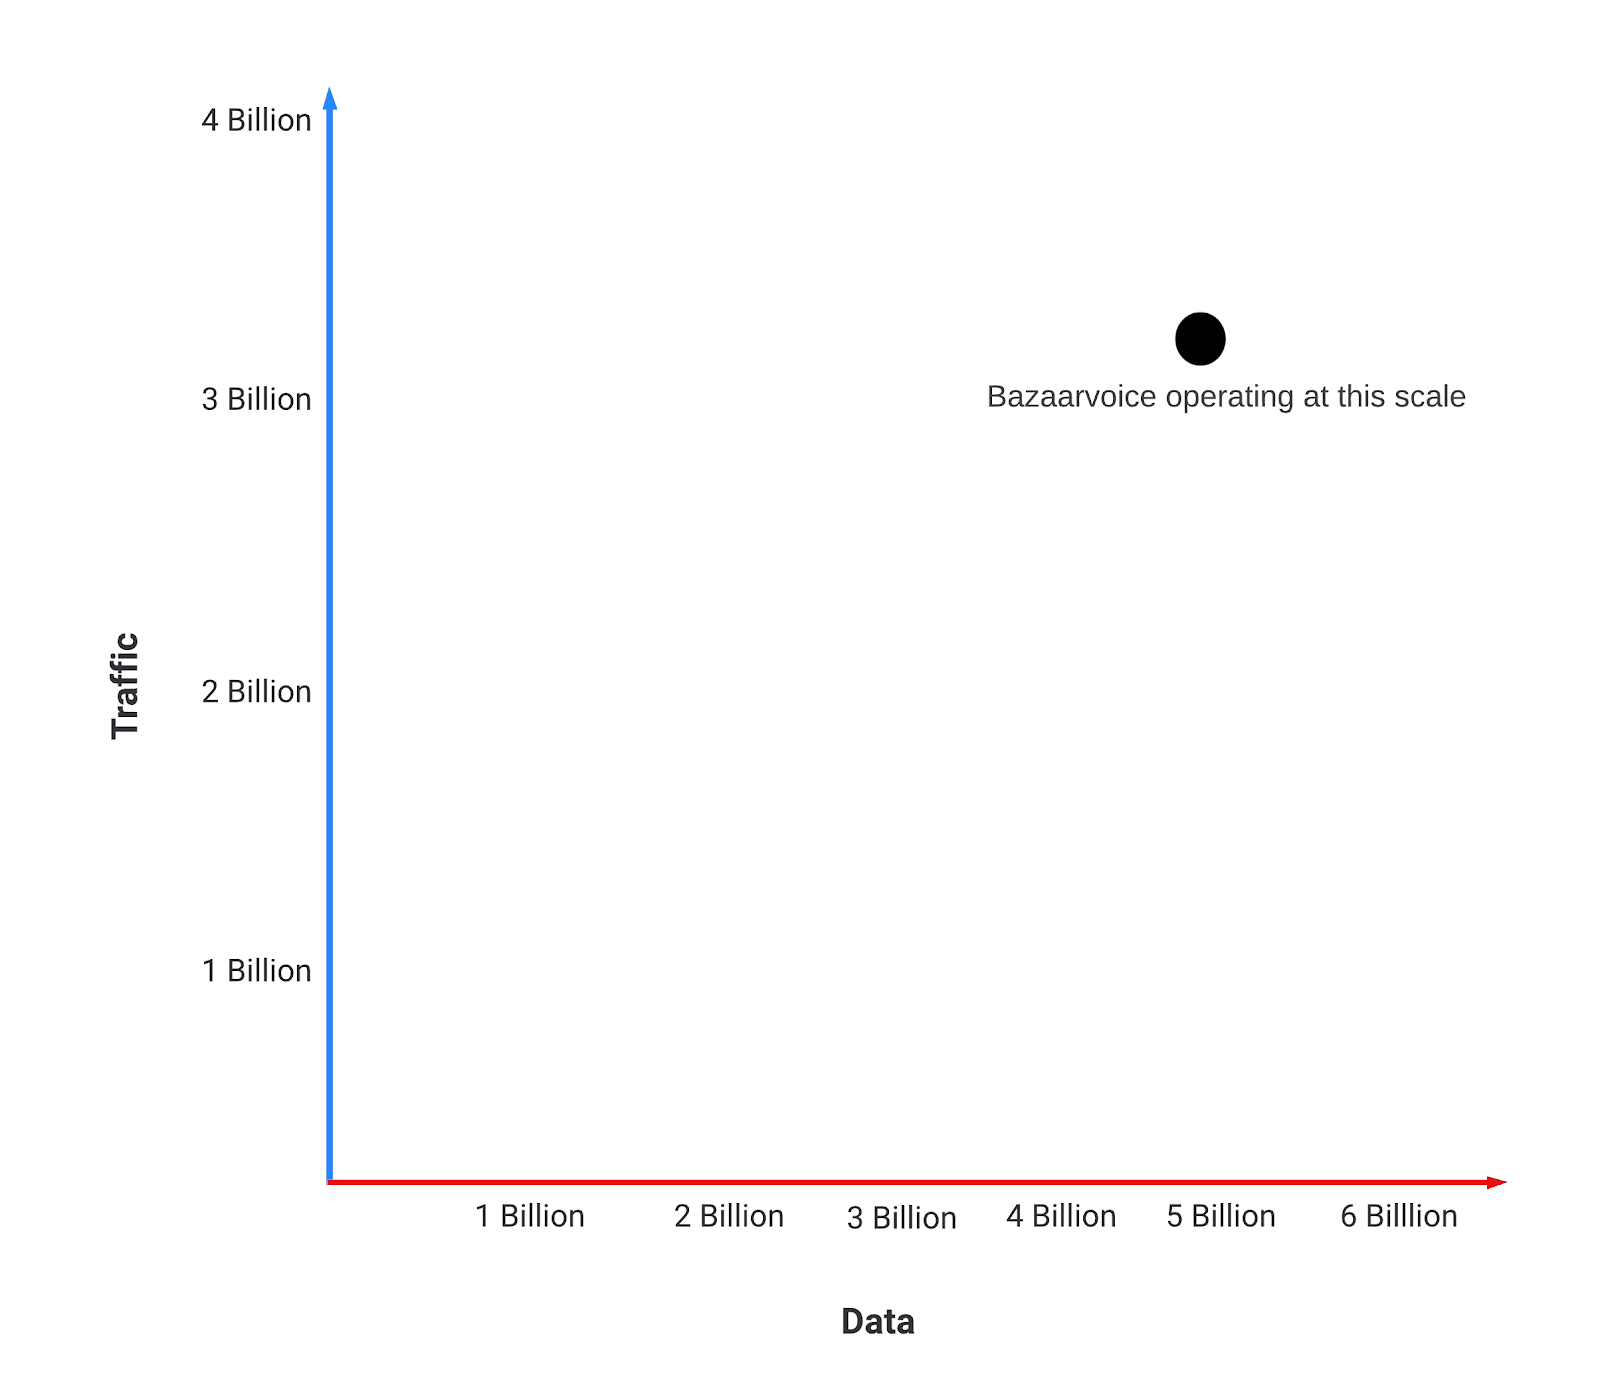
In 2023,Bazaarvoice UGC APIs recorded peak traffic of over 3+ billion calls per day with zero incidents. This blog post will discuss the high level design strategies that are implemented to handle this huge traffic even when serving hundreds of millions of pieces of User Generated Content to shoppers/clients around the globe.
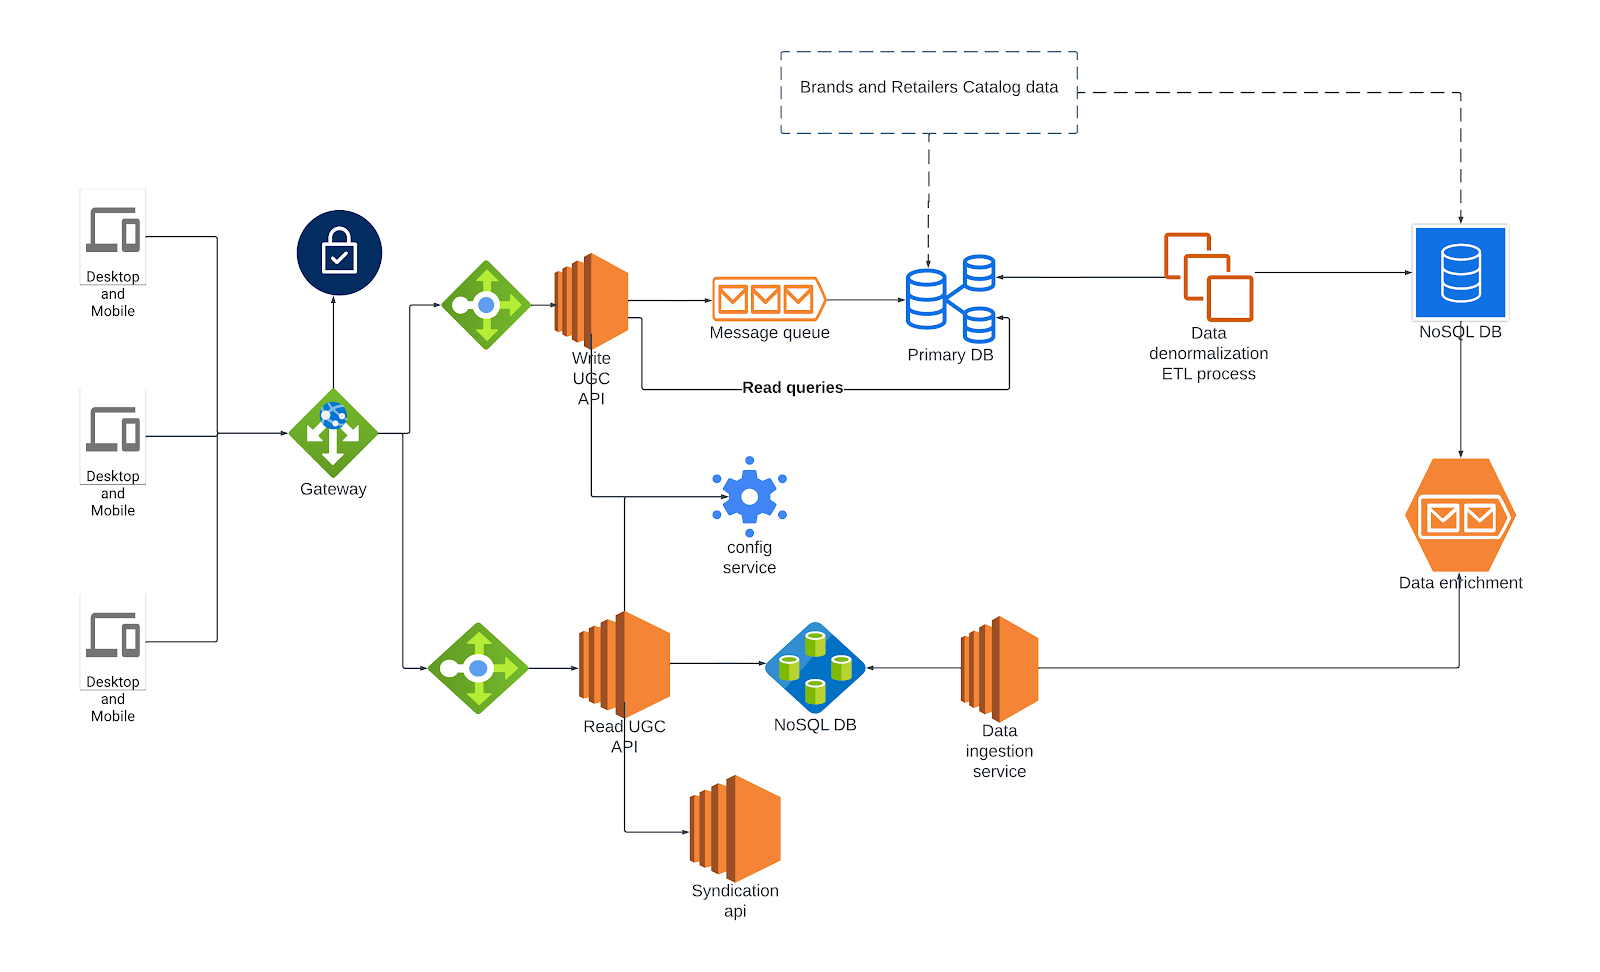
The following actions can take place when shoppers interact with our User-Generated Content (UGC) APIs.
Writing Content
When a shopper writes any content such as reviews or comments etc. on any of the product on retailer or brand site, it invokes a call to Bazaarvoice’s write UGC APIs, followed by Authenticity/content moderation.
Reading Content
When a shopper visits the brand or retailer site/app for a product, Bazaarvoice’s read UGC APIs are invoked.
Traffic: 3+ Billion calls per day(peek)
Data: ~5 Billions of records,Terabyte scale
High-level API Flow:
Whenever a request is made to Bazaarvoice UGC API endpoints, the Bazaarvoice gateway service receives the request, authenticates the request, and then transmits the request information to the application load balancer.
Upon receiving the request from the load balancer, the application server engages with authentication service to authenticate the request. If the request is deemed legitimate, the application proceeds to make a call to its database servers to retrieve the necessary information and the application formulates response accordingly.
Let’s get into a bit deeper into the design
Actions taken at the gateway upon receiving a request
API’s authentication:
We have an authentication service integrated to the gateway to validate the request. If it’s a valid request then we proceed further. Validation includes ensuring that the request is from a legitimate source to serve one of Bazaarvoice’s clients
API’s security:
If our API’s are experiencing any security attacks like Malicious or DDOS requests, WAF intercepts and subsequently blocks the security attacks as per the configured settings.
Response Caching:
We implemented response caching to improve response times and client page load performance, with a duration determined by the Time-to-Live (TTL) configuration for requests. This allows our gateway to resend the cached response, if the same request is received again, rather than forwarding the request to the server.
Understanding User-Generated Content (UGC) Data Types and API Services
Before delving into specifics of how the UGC is originally collected, it’s important to understand the type of data being served.
e.g.
Ratings & Reviews
Questions & Answers
Statistics (Product-based Review Statistics and Questions & Answers Statistics)
Products & Categories
For more details, you can refer to ConversationsAPI documentation via Bazaarvoice’s recently upgraded Developer Center.
Now, let’s explore the internals of these APIs in detail, and examine their interconnectedness.
Write UGC API service
Read UGC API service
Write UGC API service:
Our submission form customized for each client, the form will render based on the client configuration which can include numerous custom data attributes to serve their needs. When a shopper submits content such as a review or a question through the form, our system writes this content to a submission queue. A downstream internal system then retrieves this content from the queue and writes it into the master database.
Why do we have to use a queue rather than directly writing into a database?
Load Leveling
Asynchronous Processing
Scalability
Resilience to Database Failures
Read UGC API service:
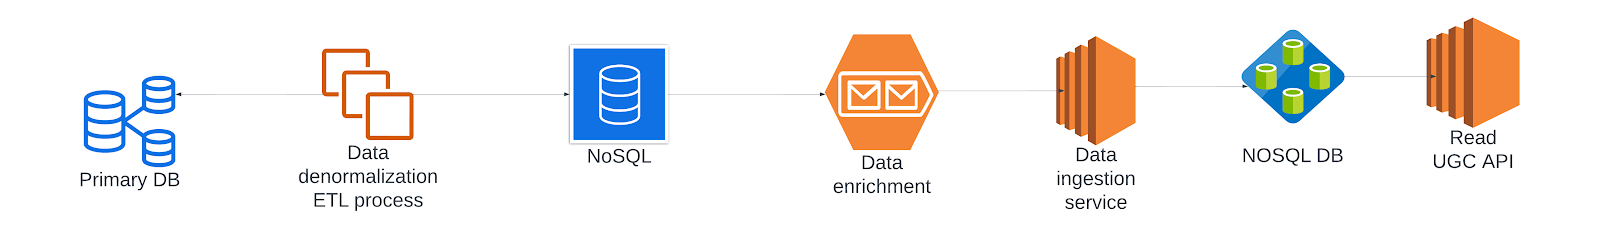
The UGC read API’s database operates independently from the primary, internal database. While the primary database contains normalized data, the read API database is designed to serve denormalized and enriched data specifically tailored for API usage in order to meet the response time expectations of Bazaarvoice’s clients and their shoppers.
Why do we need denormalized data?
To handle large-scale traffic efficiently and avoid complex join operations in real-time, we denormalize our data according to specific use cases.
We transform the normalized data into denormalized enriched data through the following steps:
Primary-Replica setup: This will help us to separate write and read calls.
Data denormalization: In Replica DB, we have triggers to do data processing (joining multiple tables) and write that data into staging tables. We have an application that reads data from staging tables and writes the denormalized data into Nosql DB. Here data is segregated according to the content type. Subsequently, this data is forwarded to message queues for enrichment.
Enriching the denormalized data: Our internal applications consume this data from message queues, with the help of internal state stores, we enrich the documents before forwarding them to a destination message queue.
e.g. : Average rating of a product, Total number of ugc information to a product.
Data Transfer to UGC application Database: We have a connector application to consume data from the destination message queue and write it into the UGC application database.
Now that you’ve heard about how Bazaarvoice’s API’s handles the large client and request scale, let’s add another layer of complexity to the mix!
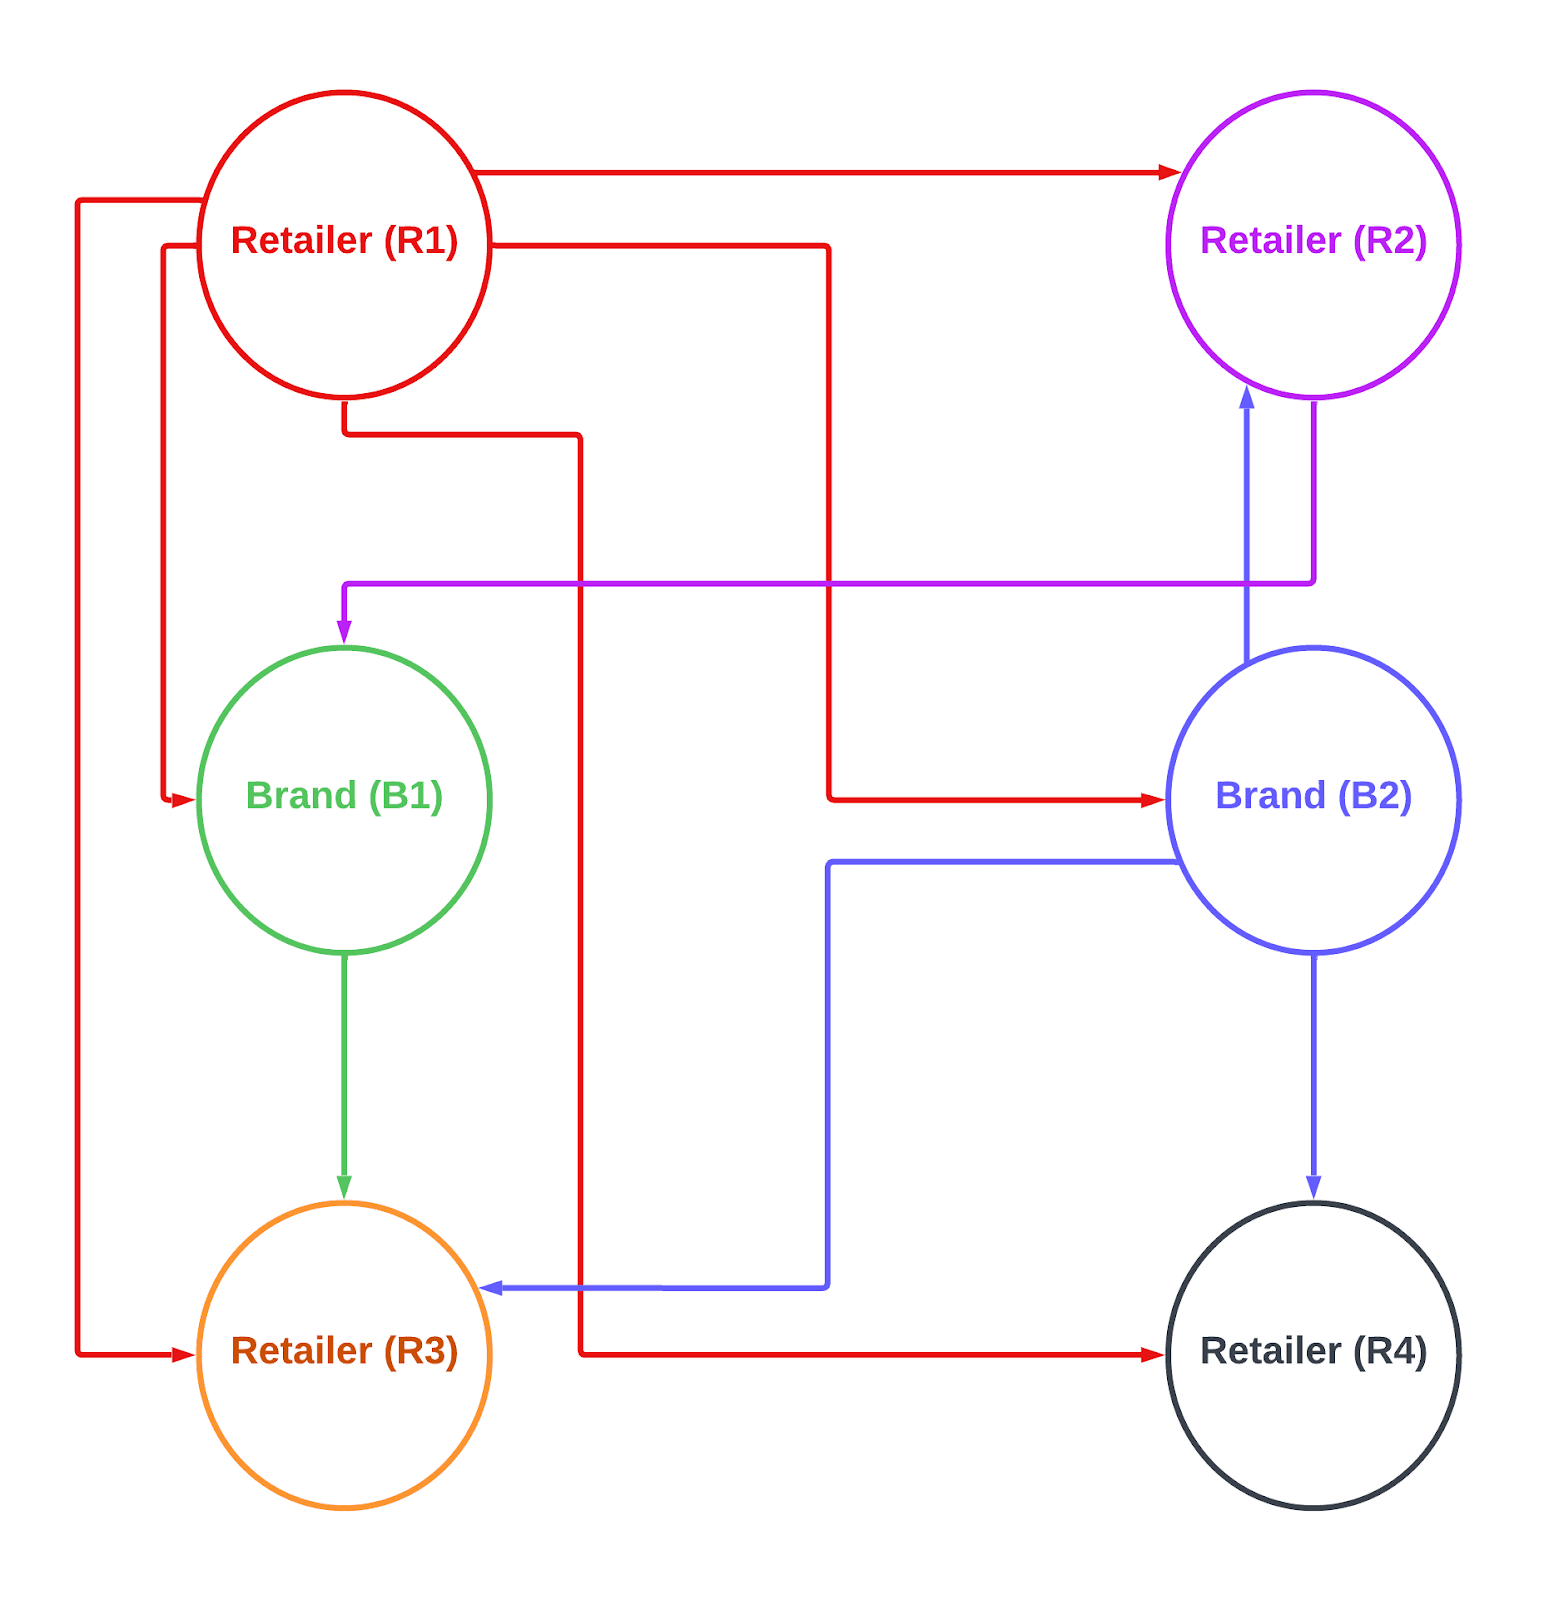
Connecting Brands and Retailers
Up to this point, we’ve discussed the journey of content within a given client’s dataset. Now, let’s delve into the broader problem that Bazaarvoice addresses.
Bazaarvoice helps its brands and retailers share reviews within the bazaarvoice network. For more details refer to syndicated-content.
Let’s talk about the scale and size of the problem before getting into details,
From 12,000+ Bazaarvoice clients, We have billions of catalog and UGC content. Bazaarvoice provides a platform to share the content within its network. Here data is logically separated for all the clients.
Client’s can access their data directly, They can access other Bazaarvoice clients data, based on the Bazaarvoice Network’s configured connections.
E.g. :
From the above diagram, Retailer (R3) wanted to increase their sales of a product by showing a good amount of UGC content.
Retailer (R1)
1 billion catalog & ugc records
Retailer (R2)
2 billion catalog & ugc records
Retailer (R3)
0.5 billion catalog & ugc records
Retailer (R4)
1.2 billion catalog & ugc records
Brand (B1)
0.2 billion catalog & ugc records
Brand (B2)
1 billion catalog & ugc records
Now think,
If Retailer (R3) is accessing only its data, then it’s operating on 0.5 billion records, but here Retailer (R3) is configured to get the ugc data from Brand (B1) , Brand (B2) , Retailer (R1) also.
If you look at the scale now it’s 0.5 + 0.2 + 1 + 1 = 2.7 billions.
To get the data for one request, it has to query on 2.7 billion records. On top of it we have filters and sorting, which make it even more complex.
In Summary
Here I’ve over simplified, to make you understand the solution that Bazaarvoice is providing, in reality it’s much more complex to serve the UGC Write and Read APIs at a global scale with fast response times and remain globally resilient to maintain high uptime.
Now you might correlate why we have this kind of architecture designed to solve this problem. Hopefully after reading this post you have a better understanding of what it takes behind the scenes to serve User Generated Content across Brands and Retailers at billion-record-scale to shoppers across the globe.
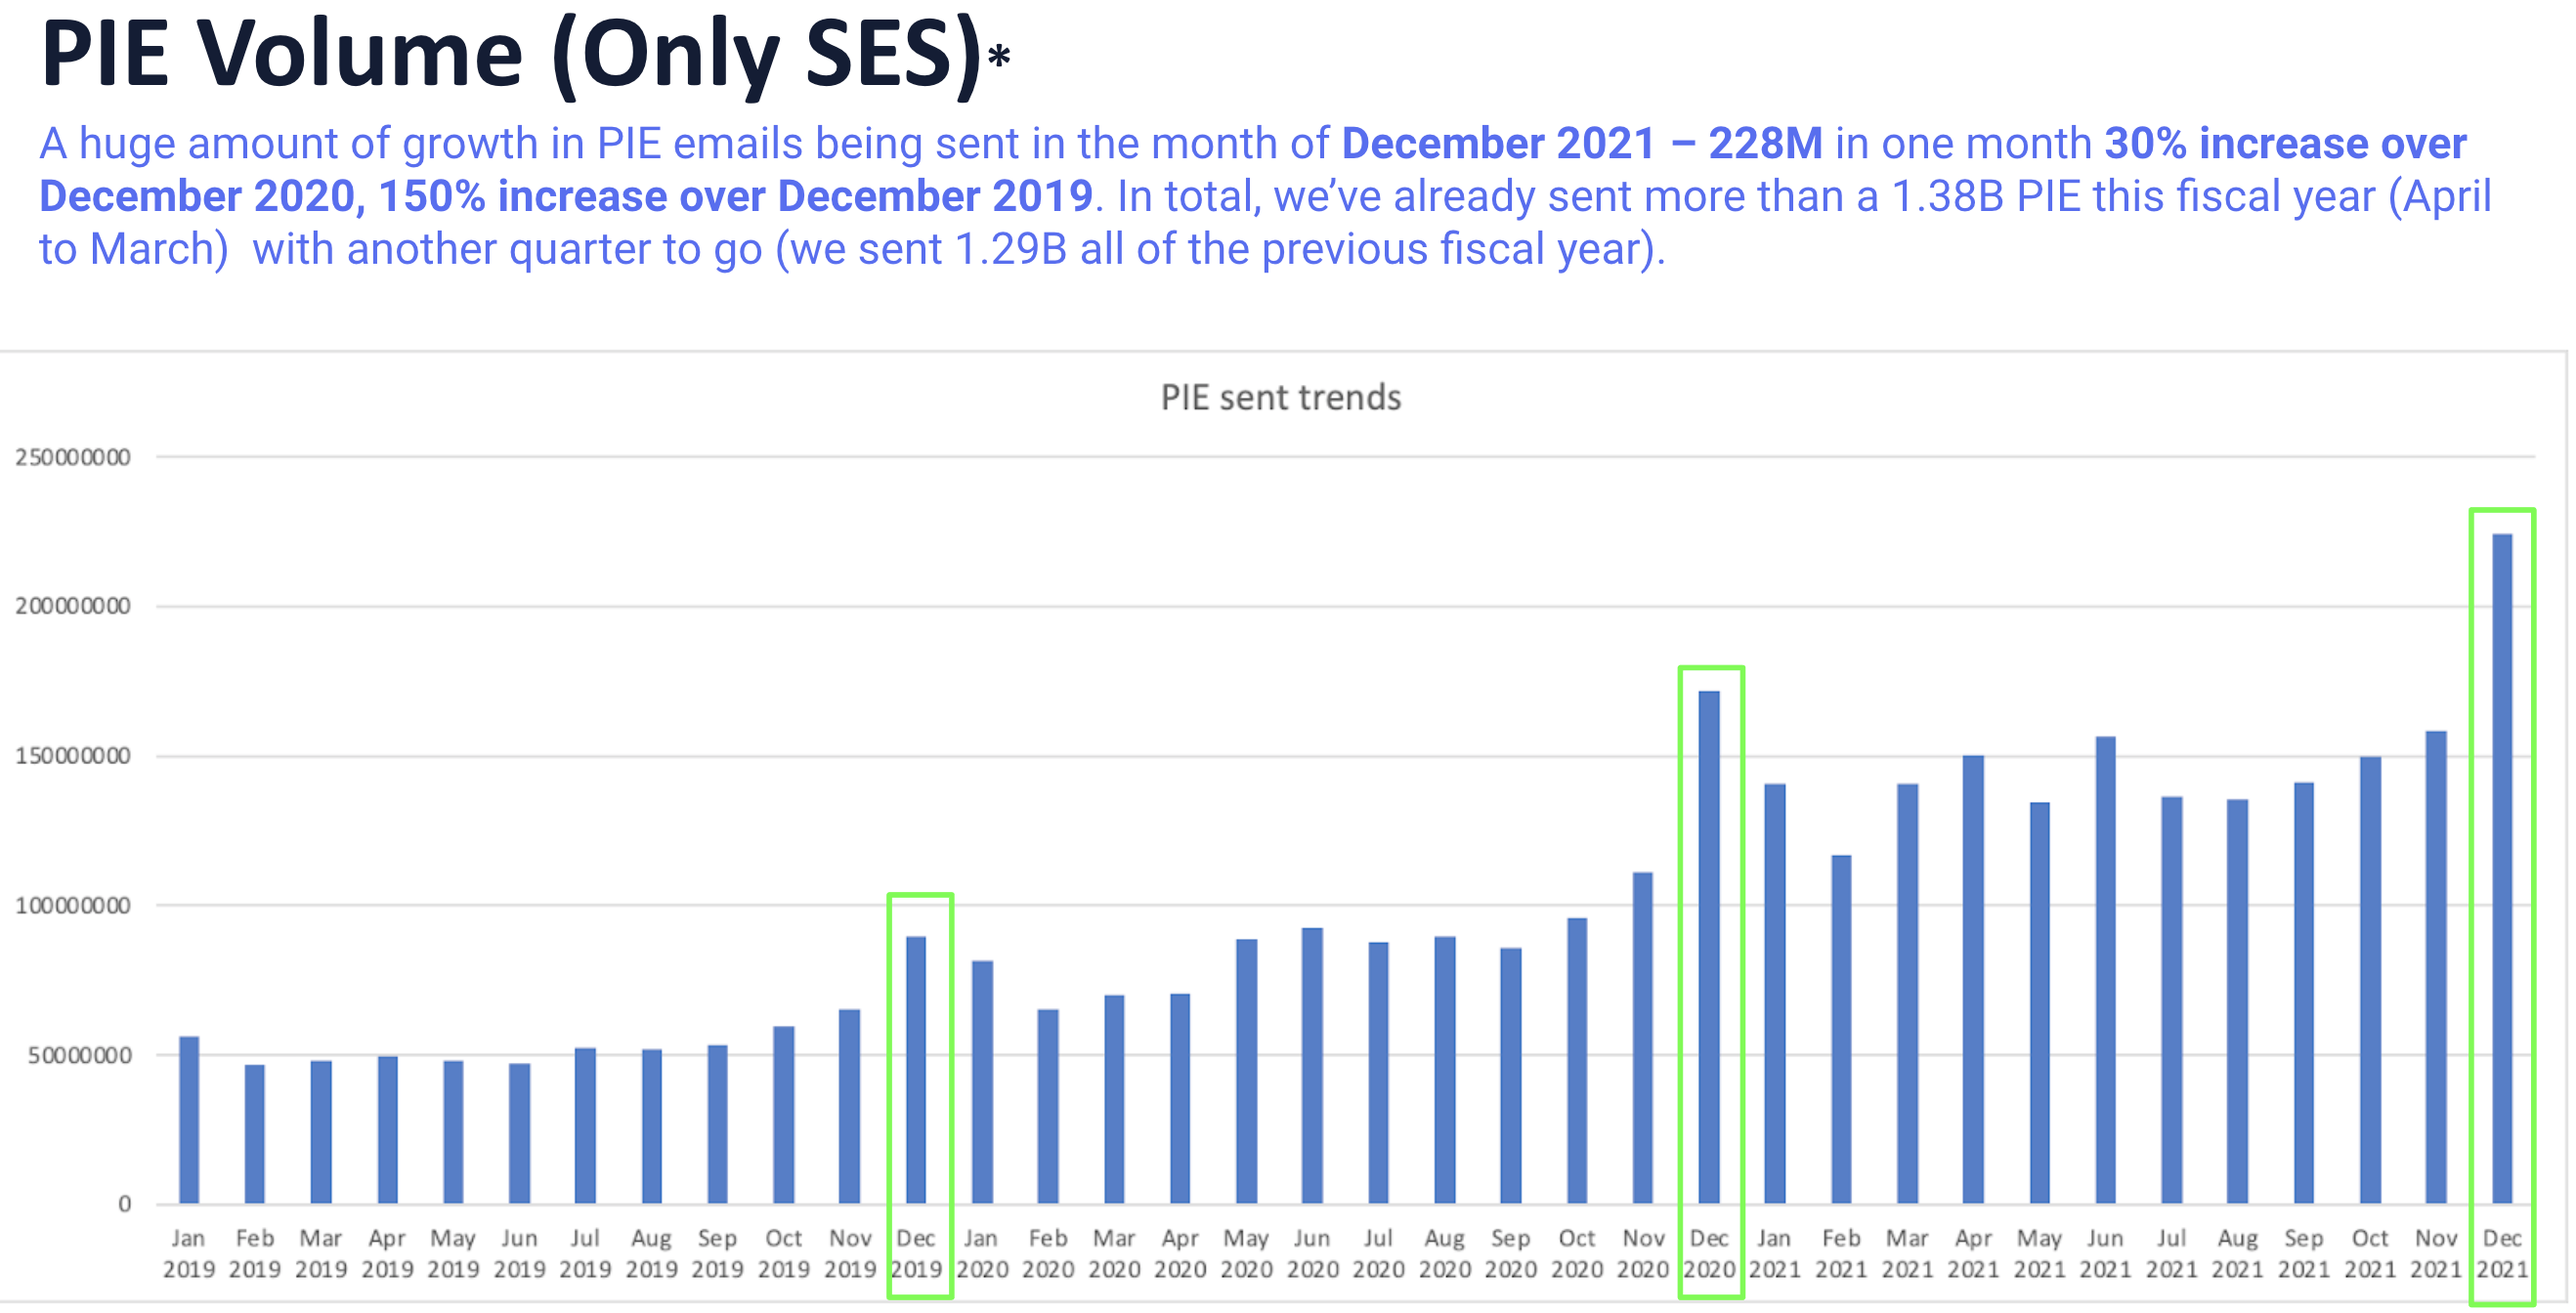
Bazaarvoice notification system stands as a testament to cutting-edge technology, designed to seamlessly dispatch transactional email messages (post-interaction email or PIE) on behalf of our clients. The heartbeat of our system lies in the constant influx of new content, driven by active content solicitations. Equipped with an array of tools, including email message styling, default templates, configurable scheduling, data privacy APIs, email security/encryption, reputation/identity management, as well as auditing and reporting functionalities, our Notification system is the backbone of client-facing communications.
Let’s delve into the system’s architecture, strategically divided into two pivotal components. Firstly, the data ingestion process seamlessly incorporates transactional data from clients through manual uploads or automated transactions uploads. Secondly, the Notification system’s decision engine controls the delivery process, strategically timing email dispatches according to client configurations. Letterpress facilitates scalable email delivery to end consumers, enhancing the efficiency of the process.
Previous Obstacles: What Hindered Progress Before
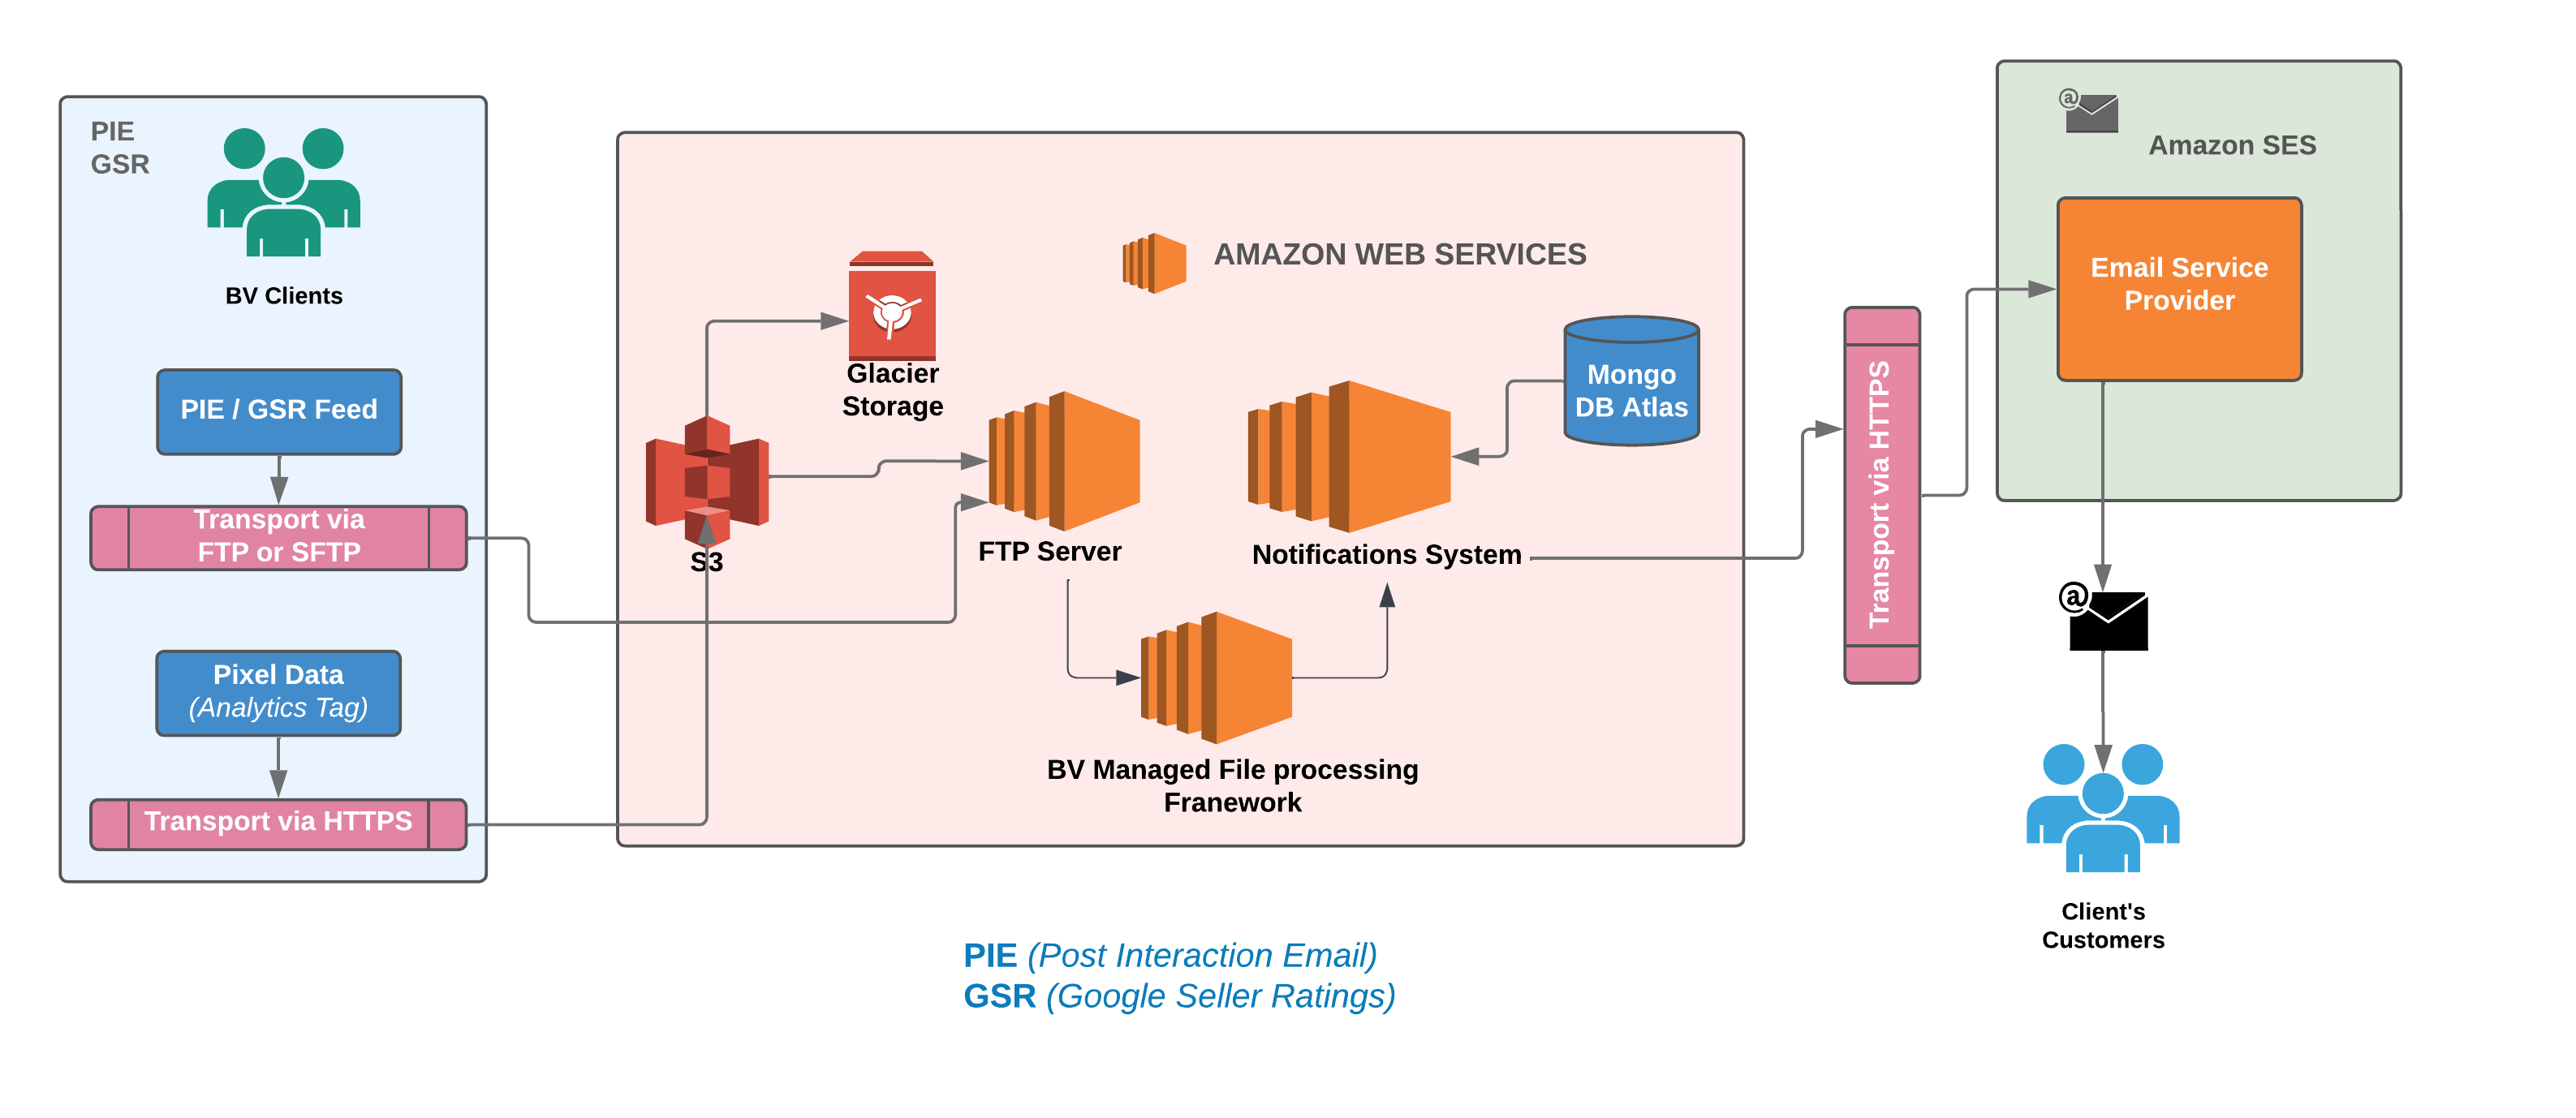
Examining the architecture mentioned above, we were already leveraging the AWS cloud and utilizing AWS managed services such as EC2, S3, and SES to meet our requirements. However, we were still actively managing several elements, such as scaling EC2 instances according to load patterns, managing security updates for EC2s, and setting up a distinct log stream to gather all instance-level logs into a separate S3 bucket for temporary storage, among other responsibilities. It’s important to note that our deployment process used Jenkins and CloudFormation templates. Considering these factors, one could characterize our earlier architecture as semi-cloud-native.
Upon careful observation of the Bazaarvoice-managed File Processing EC2 instances, it becomes apparent that these instances are handling complex, prolonged batch jobs. The ongoing maintenance and orchestration of these EC2 instances add significant complexities to overall operations. Unfortunately, due to the lack of active development on this framework, consumers, such as Notifications, find themselves dedicating 30% of an engineer’s on-call week to address various issues related to feed processing, stuck jobs, and failures of specific feed files. Enduring such challenges over an extended period is challenging. The framework poses a risk of regional outages if a client’s job becomes stuck, and our aim is to achieve controlled degradation for that specific client during such instances. These outages occur approximately once a month, requiring a week of engineering effort to restore everything to a green state.
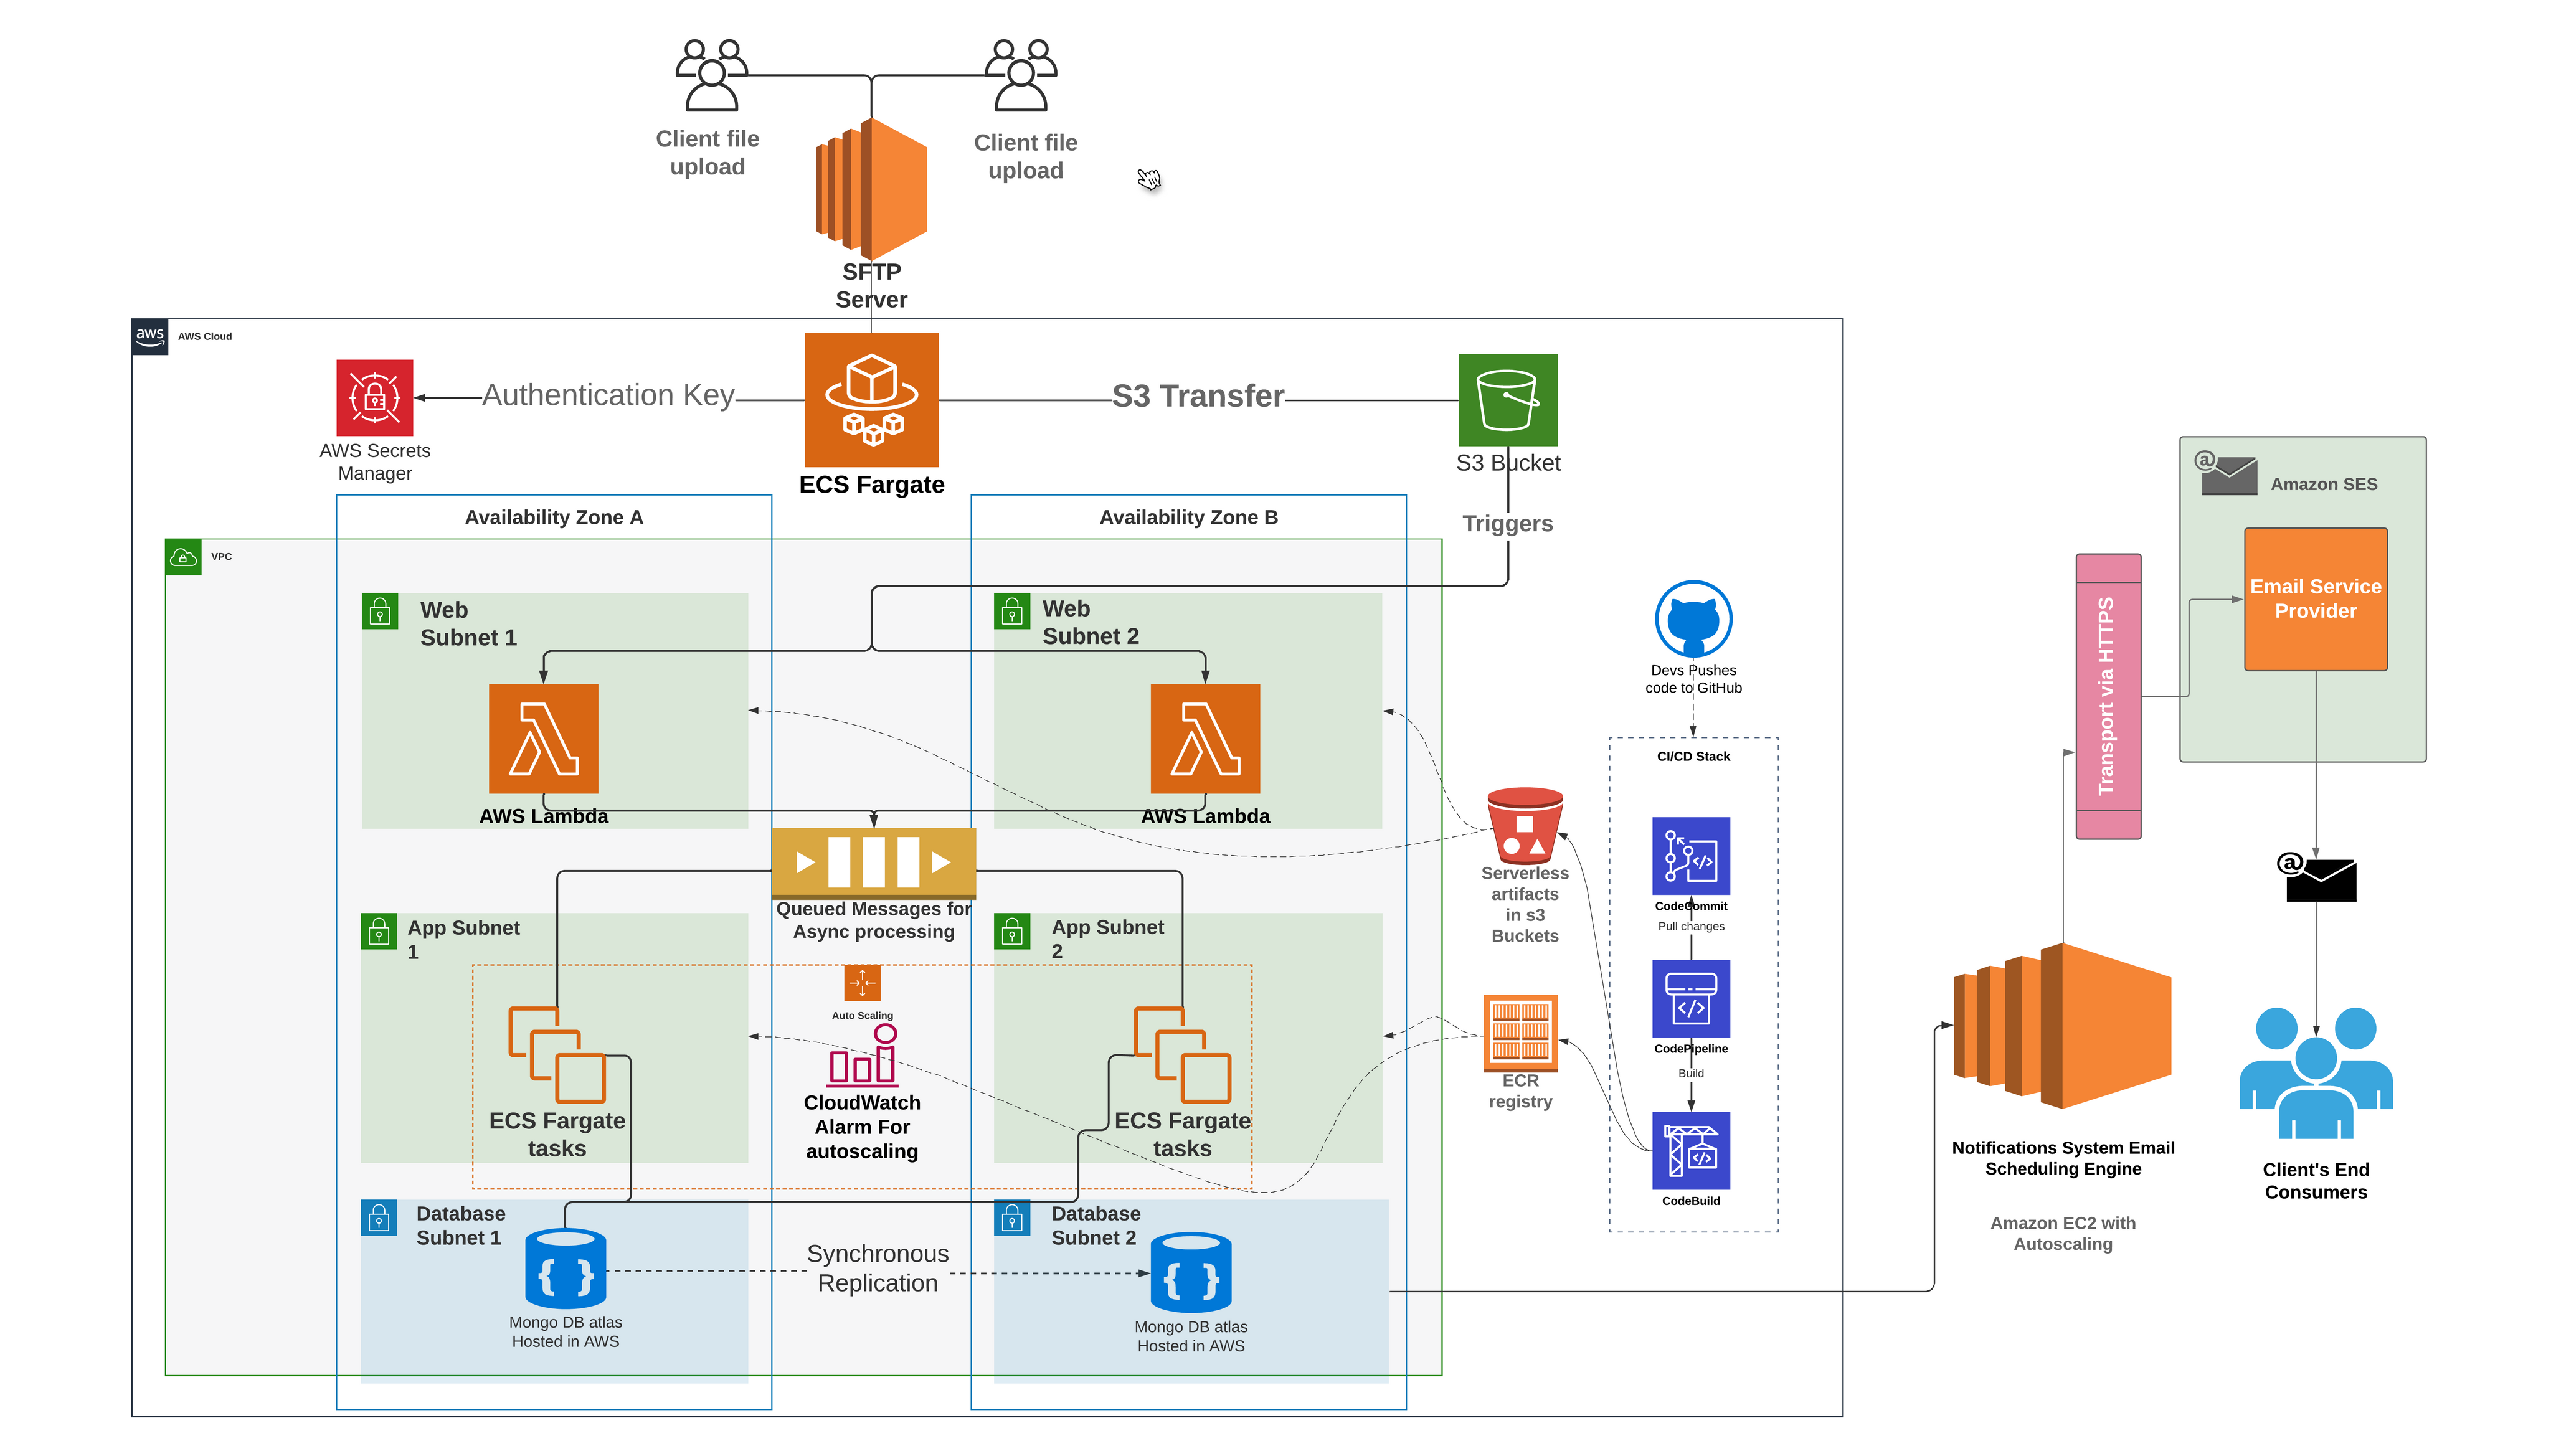
Embrace cloud-native excellence
The diagram above illustrates the recently operationalized cloud-native, serverless data ingestion pipeline for the Notification Systems. Our transition to a cloud-native architecture has been a game-changer. Through meticulous design and rigorous testing, we created a modern, real-time data ingestion pipeline capable of handling millions of transactional data records with unprecedented efficiency. Witness the evolution in action through our cloud-native, serverless data ingestion pipeline, operationalized with precision and running flawlessly for over seven months, serving thousands of clients seamlessly.
We’ve decomposed the complex services that were previously engaged with numerous responsibilities into smaller, specialized services with a primary focus on specific responsibilities. One such service is the engagement-service, tasked with managing all client inbox folders (Email/Text/WhatsApp). This service periodically checks for new files, employs a file splitting strategy to ingest them into our S3 buckets, and subsequently moves them from the inbox to a backup folder, appending a timestamp to the filename for identification.
Achieve excellence by breaking barriers
Microservice
The journey to our current state wasn’t without challenges. Previously, managing AWS cloud services like EC2, S3, and SES demanded significant manual effort. However, by adopting a microservices architecture and leveraging ECS fargate task, AWS Lambda, step functions, and SQS, we’ve streamlined file processing and message conversion, slashing complexities and enhancing scalability.
Serverless Computing
Serverless computing has emerged as a beacon of efficiency and cost-effectiveness. With AWS Lambda handling file-to-message conversion seamlessly, our focus shifts to business logic, driving unparalleled agility and resource optimization.
Transforming the ordinary into the remarkable, our daily transaction feed ingestion handles a staggering 5-6 million entries. This monumental data flow includes both file ingestion and analytics, fueling our innovative processes.
Consider a scenario where this load is seamlessly distributed throughout the day, resulting in a monthly cost of approximately $1.1k. In contrast, our previous method incurred a cost of around $1k per month.
Despite a nominal increase in cost, the advantages are game-changing:
Enhanced Control: Our revamped framework puts us in the driver’s seat with customizable notifications, significantly boosting system maintainability.
Streamlined Operations: Tasks like system downtime, debugging the master node issues, node replacements, and cluster restarts are simplified to a single button click.
Improved Monitoring: Expect refined dashboards and alerting mechanisms that keep you informed and in control.
Customized Delivery: By segregating email messages, SMS, and WhatsApp channels, we maintain client-set send times for text messages to their consumer base.
The pay-as-you-go model ensures cost efficiency of upto 17%, making serverless architecture a strategic choice for applications with dynamic workloads.
The logic for converting files to messages is implemented within AWS Lambda. This function is tasked with the responsibility of breaking down large file-based transactions into smaller messages, directing all client data to respective SQS queues based on the Notification channel (email or SMS). In this process, the focus is primarily on business logic, with less emphasis on infrastructure maintenance and scaling. Therefore, a serverless architecture, specifically AWS Lambda, step functions and SQS were used for this purpose.
Empower multitenancy, scalability, and adaptability
Our cloud-native notifications infrastructure thrives on managed resources, fostering collaboration and efficiency across teams. Scalability and adaptability are no longer buzzwords but integral elements driving continuous improvement and customer-centric innovations. These apps can handle problems well because they’re built from small, independent services. It’s easier to find and fix issues without stopping the whole server.
Notifications cloud-native infrastructure is spread out in different availability zones of a region, so if one zone has a problem, traffic can be redirected quickly to keep things running smoothly. Also, developers can add security features to their apps from the start.
Navigating the cloud-native terrain
Transitioning to cloud-native technologies demands strategic planning and cohesive teamwork across development, operations, and security domains. We started by experimenting with smaller applications to gain familiarity with the process. This allowed us to pinpoint applications that are well-suited for cloud-native transformation and retire those that are not suitable. Our journey has been marked by meticulous experimentation, focusing on applications ripe for transformation and retiring those not aligned with our cloud-native vision.
As we progress deeper into the era of cloud computing, the significance of cloud-native applications goes beyond a fleeting trend; they are positioned to establish a new standard in software engineering.
Through continuous innovation and extensive adoption, we are revolutionizing the landscape of Notifications system of Bazaarvoice with cloud-native applications, bringing about transformative changes through each microservice. The future has arrived, and it’s soaring on the cloud.
I joined Bazaarvoice as a DevOps engineer into the Cloud engineering team in September 2023. It has been a very busy first 4 months learning a lot in terms of technical and soft skills. In this post I have highlighted my key learnings from my start at BV.
Communication
One of the key takeaways I have taken is no work in the DMs. I, and I imagine many others are used to asking questions via direct message to whom we believe would be most knowledgeable on the subject. Which can often lead to a goose chase of getting different names from various people until you find who can help. One thing my team Cloud Engineering utilizes is asking all work-related questions in public channels in slack. Firstly, this removes any wild goose chases as anyone who is knowledgeable on the matter can chime in not just a single person. Furthermore, by having these questions public it creates a FAQ page within slack. I often find myself now debugging or finding answers by searching questions/key words straight into the slack search bar and finding threads of questions which are addressing the same issues I’m facing. This means there are no repetitive answers and I do not have to wait on response times.
Bazaarvoice is a global organisation where I have team members across time zones. This essentially means you have only 50% of the day where myself and my colleagues in the US are online. So, using that time asking questions which have already been answered is not a productive use of time.
Work Ownership
Another concept which I have changed my views on is work ownership and pushing tickets forward as a team.
If you compare a Jira ticket from the first piece of work I started to my current Jira tickets 4 months in, you’ll notice now there is a stream of update comments in my current tickets. This feeds into the concept of the team owning the work rather than just myself. By having constant update comments if I fall ill or for whatever reason can’t continue a ticket a member of the team can easily get context on the state of the ticket by reading through the comments. This allows them to push the ticket forward themselves. Posting things like error messages and current blockers in the Jira comments also allows team members to offer their insight and input instead of keeping everything private.
As well as this upon finishing work, I would usually find another ticket to pick up, however what I now understand is that completing the teams work for the sprint is what’s important, using spare time now to help push the team’s tickets over the line with code reviews, jumping in huddles to troubleshoot issues as well as picking up tickets that colleagues haven’t got round to in the sprint. I now understand the importance of completing work as a team rather than an individual.
Treating internal stakeholders as customers
Bazaarvoice has many external customers and there are many teams who cater to these customers. However, in Cloud Engineering we are not an external customer facing team. Although, we do still have customers. This concept was strange to me at first where our colleagues in other teams were regarded as “customers”. The relationship is largely the same with how one would communicate and have expectations of external customers. We have SLA’s which are agreed upon as well as a “slack channel” for cloud related queries or escalations which the on-call engineer will handle. This customer relationship allows us to deliver efficiently with transparency. Another aspect of this is how we utilise a service request and playbook model. A service request is a common task/operation for our team to complete such as create an AWS account or create a VPC pairing. The service request template will extract all the necessary information from the customer needed to fulfil the request. This removes back and forth conversation between operator and customer, gathering the required information. Each service request is paired with a playbook for the operator to use. These playbooks include step by step instructions of how the operator can fulfil this request. Allowing someone like me from as early as week 2 to be able to fulfil customer requests.
Context shifting
In previous roles I would have to drop current workloads to deal with escalations or colleague questions. This requires a context shift where you must leave the current work and switch focus to something completely unrelated. Once the escalation/query is resolved then you must switch back. This can be tiresome and getting back into the original context of which I was working on takes time. This again feeds into the customer relationship the team has with internal stakeholders. A member of the team will be “on-call” for that week where they will handle all customer requests and answer customer queries. This allows the rest of the team to stick within their current context and deep focus on the task at hand without needing to switch focus. I have found this very beneficial when working on tasks which require a lot of deep focus and as such feel a lot more focussed in my delivery of meaningful work.
Utilising the size of the organisation
The organisation’s codebase consists of 1.5k repositories containing code serving all kinds of functionality. This means when embarking on a new piece of work there is often a nice template from another team which can be used which has a similar context due to being in the same organisation (same security constraints, AWS accounts ect.). For example, I recently created a GitHub Actions release workflow for one of our systems but had problems with authenticating into AWS via the workflow. A simple GitHub search for what I was looking for allowed me to find a team who has tackled the same problem I am facing. Meaning I can see how my code differs from theirs and make changes accordingly. I have had a problem solved by another team without them even realising!
Learn by doing!
I find reading documentation about systems can only get you so far in terms of understanding. Real understanding, I believe, comes from being able to actively make changes to a system and deploy these changes as a new release. This is something me and my onboarding mentor utilised. They set me a piece of work which I could go away and try in the mornings then we’d come together in the afternoon in a slack huddle to review my progress (making use of the time zone differences). This is a model that certainly worked for me and something I would try with any new onboardees that I may mentor.
Conclusion
Overall I have thoroughly enjoyed my first 4 months as a DevOps Engineer at Bazaarvoice particularly working on new technologies and collaborating with my team mates. But what has shocked me most is how much I had to improve on my communication and ways of working, something that is not taught much in the world of engineering with most the emphasis being on technical skills.
I hope you have enjoyed reading this and that you can take something away from your own ways of working!
We all have secrets. Sometimes, these are guilty pleasures that we try to keep hidden, like watching cheesy reality TV or indulging in strange comfort food. We often worry:
“How do we keep the secret safe?”
“What could happen if someone finds out the secret?”
“Who is keeping a secret?”
“What happens if we lose a secret?”
At Bazaarvoice, our security team starts with these same questions when it comes to secret management. They are less interested in trivial secrets like who left their dishes in the office sink or who finished the milk. Instead, they focus on the secrets used in the systems that power a wide range of products for the organization. They include:
API keys and tokens
Database connection strings that contain passwords
Encryption keys
Passwords
With hundreds of systems and components depending on secrets at Bazaarvoice, enumerating them and answering the above questions quickly, consistently and reliably can become a challenge without guiding standards.
This post will discuss secret management and explain how Bazaarvoice implemented a Secret Catalog using open-source software. The post will provide reusable examples and helpful tips to reduce risk and improve compliance for your organization. Let’s dive in!
Secrets Catalog
Bazaarvoice is ISO27001 compliant and ensures its systems leverage industry standard tools and practices to store secrets securely. However, it isn’t always in the same place, and secrets can be stored using different tools. Sometimes AWS Secret Manager makes sense; other times, AWS KMS is a better choice for a given solution. You may even have a multi-cloud strategy, further scattering secrets. This is where a Secrets Catalog is extremely useful, providing a unified view of secrets across tools and vendors.
It may sound a little boring, and the information captured isn’t needed most of the time. However, in the event of an incident, having a secret catalog becomes an invaluable resource in reducing the time you need to resolve the problem.
Bazaarvoice recognized the value of a secrets catalog and decided to implement it. The Security Team agreed that each entry in the catalog must satisfy the following criteria:
A unique name
A good description of its purpose
Clear ownership
Where it is stored
A list of dependent systems
References to documentation to remediate any related incident, for example, how to rotate an API key
Crucially, the value of the secretmust remain in its original and secure location outside of the Catalog, but it is essential to know where the secret is stored. Doing so avoids a single point of failure and does not hinder any success criteria.
Understanding where secrets are stored helps identify bad practices. For example, keeping an SSH key only on team members’ laptops would be a significant risk. A person can leave the company, win the lottery, or even spill a drink on their laptop (we all know someone!). The stores already defined in the catalog guide people in deciding how to store a new secret, directing them to secure and approved tools resistant to human error.
Admittedly, the initial attempt to implement the catalog at Bazaarvoice didn’t quite go to plan. Teams began meeting the criteria, but it quickly became apparent that each team produced different interpretations stored in multiple places and formats. Security would not have a unified view when multiple secret catalogs would ultimately exist. Teams would need additional guidance and a concrete standard to succeed.
We already have a perfect fit for this!
Bazaarvoice loves catalogs. After our clients, they might be our favourite thing. There is a product catalog for each of our over ten thousand clients, a data catalog, and, most relevantly, a service catalog powered by Backstage.
“Backstage unifies all your infrastructure tooling, services, and documentation to create a streamlined development environment from end to end.”
As shown in the diagram above, at the core of the Backstage model are Systems, Components, and Resources, the most relevant entities for secret management. You can find detailed descriptions of each entity in the Backstage modeling documentation. Briefly, they can be thought about as follows:
System – A collection of lower-level entities, including Components and Resources, acting as a layer of abstraction.
Component – A piece of software. It can optionally produce or consume APIs.
Resource – The infrastructure required by Components to operate.
New Resource Types
Resources are one of the Backstage entities used to represent infrastructure. They are a solid fit for representing secrets, allowing us to avoid writing custom in-house software to do the same job. Therefore, we defined two new Resource Types: secret and secret-store.
Tip: Agree on the allowed Types upfront to avoid a proliferation of variations such as ‘database’ and ‘db’ that can degrade searching and filtering.
Having already invested the effort in modeling the Bazaarvoice ecosystem, adding the necessary YAML to define secrets and secret stores was trivial for teams.
Example minimal secret store:
apiVersion: backstage.io/v1alpha1
kind: Resource
metadata:
  name: aws-secrets-manager
  description: Resources of type 'secret' can depend on this Resource to indicate that it is stored in AWS Secrets Manager
spec:
  type: secret-store
  owner: team-x
It’s fantastic in our eyes! Let’s break down the image above.
The “About” section explains the secret, including which system it’s associated with, its owner, and the fact that it’s currently in production. It also provides a link to the source code and a way to report issues or mistakes, such as typos.
The “Relations” section, powered by an additional plugin, provides a visual and interactive graph that displays the relationships associated with the secret. This graph helps users quickly build a mental picture of the resources in the context of their systems, owners, and components. Navigating through this graph has proven to be an effective and efficient mechanism for understanding the relationships associated with the secret.
The “Links” section offers a consistent place to reference documentation related to secret management.
Lastly, the “PagerDuty” plugin integrates with the on-call system, eliminating the need for manual contact identification during emergency incidents.
The value of Backstage shines through the power of the available plugins. Searching and filtering empower discoverability, and the API opens the potential for further integrations to internal systems.
Keeping it fresh
Maintaining accurate and up-to-date documentation is always a challenge. Co-locating the service catalog with related codebases helps avoid the risk of it becoming stale and has become a consideration for reviewing and approving changes.
We are early in our journey with this approach to a secrets catalog and aim to share our incremental improvements in further blog posts as we progress.
The holiday season brings a huge spike in traffic for many companies. While increased traffic is great for retail business, it also puts infrastructure reliability to the test. At times when every second of uptime is of elevated importance, how can engineering teams ensure zero downtime and performant applications? Here are some key strategies and considerations we employ at Bazaarvoice as we prepare our platform to handle over 16 Billion API calls during Cyber Week.
Key to approaching readiness for peak load events is defining the scope of testing. Identify which services need to be tested and be clear about success requirements. A common trade off will be choosing between reliability and cost. When making this choice, reliability is always the top priority. ‘Customer is Key’ is a key value at Bazaarvoice, and drives our decisions and behavior. Service Level Objectives (SLOs) drive clarity of reliability requirements through each of our services.
“Reliability is always the top priority“
When customer traffic is at its peak, reliability and uptime must take precedence over all other concerns. While cost efficiency is important, the customer experience is key during these critical traffic surges. Engineers should have the infrastructure resources they need to maintain stability and performance, even if it means higher costs in the short-term.
Thorough testing and validation well in advance is essential to surfacing any issues before the holidays. All critical customer-facing services undergo load and failover simulations to identify performance bottlenecks and points of failure. In a Serverless-first architecture, ensuring configuration like reserved concurrency and quota limits are sufficient for autoscaling requirements are valuable to validate. Often these simulations will uncover problems you have not previously encountered. For example, in this year’s preparations our load simulations uncovered scale limitations in our redis cache which required fixes prior to Black Friday.
“It’s not only about testing the ability to handle peak load”
It’s important to note readiness is not only about testing the ability to handle peak load. Disaster recovery plans are validated through simulated scenarios. Runbooks are verified as up-to-date, to ensure efficient incident response in the event something goes wrong. Verifying instrumentation and infrastructure that supports operability are tested, ensuring our tooling works when we need it most.
Similarly ensuring the appropriate tooling and processes are in place to address security concerns is another key concern. Preventing DDoS attacks which could easily overwhelm the system if not identified and mitigated, preventing impact of service availability.
Predicting the future
Observability through actionable monitoring, logging, and metrics provides the essential visibility to detect and isolate emerging problems early. It also provides the historical context and growth of traffic data over time, which can help forecast capacity needs and establish performance baselines that align with real production usage. In addition to quantitative measures, proactively reaching out to clients means we are in step with client needs about expected traffic helping align testing to actual usage patterns. This data is important to simulate real world traffic patterns based on what has gone before, and has enabled us to accurately predict Black Friday traffic trends. However it’s important our systems are architected to scale with demand, to handle unpredicted load if need be, key to this is observing and understanding how our systems behave in production.
Traffic Trends
What did it look like this year? Consumer shopping patterns remained quite consistent on an elevated scale. Black Friday continues to be the largest shopping day of the year, and consumers continue to shop online in increasing numbers. During Cyber Week alone, Bazaarvoice handled over 16 Billion API calls.
Solving common problems once
While individual engineering teams own service readiness, having a coordinated effort ensures all critical dependencies are covered. Sharing forecasts, requirements, and learnings across teams enables better preparation. Testing surprises on dependent teams should be avoided through clear communication.
Automating performance testing, failover drills, and monitoring checks as part of regular release cycles or scheduled pipelines reduces the overhead of peak traffic preparation. Following site reliability principles and instilling always-ready operational practices makes services far more resilient year-round.
For example, we recently put in place a shared dev pattern for continuous performance testing. This involves a quick setup of k6 performance script, an example github action pipeline and observability configured to monitor performance over time. We also use an in-house Tech Radar to converge on common tooling so a greater number of teams can learn and stand on the shoulders of teams who have already tried and tested tooling in their context.
Other examples include, adding automation to performance tests to replay production requests for a given load profile makes tests easier to maintain, and reflect more accurately production behavior. Additionally, make use of automated fault injection tooling, chaos engineering and automated runbooks.
Adding automation and ensuring these practices are part of your everyday way of working are key to reducing the overhead of preparing for the holidays.
Consistent, continuous training conditions us to always be ready
Moving to an always-ready posture ensures our infrastructure is scalable, reliable and robust all year round. Implementing continuous performance testing using frequent baseline tests provides frequent feedback on performance from release to release. Automated operational readiness service checks ensure principles and expectations are in place for production services and are continuously checked. For example, automated checking of expected monitors, alerts, runbooks and incident escalation policy requirements.
At Bazaarvoice our engineering teams align on shared System Standards which gives technical direction and guidance to engineers on commonly solved problems, continuously evolving our systems and increasing our innovation velocity. To use a trail running analogy, System Standards define the preferred paths and combined with Tech Radar, provide recommendations to help you succeed. For example, what trail running shoes should I choose, what energy refuelling strategy should I use, how should I monitor performance. The same is true for building resilient reliable software, as teams solve these common problems, share the learnings for those teams which come after.
Looking Ahead
With a relentless focus on reliability, scalability, continuous testing, enhanced observability, and cross-team collaboration, engineering organizations can optimize performance and minimize downtime during critical traffic surges.
Don’t forget after the peak has passed and we have descended from the summit, analyze the data. What went well, what didn’t go well, and what opportunities are there to improve for the next peak.