Category Archives: UX

BV Hosted Display – The New Baseline for CWV metrics

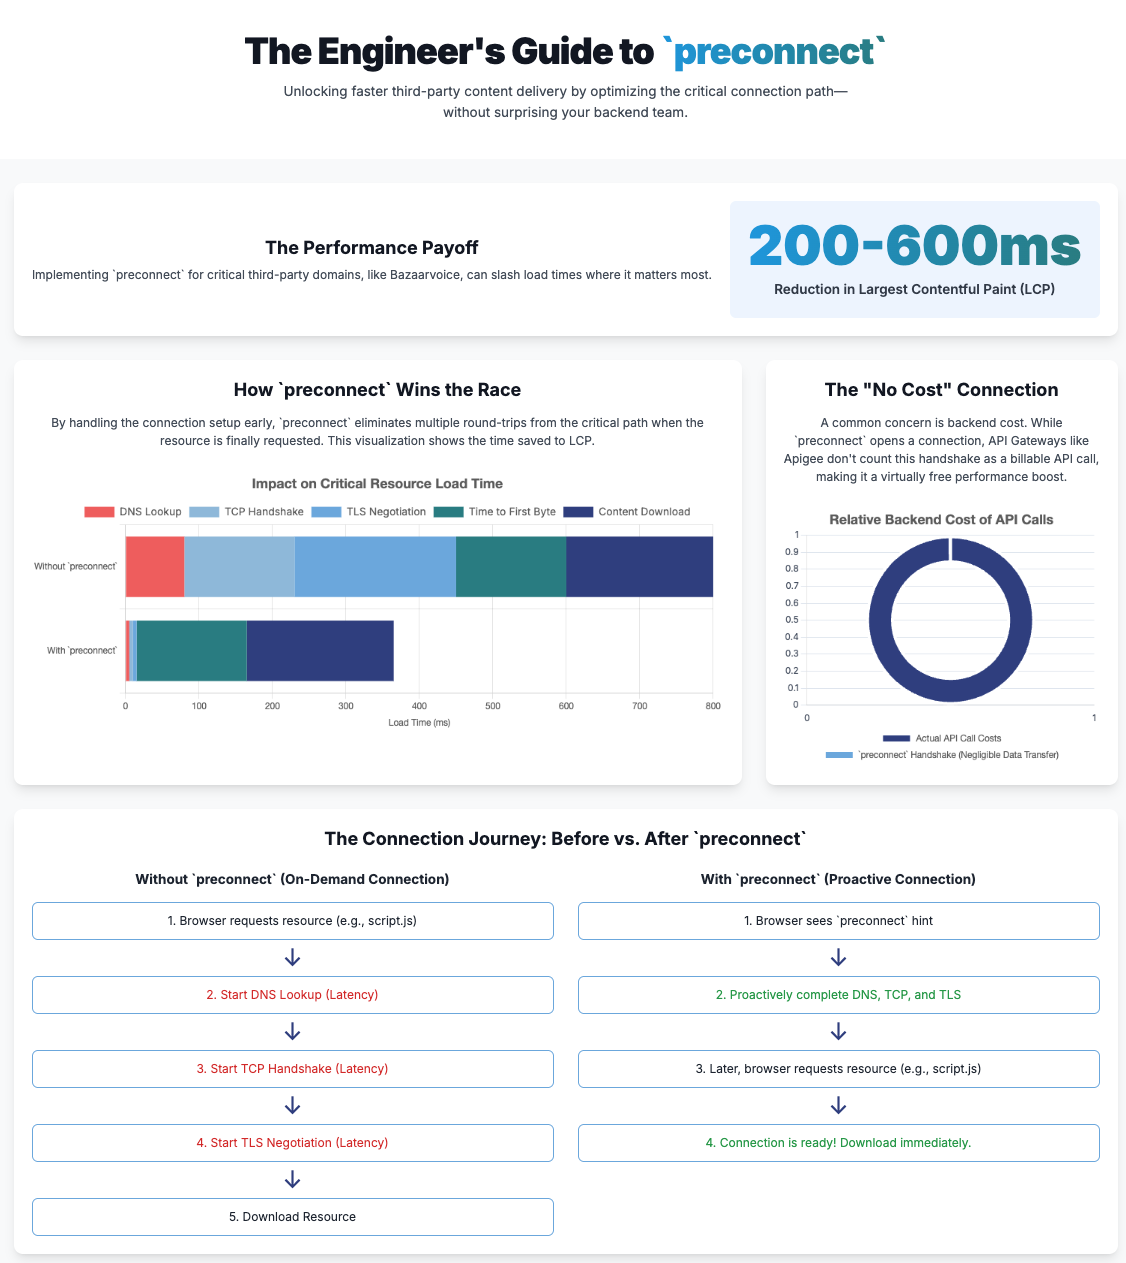
The Old Way vs. The Reality of Your Customers

For years, the gold standard for benchmarking web performance, particularly for Google’s Core Web Vitals (CWV), has been a mobile device baseline—specifically, a throttled connection and CPU designed to simulate a Moto G4. This approach was established with good intentions: to ensure websites are accessible to users on older, lower-end devices and slower networks. It was a one-size-fits-all solution for a global audience.

However, the world has changed. The devices your customers use today are a far cry from the Moto G of years past. Relying on this outdated benchmark device is no longer an accurate measure of your user experience and, more importantly, it can lead to a poor return on investment (ROI) for your performance optimization efforts in the web layer.

This document will walk you through why a shift is necessary and present a new, data-driven benchmarking strategy based on the reality of your user traffic.

The Problem with the old Benchmark

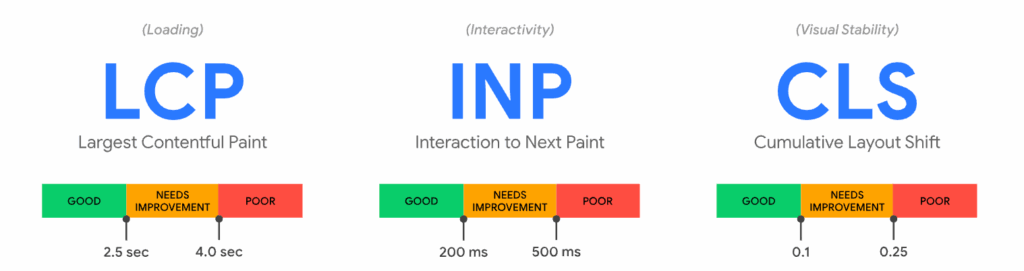
The Core Web Vitals we focus on—Largest Contentful Paint (LCP), Interaction to Next Paint (INP), and Cumulative Layout Shift (CLS)—are all heavily influenced by a device’s hardware and network. The Moto G benchmark, while a useful reference, presents three critical problems for e-commerce businesses:

  1. The Hardware Mismatch: The Moto G4 was released in 2016, running on Android 6.0.1 (Marshmallow). Modern traffic data, however, tells a very different story. Our internal data from the Bazaarvoice Hosted Display component, which powers ratings and reviews on thousands of e-commerce sites, shows that the oldest version of iOS we see reaching our services is on an iPhone X, while the oldest Android OS is Android 10. Optimizing for a device running an OS that is multiple generations behind a significant portion of your user base is a fundamental mismatch.
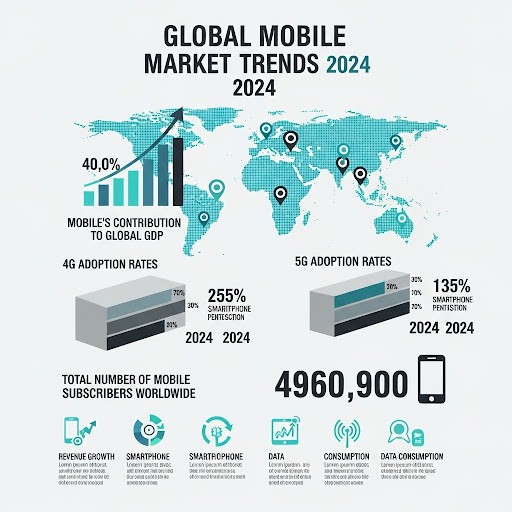
  2. The Network Gap: The Moto G benchmark simulates a slow 3G/4G network connection. Today’s reality is that the world is rapidly adopting faster networks. By the end of 2024, global 4G network coverage reached 90% of the population, and 5G mid-band population coverage was at 40% [1]. These modern networks, combined with the faster CPUs of current devices, drastically reduce the time needed for critical tasks like DNS lookups and SSL handshakes, which heavily influence your Time to First Byte (TTFB) and, consequently, your LCP.
  3. The Negative ROI: The Moto G benchmark represents a minuscule, and frankly, a declining portion of your audience. The cost and effort of optimizing for the technical limitations of these devices—such as slow CPU and memory processing of HTTP/2 responses—simply do not provide a meaningful ROI. The Moto G itself is no longer in production, further cementing its irrelevance as a modern performance target.

Infographics – Market trends from 2024

Here is a look at some of the latest mobile market trends from 2024:

The Bazaarvoice Way (A Data-Driven Alternative)

At Bazaarvoice, our performance optimization strategy is driven by our clients’ real-world traffic data, not a static global benchmark. Our data reveals a powerful truth about your customers:

  • 75%+ of all traffic to our Hosted Display component comes from mobile devices. This is a metric that is validated by global e-commerce trends, with multiple industry reports confirming that over 70% of e-commerce traffic is now mobile-driven [2, 3]. This highlights the critical importance of mobile performance.
  • The most-used devices are far more powerful than the Moto G. For example, we see that 41% of all traffic comes from iOS devices, with a significant concentration on recent versions. We also see that 21% of traffic comes from Android 10+ devices, with Android 10 itself generating a substantial amount of traffic at 15%. This mirrors broader market trends, especially in high-income regions, where iOS and newer Android devices dominate e-commerce traffic [4, 5].

This data allows us to propose a new, intelligent benchmarking strategy that delivers better user experience and a higher ROI.

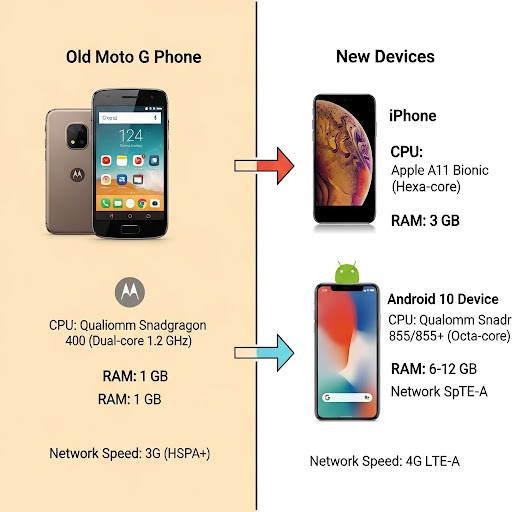
Infographics – Device capacity comparison

This infographic illustrates the hardware and network gap between the old and new mobile devices:

The New Benchmarking Strategy

Instead of optimizing for an obsolete device, we recommend a two-pronged approach:

  1. The “Golden Path” Benchmark: Optimize your web services and UI components for the devices your customers use most. In our case, this would mean ensuring exceptional performance on the newest iOS and Android devices, as they represent the majority of your traffic.
  1. The “Long Tail” Benchmark: Use the oldest high-traffic devices in your dataset (e.g., iPhone X, Android 10) as your baseline to ensure a good experience for the widest possible audience. This approach focuses on the reality of your user base and prevents a small, but still relevant, group from having a poor experience.

By using this approach, you can take full advantage of the improved capabilities of modern devices. Faster CPUs and higher RAM on newer phones allow for quicker processing of complex JavaScript and UI rendering, leading to better LCP and INP values. This means your ratings and reviews content can appear faster, enhancing consumer trust and driving conversions without the compromises required by a legacy benchmark.

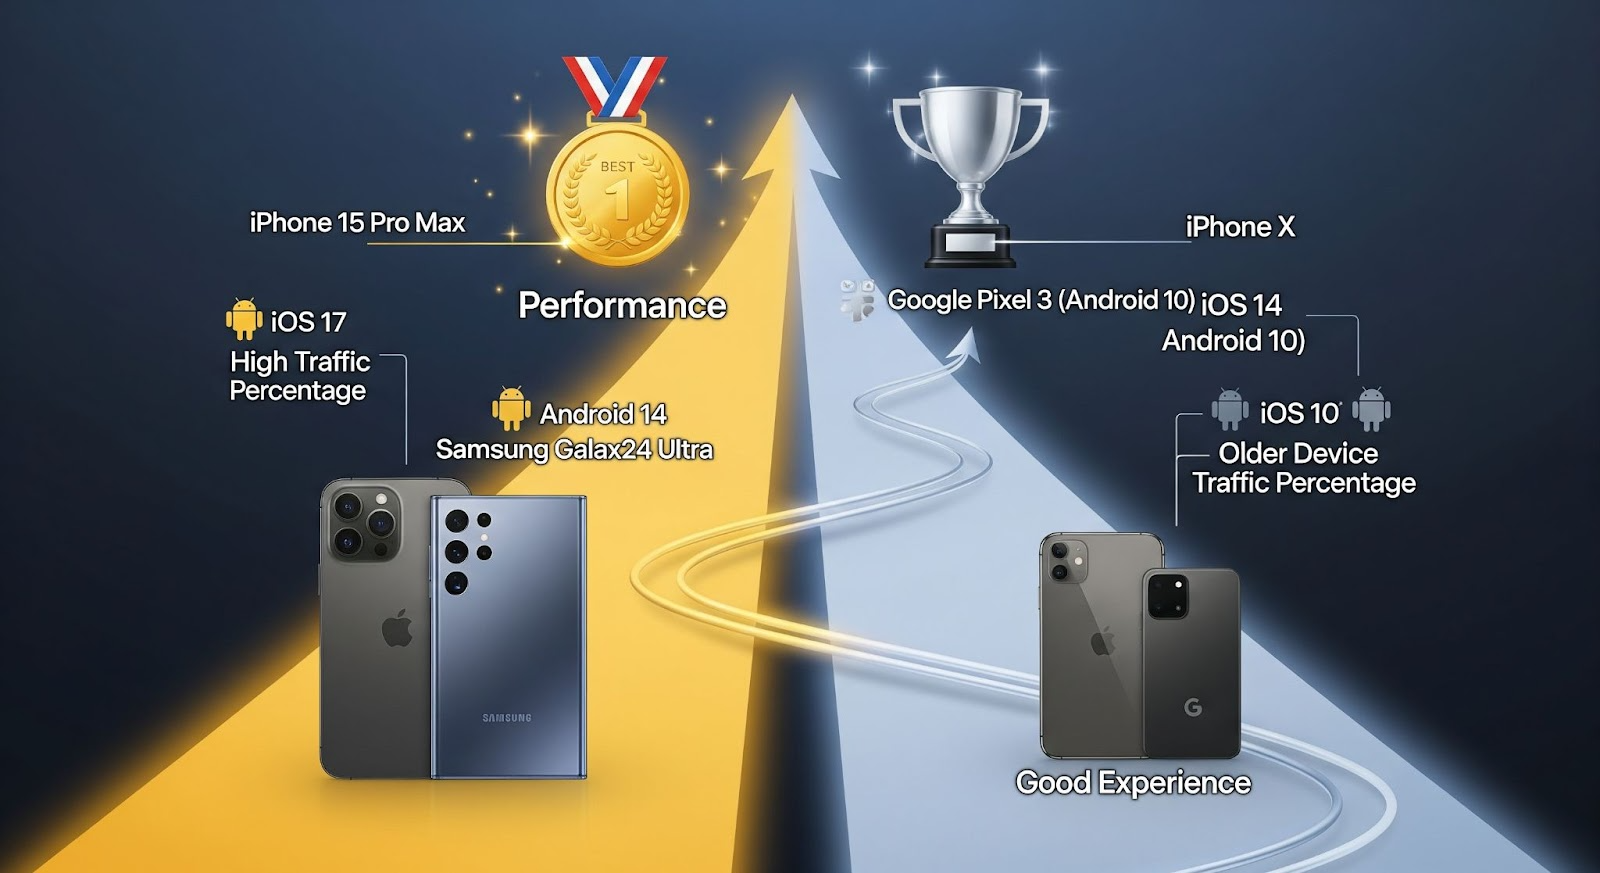
Infographics – Suggested benchmarking approaches

Data from BFCM 2024 traffic

Black Friday and Cyber Monday (BFCM) represent the peak traffic period for eCommerce, significantly boosting sales across all consumer segments. BFCM 2024 witnessed unprecedented mobile traffic, with industry reports indicating that mobile devices accounted for over 70% of all e-commerce traffic during this period. This underscores the critical importance of mobile-first optimization strategies.

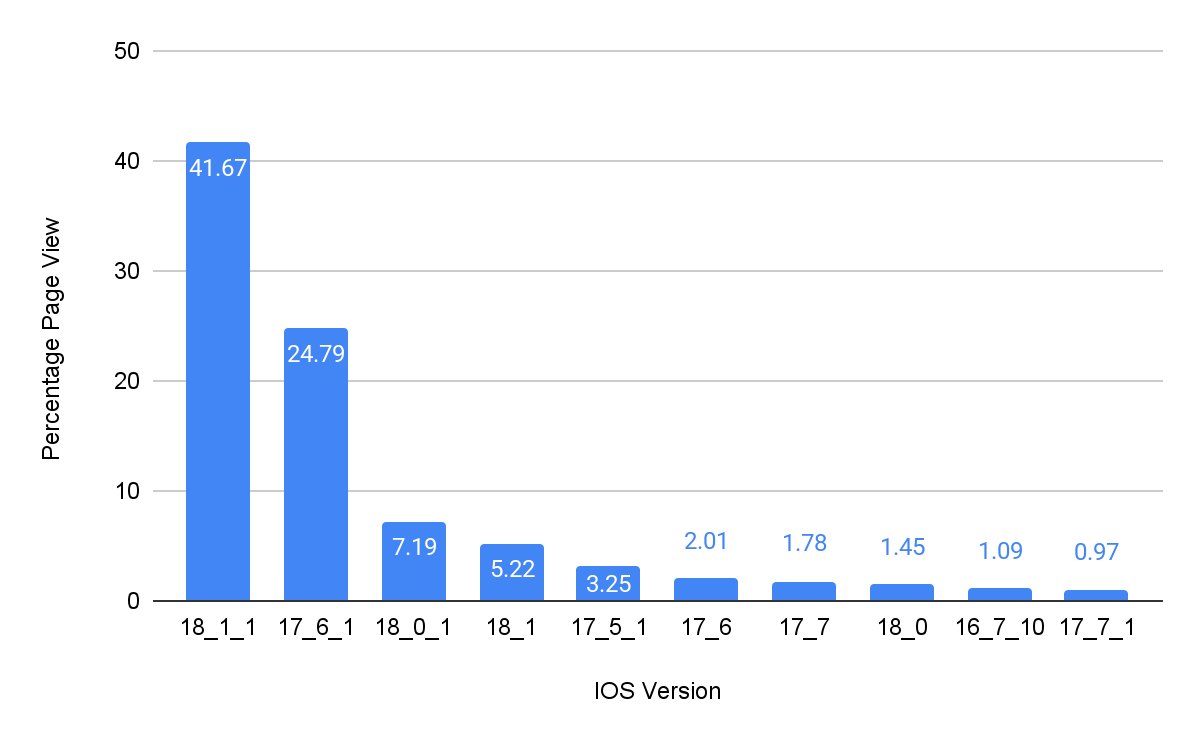
Data of iOS versions during the BFCM 2024

Here’s a look at iOS version data, showing how customers using Bazaarvoice clients check out Ratings & Reviews and other related stuff from us.

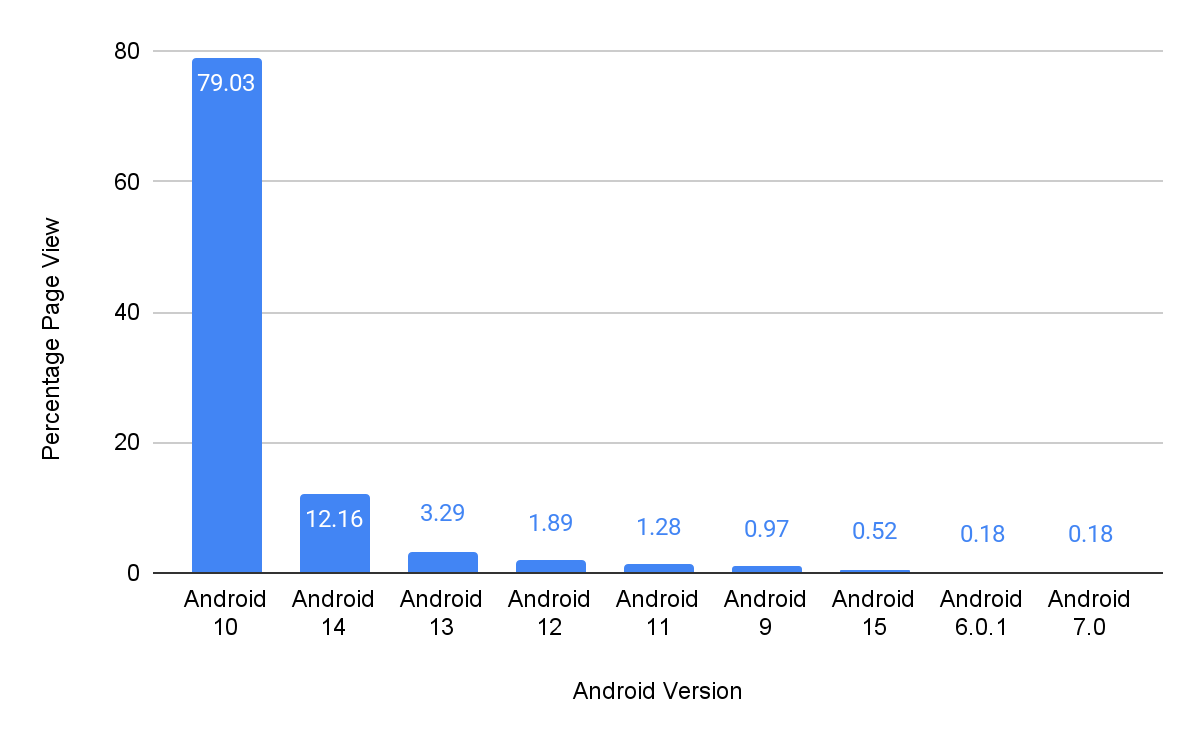
Data of Android versions during the BFCM 2024

This data details Android OS versions used by customers accessing Bazaarvoice Ratings & Reviews, and other related content.

The Bazaarvoice Baseline: A Long-Tail Approach

Given this data-driven reality, Bazaarvoice is officially adopting a new, more comprehensive baseline for measuring and publishing Core Web Vitals (CWV) performance for our Hosted Display component. This strategic shift is driven by a deep understanding of user behavior and the diverse range of devices used to access our clients’ sites. Our new standard will be meticulously based on the oldest high-traffic device, which robustly represents the “long-tail” of your customer base—those users who might not have the latest flagship smartphones or the most powerful internet connections.

By setting this critical benchmark on a device like the iPhone X or an Android 10 phone, we achieve several key objectives. Firstly, we ensure that our performance optimizations are robust enough to provide a truly great and consistent experience for a significant and often underserved portion of your users. This approach directly addresses the real-world conditions many customers face, preventing a fragmented experience where only those with top-tier devices enjoy optimal performance. Secondly, and critically, this also means that all newer, more powerful devices will naturally exceed this rigorous benchmark, delivering an even faster, smoother, and more delightful experience to the vast majority of your audience. This tiered benefit ensures that while we elevate the experience for all, the most powerful devices continue to perform at their peak.

This strategy allows us to provide a transparent, objective, and highly actionable measure of performance that directly correlates with the actual user experience your customers are having, rather than a theoretical or idealized one based solely on cutting-edge hardware. It moves beyond abstract metrics to focus on tangible improvements that impact real people. By focusing on the foundational experience for the “long-tail,” we establish a rising tide that lifts all boats, guaranteeing a superior and more equitable browsing experience across the entire spectrum of your audience. This commitment to real-world performance underscores Bazaarvoice’s dedication to optimizing the user journey for every customer, irrespective of their device’s age or capabilities.

CWV metrics with new Baseline devices

Below are the CWV metrics for the Hosted Display application version as on Aug 13, 2025 and tested with different devices using the LTE network for the devices.

It includes the following fields:

  • Mobile Device: Specifies the type of mobile device used for testing (e.g., Google Pixel, iPhone X).
  • CWV Metrics: Indicates the specific Core Web Vital metric being measured (e.g., LCP – Largest Contentful Paint, INP – Interaction to Next Paint, CLS – Cumulative Layout Shift, TBT – Total Blocking Time).
  • First View (in seconds): Shows the performance metric for the initial page load.
  • Repeat View (in seconds): Shows the performance metric for subsequent page loads.

Below is the CWV metrics color coding to benchmark performance:

The table’s purpose is to demonstrate the performance of the Hosted Display application on different devices under specific network conditions, providing data for a new benchmarking strategy based on real-world traffic

Mobile DeviceCWV MetricsFirst View (in seconds)Repeat View (in seconds)
Google Pixel
(Low end device by BV traffic)
LCP2.51.7
INPNANA
CLS00
TBT0.13100.113
Google Pixel 4XL
(High end device by BV traffic)
LCP1.600.9
INPNANA
CLS00
TBT0.0160
iPhone X
(Low end device by BV traffic)
LCP1.290.69
INPNANA
CLS0.0060.006
TBT00
iPhone 15
(High end device by BV traffic)
LCP1.310.66
INPNANA
CLS0.0060.006
TBT00

Taking Control of Your E-commerce Performance

The era of a single, universal device benchmark is over. The global market has shifted, and so should your performance strategy. Research from sources like IDC and Opensignal confirm that users are upgrading to more powerful devices with access to faster networks at a rapid pace [6, 7].

Your performance optimization efforts should be an investment in the experience of your actual customers, not an abstract user from years past. By using your own traffic data to create a custom benchmarking strategy, you can ensure that every millisecond of optimization translates into a better user experience, higher engagement, and a more robust ROI for your business.

Citations:

  1. Bazaarvoice Hosted Display CWV Performance Testing Methodology: Bazaarvoice Hosted Display CWV Performance Testing Methodology
  2. GSMA Intelligence. (2024). The Mobile Economy 2024. Retrieved from https://www.gsma.com/solutions-and-impact/connectivity-for-good/mobile-economy/the-mobile-economy-2024/
  3. Dynamic Yield. (2025). Device usage statistics for eCommerce. Retrieved from https://marketing.dynamicyield.com/benchmarks/device-usage/
  4. Oyelabs. (2025). 2025 Mobile Commerce: Key Statistics and Trends to Follow. Retrieved from https://oyelabs.com/mobile-commerce-key-statistics-and-trends-to-follow/
  5. MobiLoud. (2025). Android vs iOS Market Share: Most Popular Mobile OS in 2024. Retrieved from https://www.mobiloud.com/blog/android-vs-ios-market-share
  6. Backlinko. (2025). iPhone vs. Android User & Revenue Statistics (2025). Retrieved from https://backlinko.com/iphone-vs-android-statistics
  7. IDC. (2024). Worldwide Smartphone Market Forecast to Grow 6.2% in 2024. Retrieved from https://my.idc.com/getdoc.jsp?containerId=prUS52757624
  8. Opensignal. (2024). Global Network Excellence Index. Retrieved from https://www.opensignal.com/global-network-excellence-index

Optimizing Third-Party Content Delivery: A Deep Dive into Preconnect’s Performance and Call Cost Implications

As software engineers, we’re constantly striving to deliver the fastest, most seamless web experiences possible. In today’s interconnected digital landscape, that often means integrating a variety of third-party content – from analytics and ads to rich user-generated content like ratings and reviews. While these integrations are essential, they introduce a common performance challenge: network latency. Every time your browser needs to fetch something from a new domain, it incurs a series of network round-trips for DNS resolution, TCP handshake, and, for secure connections, TLS negotiation.1 These cumulative delays can significantly impact your page’s load time and, critically, your users’ perception of speed.

This is where resource hints become invaluable. These simple HTML <link> elements act as early signals to the browser, proactively informing it about resources that are likely to be needed soon.3 By leveraging these hints, we can instruct the browser to perform speculative network operations in the background, effectively masking latency and improving perceived performance.

For a company like Bazaarvoice, which delivers embedded ratings and reviews across a vast network of retail and brand websites, performance isn’t just an optimization; it’s a core business driver. Our content is a critical touchpoint for user engagement on product pages. The primary performance bottleneck for a website integrating Bazaarvoice content isn’t typically the payload size, but the overhead of initiating communication with our servers.This initial connection setup is crucial for optimizing Largest Contentful Paint (LCP), a key metric within Core Web Vitals, which measures page loading performance and influences user perception of speed. Preconnect is precisely designed to address this, allowing the browser to establish connections preemptively so our content loads and renders significantly faster, directly boosting the host site’s performance.4

This article explores Bazaarvoice’s strategy for optimizing third-party content delivery. It demonstrates how preconnect can significantly enhance frontend performance while incurring minimal to no additional call costs, addressing often-ignored backend implications.

Resource Hints: Your Browser’s Proactive Network Assistant

Understanding the nuances of various resource hints is crucial for their effective application. Each hint serves a distinct purpose, operating at different stages of the network request lifecycle and offering varying levels of performance gain versus resource overhead.

  • dns-prefetch: A subtle hint, this directive tells the browser to resolve a domain’s DNS before requesting resources 6. Useful for future cross-origin access, it’s a low-overhead optimization that primarily reduces DNS lookup latency.
    • Usage: <link rel="dns-prefetch" href="https://api.bazaarvoice.com">
  • preconnect: This hint goes a step further than dns-prefetch. It instructs the browser to proactively establish a full connection—encompassing DNS resolution, TCP handshake, and for HTTPS, the TLS negotiation—to a critical third-party origin.3 This pre-establishment significantly reduces the cumulative round-trip latency that would otherwise occur when the actual resource is requested.
    • The Full Network Handshake:
      • DNS Lookup: Resolves the domain name to its IP address.1
      • TCP Handshake: The three-way handshake (SYN, SYN-ACK, ACK) to set up a reliable connection.
      • TLS Negotiation: For HTTPS, the complex exchange of cryptographic keys and certificates to establish an encrypted channel.1
    • crossorigin Attribute: For resources loaded in anonymous mode (e.g., web fonts) or those requiring Cross-Origin Resource Sharing (CORS), the crossorigin attribute must be set on the <link rel="preconnect"> tag. Without it, the browser might only perform the DNS lookup, negating the TCP and TLS benefits.6
    • Important Distinction: It’s crucial to distinguish rel="preconnect" (a browser directive to pre-establish a connection for future HTTP/HTTPS requests) from the HTTP CONNECT method. The HTTP CONNECT method is used for creating TCP tunnels through proxies (e.g., for secure communication over HTTP proxies or VPN-like scenarios). While both involve connection setup, their purposes and mechanisms are distinct.
    • Usage: <link rel="preconnect" href="https://api.bazaarvoice.com" crossorigin>3
  • preload: A high-priority instruction for the browser to fetch and cache resources (like scripts or styles) essential for the current page’s rendering, even if discovered late.9 It initiates an early fetch, unlike preconnect which only establishes a connection. Requires the as attribute for resource type10.
    • Usage: <link rel="preload" href="styles.css" as="style">3.
  • prefetch: This browser hint suggests that a resource may be required for future navigations or interactions.1 It’s a speculative fetch designed to accelerate subsequent user journeys (e.g., prefetching the next page in a multi-step form). Resources are fetched and stored in the browser’s cache, ideally during idle periods when network resources are not under contention.14
    • Usage: <link rel="prefetch" href="reviews.html">13
  • prerender: The most aggressive resource hint. It instructs the browser to not only fetch but also execute an entire page in the background.1 If the user then navigates to that page, it can appear almost instantaneously. Due to its high resource consumption (bandwidth, CPU, memory), it’s often deprecated or used with extreme caution.1

Here’s a quick comparison of these hints:

Hint TypePurposeNetwork Stages CoveredOverhead/RiskOptimal Use Case
dns-prefetchResolve domain names earlyDNSMinimalMany cross-origin domains, non-critical
preconnectEstablish full connection earlyDNS, TCP, TLSClient CPU, minor bandwidth for TLS certsCritical cross-origin domains (1-3)
preloadFetch critical resource for current pageDNS, TCP, TLS, Data FetchCan disrupt browser priorities if misusedCritical resources needed early in render
prefetchSpeculatively fetch resource for future navigationDNS, TCP, TLS, Data FetchBandwidth waste if unused, skewed analyticsResources for likely next page/interaction
Comparison for Resource hints

The Preconnect Advantage: Accelerating Third-Party Content Delivery

Preconnect directly tackles the significant latency introduced by the multi-stage network handshake. By completing DNS resolution, TCP handshake, and TLS negotiation preemptively, it effectively removes several critical round-trips from the critical rendering path when the actual resource is eventually requested.2 This pre-optimization can lead to measurable and substantial improvements in key performance metrics, including Largest Contentful Paint (LCP).10 This is particularly impactful if the third-party content, such as Bazaarvoice review widgets or critical scripts, is a significant component of the LCP element or is essential for the initial visual completeness of the page.

For Bazaarvoice, which serves Ratings and Reviews on product detail and listing pages across various websites, preconnect is a perfect solution. Our Display service retrieves content (static and dynamic) from apps.bazaarvoice.com, which is always a third-party domain to the client website. While our Display component is designed for lazy loading, the initial DNS lookup and TCP/SSL connection still consume valuable time, especially on mobile 3G networks.

By adding a preconnect hint for apps.bazaarvoice.com, the browser can proactively prepare the DNS lookup and SSL socket after the necessary TLS handshake. This means that by the time our Display component initiates its call to the backend, the underlying network connection is already “warm” and ready. This approach has demonstrably reduced the Largest Contentful Paint (LCP) value by 200-600ms, with the exact improvement varying by network capacity. This directly improves the Core Web Vitals metrics (LCP) for our Display component, making the reviews appear much faster for end-users.

Backend Implications: The (No) Count and (Low) Cost of preconnect

This is where we address the critical, often overlooked, aspect of preconnect: its influence on backend infrastructure and associated costs. While preconnect is a frontend hint, its strategic implementation requires understanding its server-side footprint.

When a browser honors a preconnect hint, it opens a TCP socket and initiates TLS negotiation. A key concern is what happens if this preconnected origin isn’t actually utilized within a reasonable timeframe. For instance, Chrome will automatically close an idle preconnected connection if it remains unused for approximately 10 seconds.14 In such cases, the resources expended on establishing that connection—including client-side CPU cycles and the minimal network bandwidth consumed by the handshake packets (around 3KB per connection for TLS certificates 14)—are effectively wasted. Preconnecting to too many origins can accumulate unnecessary CPU load on the user’s device and potentially compete with more critical assets for bandwidth.

From a backend perspective, every incoming connection, even just for a handshake (DNS, TCP, TLS), consumes some server-side resources: CPU cycles for TLS termination, memory to maintain connection context, and network capacity to handle handshake packets. While the resource consumption for an individual handshake is minuscule, the aggregate impact at scale can become considerable.

API Gateway and CDN Considerations: Pricing Models and Our Findings

The impact of preconnect on API Gateway and CDN costs requires a nuanced understanding of their billing models.

  • API Gateways (e.g., AWS API Gateway, Google Apigee): These services primarily charge based on the number of “requests” processed (e.g., per million API calls).15 A preconnect operation itself does not constitute a “request” in the billing sense, as it’s a network handshake intended to prepare for a future request, not an actual data or API call that hits a backend endpoint. Therefore, preconnect operations do not directly incur per-request charges on these models.
  • Bazaarvoice’s Own Testing: This is a crucial finding for us. We initiated preconnect calls from the browser and checked the usage metrics of APIGEE. Our analysis confirmed that these CONNECT calls were not counted or charged as API calls.17 This directly addresses the common concern about backend billing for preconnect operations.
  • Data Transfer Fees: The small amount of data exchanged during the TLS certificate negotiation (approx. 3KB) would count towards data transfer fees.14 While negligible per preconnect, it is a non-zero component at massive scale.
  • CDNs (Content Delivery Networks): CDNs typically base their pricing on data transfer volume and the number of requests served. preconnect itself does not involve the transfer of content, so it does not directly incur content delivery costs. Similar to API Gateways, the TLS handshake data would contribute minimally to CDN metrics. The primary benefit of preconnect for CDN-served assets is the acceleration of content delivery after the connection is established.

The Bottom Line on Cost: preconnect operations incur minimal direct financial cost in terms of “requests” on typical API Gateway or CDN billing models, as they primarily involve connection setup rather than full data requests. They do consume a small amount of bandwidth for TLS certificates and some server-side CPU/memory for managing the connection. The most significant “cost” associated with preconnect is the potential for wasted client and server resources if the established connection is ultimately unused.

Strategic Implementation: Bazaarvoice’s Approach and Your Takeaways

Effective preconnect implementation demands a strategic approach. It involves careful identification of critical origins and balancing performance gains with backend efficiency.

For Bazaarvoice, the strategy was clear: target the domains serving our core content. This primarily means apps.bazaarvoice.com, which delivers our Display service. Since this domain is always a third-party origin for our clients, it’s a prime candidate for preconnect.

Our Display component is designed to lazy-load, but the initial DNS lookup and TCP/SSL connection still consume significant time. By adding a preconnect hint for apps.bazaarvoice.com, client browsers can proactively perform the DNS lookup and establish the SSL socket, including the necessary TLS handshake, before the Display component even starts requesting data.

The Results: Our implementation of preconnect for *.bazaarvoice.com has demonstrably reduced the Largest Contentful Paint (LCP) value, depending on network capacity. This directly improved the Core Web Vitals metrics for our Display component.

Crucially, our internal testing with APIGEE confirmed that these preconnect calls were not counted or charged as API calls. This validates the “no count, low cost” aspect for backend services, proving that you can achieve significant frontend performance gains without unexpectedly inflating your API Gateway bill.

Your Actionable Takeaways:

  • Identify Critical Origins: Don’t preconnect everything. Focus on the 1-3 most critical cross-origin domains that are essential for your page’s initial render or LCP. Over-preconnecting can be counterproductive.4
  • Use crossorigin: If your preconnected resource uses CORS or is loaded anonymously (like fonts), always include the crossorigin attribute.6
  • Connect Promptly: Ensure actual resource calls occur within 10 seconds of preconnect. Connections idle for longer than this timeframe will be lost, requiring a new TCP handshake, though DNS resolution will remain cached based on its TTL.
  • Monitor and Iterate: Performance optimization is an ongoing process. Use tools like Lighthouse, WebPageTest, and Real User Monitoring (RUM) to track frontend metrics. Simultaneously, keep an eye on your backend: active connection counts, CPU utilization, and API Gateway logs. This holistic view helps ensure frontend optimizations don’t create new backend bottlenecks or unexpected costs.
  • Test for Cost: If you’re concerned about API Gateway or CDN costs, do your own small-scale tests, just like we did with APIGEE. Verify how preconnect operations are logged and billed by your specific providers.

Infographics

Conclusion

Preconnect is a powerful, yet nuanced, tool in the web performance toolkit. Its primary strength lies in its ability to significantly improve the perceived performance of web pages by proactively accelerating the loading of critical cross-origin resources. By completing DNS resolution, TCP handshake, and TLS negotiation preemptively, it ensures that when the actual resource is needed, the connection is already warm and ready, reducing critical path delays. 

It is crucial that the actual resource calls occur within 10 seconds of the preconnect being established. Exceeding this timeframe will result in the loss of the socket and necessitate another TCP handshake. Nevertheless, the DNS lookup time will be reduced due to DNS resolution, which is governed by the DNS TTL.

While preconnect itself does not directly incur significant monetary costs in terms of “requests” on typical backend API Gateway billing models (as Bazaarvoice’s APIGEE testing confirmed), it’s not entirely “cost-free.” It consumes client-side CPU resources, minor network bandwidth, and requires server-side resources for connection management. Overuse or misapplication can lead to wasted resources.

Strategic implementation is paramount. By identifying critical origins and diligently monitoring both frontend performance and backend resource consumption, you can leverage preconnect to deliver faster, more responsive web experiences to your users, without incurring unexpected backend costs. It’s about smart, targeted optimization that benefits everyone.

Works cited

  1. Resource Hints – W3C, accessed July 15, 2025, https://www.w3.org/TR/2023/DISC-resource-hints-20230314/
  2. Preconnect – KeyCDN Support, accessed July 15, 2025, https://www.keycdn.com/support/preconnect
  3. DNS Prefetch vs. Preconnect: Speeding Up Your Web Pages – DhiWise, accessed July 15, 2025, https://www.dhiwise.com/blog/design-converter/dns-prefetch-vs-preconnect-speeding-up-your-web-pages
  4. rel=”preconnect” – HTML | MDN, accessed July 15, 2025, https://developer.mozilla.org/en-US/docs/Web/HTML/Reference/Attributes/rel/preconnect
  5. Optimize Largest Contentful Paint | Articles – web.dev, accessed July 15, 2025, https://web.dev/articles/optimize-lcp
  6. Using dns-prefetch – Performance – MDN Web Docs, accessed July 15, 2025, https://developer.mozilla.org/en-US/docs/Web/Performance/Guides/dns-prefetch
  7. DNS Prefetching – The Chromium Projects, accessed July 15, 2025, https://www.chromium.org/developers/design-documents/dns-prefetching/
  8. HTTP Request Method: CONNECT – Web Concepts, accessed July 15, 2025, https://webconcepts.info/concepts/http-method/CONNECT
  9. developer.mozilla.org, accessed July 15, 2025, https://developer.mozilla.org/en-US/docs/Web/HTML/Reference/Attributes/rel/preload#:~:text=The%20preload%20value%20of%20the,main%20rendering%20machinery%20kicks%20in.
  10. rel=preload – HTML | MDN, accessed July 15, 2025, https://developer.mozilla.org/en-US/docs/Web/HTML/Reference/Attributes/rel/preload
  11. Browser Resource Hints: preload, prefetch, and preconnect – DebugBear, accessed July 15, 2025, https://www.debugbear.com/blog/resource-hints-rel-preload-prefetch-preconnect
  12. Prefetch – Glossary – MDN Web Docs, accessed July 15, 2025, https://developer.mozilla.org/en-US/docs/Glossary/Prefetch
  13. Exploring the usage of prefetch headers – Lion Ralfs, accessed July 15, 2025, https://lionralfs.dev/blog/exploring-the-usage-of-prefetch-headers/
  14. Preload, Preconnect, Prefetch: Improve Your Site’s Performance with Resource Hints, accessed July 15, 2025, https://nitropack.io/blog/post/resource-hints-performance-optimization
  15. AWS API Gateway Pricing Explained, accessed July 15, 2025, https://awsforengineers.com/blog/aws-api-gateway-pricing-explained/
  16. Amazon API Gateway Pricing | API Management | Amazon Web Services, accessed July 15, 2025, https://aws.amazon.com/api-gateway/pricing/
  17. Monitor Pay-as-you-go billing | Apigee – Google Cloud, accessed July 15, 2025, https://cloud.google.com/apigee/docs/api-platform/reference/pay-as-you-go-updated-billing

Looking Good While Testing: Automated Testing With a Visual Regression Service

A lot of (virtual) ink has been spilled on this blog about automated testing (no, really). This post is another in a series of dives into different automated testing tools and how you can use them to deliver a better, higher-quality web application.

Here, we’re going to focus on tools and services specific to ‘visual regression testing‘ – specifically cross-browser visual testing of an application front end.

What?

By visual regression testing, we mean regression testing applied specifically to an app’s appearance may have changed across browsers or over time as opposed to functional behavior.

Why?

One of the most common starting points in testing a web app is to simply fire up a given browser, navigate to the app in your testing environment, and note any discrepancy in appearance (“oh look, the login button is upside down. Who committed this!?”).

american_psycho

A spicy take on how to enforce code quality – we won’t be going here.


The strength of visual regression testing is that you’re testing the application against a very humanistic set of conditions (how does the application look to the end user versus how it should look). The drawback is that doing this is generally time consuming and tedious.  But that’s what we have automation for!

hamburger_ad_vs_reality

How our burger renders in Chrome vs how it renders in IE 11…

How?

A wise person once said, ‘In software automation, there is no such thing as a method call for “if != ugly, return true”‘.

For the most part – this statement is true. There really isn’t a ‘silver bullet’ for the software automation problem of fully automating testing the appearance of your web application across a given browser support matrix.  At least not with some caveats.

The methods and tools for doing so can run afoul of at least one of the following:

  • They’re Expensive (in terms of time, money or both)
  • They’re Fragile (tests emit false negatives, can be unreliable)
  • They’re Limited (covers only a subset of supported browsers)

faberge_egg

Sure, you can support delicate tools. Just keep in mind the total cost.


Tools

We’re going to show how you can quickly set up a set of tools using WebdriverIO, some simple JavaScript test code and the visual-regression-service module to create snapshots of your app front end and perform a test against its look and feel.

Setup

Assuming you already have a web app ready for testing in your choice of environment (hopefully not in production) and that you are familiar with NodeJS, let’s get down to writing our testing solution:

interesting_man_tests_code

This meme is so old, I can’t even…


1. From the command line, create a new project directory and do the following in order:

  • ‘npm init’ (follow the initialization prompts – feel free to use the defaults and update them later)
  • ‘npm install –save-dev webdriverio’
  • ‘npm install –save-dev wdio-visual-regression-service’
  • ‘npm install –save-dev chai’

2. Once you’ve finished installing your modules, you’ll need to configure your instance of WebdriverIO. You can do this manually by creating the file ‘wdio.conf.js’ and placing it in your project root (refer to the WebdriverIO developers guide on what to include in your configuration file) or you can use the wdio automated configuration script.

3. To quickly configure your tools, kick off the automated configuration script by running ‘npm run wdio’ from your project root directory.  During the configuration process, be sure to select the following (or include this in your wdio.conf.js file if you’re setting things up manually):

  • Under frameworks, be sure to enable Mocha (we’ll use this to handle things like assertions)
  • Under services be sure to enable the following:
    • visual-regression
    • Browserstack (we’ll leverage Browserstack to handle all our browser requests from WebdriverIO)

Note that in this case, we won’t install the selenium standalone service or any local testing binaries like Chromedriver. The purpose of this exercise is to quickly package together some tools with a very small footprint that can handle some high-level regression testing of any given web app front end.

Once you have completed the configuration script, you should have a wdio.conf.js file in your project configured to use WebdriverIO and the visual-regression service.

Next, we need to create a test.

Writing a Test

First, make a directory within your project’s main source called tests/. Within that directory, create a file called homepage.js.

Set the contents of the file to the following:

describe('home page', () => {
  beforeEach(function () {
  browser.url('/');
});

it('should look as expected', () => {
browser.checkElement('#header');
});
});

That’s it. Within the single test function, we are calling a method from the visual-regression service, ‘checkElement()’. In our code, we are providing the ID, ‘header’ as an argument but you should replace this argument with the ID or CSS selector of a container element on the page you wish to check.

When executed, WebdriverIO will open the root URL path it is provided for our web application then will execute its check element comparison operation. This will generate a series of reference screen shots of the application. The regression service will then generate screen shots of the app in each browser it is configured to test with and provide a delta between these screens and the reference image(s).

A More Complex Test:

You may have a need to articulate part of your web application before you wish to execute your visual regression test. You also may need to execute the checkElement() function multiple times with multiple arguments to fully vet your app front end’s look and feel in this manner.

Fortunately, since we are simply inheriting the visual regression service’s operations through WebdriverIO, we can combine WebriverIO-based method calls within our tests to manipulate and verify our application:

describe('home page', () => {
  beforeEach(function () {
  browser.url('/');
  });

  it('should look as expected', () => {
    browser.waitForVisible('#header');
    browser.checkElement('#header');
  });

  it('should look normal after I click the button, () => {
    browser.waitForVisible('.big_button');
    browser.click('.big_button');
    browser.waitForVisible('#main_content');
    browser.checkElement('#main_content');
  });

  it('should have a footer that looks normal too, () => {
    browser.scroll('#footer');
    browser.checkElement('#footer');
  });
});

Broad vs. Narrow Focus:

One of several factors that can add to the fragility of a visual test like this is attempting to account for minor changes in your visual elements. This can be a lot to bite off and chew at once.

Attempting to check the content of a large and heavily populated container (e.g. the body tag) is likely going to contain so many possible variations across browsers that your test will always throw an exception. Conversely, attempting to narrow your tests’ focus to something very marginal (e.g. selecting a single instance of a single button) may never be touched by code implemented by front end developers and thus, you may be missing crucial changes to your app UI.

flight_search_results

This is waaay too much to test at once.


The visual-regression service’s magic is in that it allows you to target testing to specific areas of a given web page or path within your app – based on web selectors that can be parsed by Webdriver.

price_link

And this is too little…


Ideally, you should be choosing web selectors with a scope of content that is not too large nor too small but in between. A test that focuses on comparing content of a specific div tag that contains 3-4 widgets will likely deliver much more value than one that focuses on the selector of a single button or a div that contains 30 widgets or assorted web elements.

Alternately, some of your app front end may be generated by templating or scaffolding that never received updates and is siloed away from code that receives frequent changes from your team. In this case, marshalling tests around these aspects may result in a lot of misspent time.

menu_bar

But this is just about right!


Choose your area of focus accordingly.

Back to the Config at Hand:

Before we run our tests, let’s make a few updates to our config file to make sure we are ready to roll with our initial homepage verification script.

First, we will need to add some helper functions to facilitate screenshot management. At the very top of the config file, add the following code block:

var path = require('path');
var VisualRegressionCompare = require('wdio-visual-regression-service/compare');

function getScreenshotName(basePath) {
  return function(context) {
    var type = context.type;
    var testName = context.test.title;
    var browserVersion = parseInt(context.browser.version, 10);
    var browserName = context.browser.name;
    var browserViewport = context.meta.viewport;
    var browserWidth = browserViewport.width;
    var browserHeight = browserViewport.height;
 
    return path.join(basePath, `${testName}_${browserName}_v${browserVersion}_${browserWidth}x${browserHeight}.png`);
  };
}

This function will be utilized to build the paths for our various screen shots we will be taking during the test.

As stated previously, we are leveraging Browserstack with this example to minimize the amount of code we need to ship (given we would like to pull this project in as a resource in a Jenkins task) while allowing us greater flexibility in which browsers we can test with. To do this, we need to make sure a few changes in our config file are in place.

Note that if you are using a different browser provisioning services (SauceLabs, Webdriver’s grid implementation), see WebdriverIO’s online documentation for how to set you wdio configuration for your respective service here).

Open your wdio.conf.js file and make sure this block of code is present:

user: process.env.BSTACK_USERNAME,
key: process.env.BSTACK_KEY,
host: 'hub.browserstack.com',
port: 80,

This allows us to pass our browser stack authentication information into our wdio script via the command line.

Next, let’s set up which browsers we wish to test with. This is also done within our wdio config file under the ‘capabilities’ object. Here’s an example:

capabilities: [
{
  browserName: 'chrome',
  os: 'Windows',
  project: 'My Project - Chrome',
  'browserstack.local': false,
},
{
  browserName: 'firefox',
  os: 'Windows',
  project: 'My Project - Firefox',
  'browserstack.local': false,
},
{
  browserName: 'internet explorer',
  browser_version: 11,
  project: 'My Project - IE 11',
  'browserstack.local': false,
},
],

Where to Put the Screens:

While we are here, be sure you have set up your config file to specifically point to where you wish to have your screen shots copied to. The visual-regression service will want to know the paths to 4 types of screenshots it will generate and manage:

lots_a_screens

Yup… Too many screens


References: This directory will contain the reference images the visual-regression service will generate on its initial run. This will be what our subsequent screen shots will be compared against.

Screens: This directory will contain the screen shots generated per browser type/view by tests.

Errors: If a given test fails, an image will be captured of the app at the point of failure and stored here.

Diffs: If there is a given comparison performed by the visual-regression service between an element from a browser execution and the reference images which results in a discrepancy, a ‘heat-map’ image of the difference will be capture and stored here. Consider the content of this directory to be your test exceptions.

Things Get Fuzzy Here:

fozzy

Fuzzy… Not Fozzy


Finally, before kicking off our tests, we need to enable our visual-regression service instance within our wdio.conf.js file. This is done by adding a block of code to our config file that instructs the service on how to behave. Here is an example of the code block taken from the WebdriverIO developer guide:

visualRegression: {
  compare: new VisualRegressionCompare.LocalCompare({
    referenceName: getScreenshotName(path.join(process.cwd(), 'screenshots/reference')),
    screenshotName: getScreenshotName(path.join(process.cwd(), 'screenshots/screen')),
    diffName: getScreenshotName(path.join(process.cwd(), 'screenshots/diff')),
    misMatchTolerance: 0.20,
  }),
  viewportChangePause: 300,
  viewports: [{ width: 320, height: 480 }, { width: 480, height: 320 }, { width: 1024, height: 768 }],
  orientations: ['portrait'],
},

Place this code block within the ‘services’ object in your file and edit it as needed. Pay attention to the following attributes and adjust them based on your testing needs:

‘viewports’:
This is a JSON object that provides width/height pairs to test the application at. This is very handy if you have an app that has specific responsive design constraints. For each pair, the test will be executed per browser – resizing the browser for each set of dimensions.

‘orientations’: This allows you to configure the tests to execute using portrait and/or landscape view if you happen to be testing in a mobile browser (default orientation is portrait).

‘viewportChangePause’: This value pauses the test in milliseconds at each point the service is instructed to change viewport sizes. You may need to throttle this depending on app performance across browsers.

‘mismatchTolerance’: Arguably the most important setting there. This floating-point value defines the ‘fuzzy factor’ which the service will use to determine at what point a visual difference between references and screen shots should fail. The default value of 0.10 indicates that a diff will be generated if a given screen shot differs, per pixel from the reference by 10% or more. The greater the value the greater the tolerance.

Once you’ve finished modifying your config file, lets execute a test.

Running Your Tests:

Provided your config file is set to point to the root of where your test files are located within the project, edit your package.json file and modify the ‘test’ descriptor in the scripts portion of the file.

Set it to the following:

‘./node_modules/.bin/wdio /wdio.desktop.conf.js’

To run your test, from the command line, do the following:

‘BSTACK_USERNAME= BSTACK_KEY= npm run test — –baseUrl=’

Now, just sit back and wait for the test results to roll in. If this is the first time you are executing these tests, the visual-regression service can fail while trying to capture initial references for various browsers via Browserstack. You may need to increase your test’s global timeout initially on the first run or simply re-run your tests in this case.

Reviewing Results:

If you’re used to your standard JUnit or Jest-style test execution output, you won’t necessarily similar test output here.

If there is a functional error present during a test (an object you are attempting to inspect isn’t available on screen) a standard Webdriver-based exception will be generated. However, outside of that, your tests will pass – even if a discrepancy is visually detected.

However, examine your screen shot folder structure we mentioned earlier. Note the number of files that have been generated. Open a few of them to view what has been capture through IE 11 vs. Chrome while testing through Browserstack.

Note that the files have names appended to them descriptive of the browser and viewport dimensions they correspond to.

example1

Example of a screen shot from a specific browser


Make note if the ‘Diff’ directory has been generated. If so, examine its contents. These are your test results – specifically, your test failures.

example2

Example of a diff’ed image


There are plenty of other options to explore with this basic set of tooling we’ve set up here. However, we’re going to pause here and bask in the awesomeness of being able to perform this level of browser testing with just 5-10 lines of code.

Is there More?

This post really just scratches the surface of what you can do with a set of visual regression test tools.  There are many more options to use these tools such as enabling mobile testing, improving error handling and mating this with your build tools and services.

We hope to cover these topics in a bit more depth in a later post.   For now, if you’re looking for additional reading, feel free to check out a few other related posts on visual regression testing here, here and here.

Creating a Realtime Reactive App for a collaborative domain

Sampling is a Bazaarvoice product that allows consumers to join communities and claim a limited amount of free products. In return consumers provide honest & authentic product reviews for the products they sample. Products are released to consumers for reviews at the same time. This causes a rush to claim these products. This is an example of a collaborative domain problem, where many users are trying to act on the same data (as discussed in Eric Evens book Domain-Driven design).


Bazaarvoice ran a 2 day hackathon twice a year. Employees are free to use this time to explore any technologies or ideas they are interested in. From our hackathon events Bazaarvoice has developed significant new features and products like our advertising platform and our personalization capabilities. For the Bazaarvoice 2017.2 hackathon, the Belfast team demonstrated a solution to this collaborative domain problem using near real-time state synchronisation.    

Bazaarvoice uses React + Redux for our front end web development. These libraries use the concepts of unidirectional data flows and immutable state management. These mean there is always one source of truth, the store, and there is no confusion about how to mutate the application state. Typically, we use the side effect library redux-thunk to synchronise state between server and client via HTTP API calls. The problem here is that, the synchronisation one way, it is not reactive. The client can tell the server to mutate state, but not vice versa. In a collaborative domain where the data is changing all the time, near-real time synchronisation is critical to ensure a good UX.

To solve this we decided to use Google’s Firebase platform. This solution provided many features that work seamlessly together, such as OAuth authentication, CDN hosting and Realtime DB. One important thing to note about Firebase, it’s a backend as a service, there was no backend code in this project.

The Realtime Database provides a pub/sub model on nodes of the database, this allows clients to be always up-to-date with the latest state. With Firebase Realtime DB there is an important concept not to be overlooked, data can only be accessed by it’s key (point query).

You can think of the database as a cloud-hosted JSON tree. Unlike a SQL database, there are no tables or records. When you add data to the JSON tree, it becomes a node in the existing JSON structure with an associated key (Reference)

Hackathon Goals

  1. Realtime configurable UI
  2. Realtime campaign administration and participation
  3. Live Demo to the whole company for both of the above

Realtime configurable UI

During the hackathon demo we demonstrated updating the app’s style and content via the administration portal, this would allow clients to style the app to suite their branding. These updates were pushed in real time to 50+ client devices from Belfast to Austin (4,608 miles away). 

The code to achieve this state synchronisation across clients was deceptively easy!

Given the nature of react, once a style config update was received, every device just ‘reacted’.


Realtime campaign administration and participation

In the demo, we added 40 products to the live campaign. This pushed 40 products to the admin screen and to the 50+ mobile app. Participants were then instructed to claim items.

Admin view

Member view

All members were authenticated via OAuth providers (Facebook, Github or Gmail).

To my surprise the live demo went without a hitch. I’m pleased to add…. my team won the hackathon for the ‘Technical’ category.

Conclusion

Firebase was a pleasure to work with, everything worked as expected and it performed brilliantly in the live demo….even on their free tier. The patterns used in Firebase are a little unconventional for the more orthodox engineers, but if your objective is rapid development, Firebase is unparalleled by any other platform. Firebase Realtime Database produced a great UX for running Sampling campaigns. While Firebase will not be used in the production product, it provided great context for discussions on the benefits and possibilities of realtime data synchronisation.

Some years ago, I would have maintained that web development was the wild west of software engineering; solutions were being developed without discipline and were lacking a solid framework to build on. It just didn’t seem to have any of the characteristics I would associate with good engineering practices. Fast forward to today, we now have a wealth of tools, libraries and techniques that make web development feel sane.

In recent years front-end developers have embraced concepts like unidirectional dataflows, immutability, pure functions (no hidden side-effects), asynchronous coding and concurrency over threading. Im curious to see if these same concepts gain popularity in backend development as Node.js continues to grow as backend language.

I want to be a UX Designer. Where do I start?

So many folks are wonder what they need to do to make a career of User Experience Design. As someone who interviewed many designers before, I’d say the only gate between you and a career in UX that really matters is your portfolio. Tech moves too fast and is too competitive to worry about tenure and experience and degrees. If you can bring it, you’re in!

That doesn’t mean school is a waste of time, though. Some of the best UX Design candidates I’ve interviewed came from Carnegie Mellon. We have a UX Research intern from the University of Texas on staff right now, and I’m blown away by her knowledge and talent. A good academic program can help you skip a lot of trial-by-fire and learning things the painful way. But most of all, a good academic program can feed you projects to use as samples in your portfolio. But goodness, choose your school carefully! I’ve also felt so bad for another candidate whose professors obviously had no idea what they were talking about.

Okay, so that portfolio… what should it demonstrate? What sorts of samples should it include? Well, that depends on what sort of UX Designer you want to be.

Below is a list of to-dos, but before you jump into your project, I strongly suggest forming a little product team. Your product team can be your your knitting circle, your best friend and next-best-friend, a fellow UX-hopeful. It doesn’t really matter so long as your team is comprised of humans.

I make this suggestion because I’ve observed that many UX students actually have projects under their belt, but they are mostly homework assignments they did solo. So they are going through the motions of producing journey maps, etc., but without really knowing why. So then they imagine to themselves that these deliverables are instructions. This is how UX Designers instruct engineers on what to do. Nope.

The truth is, deliverables like journey maps and persona charts and wireframes help other people instruct us. In real life, you’ll work with a team of engineers, and those folks must have opportunites to influence the design; otherwise, they won’t believe in it. And they won’t put their heart and soul into building it. And your mockups will look great, and the final product will be a mess of excuses.

So, if you can demonstrate to a hiring manager that you know how to collaborate, dang. You are ahead of the pack. So round up your jackass friends, come up with a fun team name, and…

If you want to be a UX Researcher,

Demonstrate product discovery.

  • Identify a market you want to affect, for example, people who walk their dogs.
  • Interview potential customers. Learn what they do, how they go about doing it, and how they feel at each step. (Look up “user journey” and “user experience map”)
  • Organize customers into categories based on their behaviors. (Look up “personas”)
  • Determine which persona(s) you can help the most.
  • Identify major pain points in their journey.
  • Brainstorm how you can solve these pain points with technology.

Demonstrate collaboration.

  • Allow the customers you interview to influence your understanding of the problem.
  • Invite others to help you identify pain points.
  • Invite others to help you brainstorms solutions.

If you want to be a UI designer,

Demonstrate ideation.

  • Brainstorm multiple ways to solve a problem
  • Choose the most compelling/feasible solution.
  • Sketch various ways that solution could be executed.
  • Pick the best concept and wireframe the most basic workflow. (Look up “hero flow”
  • Be aware of the assumptions your concept is based upon. Know that if you cannot validate them, you might need to go back to the drawing board. (Look up “product pivoting”)

Demonstrate collaboration.

  • Invite other people to help you brainstorm.
  • Let others vote on which concept to pursue.
  • Use a whiteboard to come up with the execution plan together.
  • Share your wireframes with potential customers and to see if the concept actually resonates with them.

If you want to be an IX Designer and Information Architect,

Demonstrate prototyping skill.

  • Build a prototype. The type of prototype depends on what you want to test. If you are trying to figure out how to organize the screens in your app, just labeled cards would work. (Look up “card sorting). If you want to test interactions, a coded version of the app with dummy content is nice, but clickable wireframes might be sufficient.
  • Plan your test. List the fundamental tasks people must be able to perform for your app to even make sense.
  • Correct the aspects of your design that throw people off or confuse people.

Demonstrate collaboration.

  • Allow customers to test-drive your prototype. (Look up “usability testing”)
  • Ask others to help you think of the best ways to revise your design based on the usability test results.

If you want to be a visual designer,

Demonstrate that you are paying attention.

  • Collect inspiration and media that you think your customers would like. Hit up dribbble and muzli and medium and behance and google image search and, and, and.
  • Organize all this media by mood: the pale ones, the punchy ones, the fun ones, whatever.
  • Pick the mood that matches the way you want people to feel when they use your app.
  • Style the wireframes with colors and graphics to match that mood.
  • Bonus: create a marketing page, a logo, business cards, and other graphic design assets that show big thinking.

Demonstrate collaboration.

  • Ask customers what media and inspiration they like. Let them help you collect materials.
  • Ask customers how your mood boards make them feel, in their own words.

Whew! That’s a lot of work! I know. At the very least, school buys you time to do all this stuff. And it’s totally okay to focus on just UX Research or just Visual Design and bill yourself as a specialist. Anyway, if you honestly enjoy UX Design, it will feel like playing. And remember to give your brain breaks once in a while. Go outside and ride your bike; it’ll help you keep your creative energy high.

Hope that helps, and good luck!

This article was originally published on Medium, “How to I break into UX Design?