
A while ago, I published a blog post that presented a tutorial overview of how to use Jmeter for load testing a typical RESTful API.
This post builds upon that original post with handy information on some updated reporting features of Jmeter as well a quick dive into how you can better propagate your load results in a continuous build environment (ala Jenkins).
if you’re completely new to Jmeter, please read my previous blog post, linked above before proceeding.
For those of you experienced with Jmeter (hopefully you already have some tests you’re wanting to deploy somewhere rather than let them live contentedly on your local machine), get ready because you’re gonna love this

It’s truly amazing the gifs you can find on the web.
Meet the New Jmeter, Same as the Old Jmeter (not really)
The previous load test tutorial covered setting up a load test from scratch using an early version of Jmeter. One of the benefits of using Jmeter, as outlined in the original post was that it has been around for quite a long time, is well known, stable and free. However, one of the major cons in using Jmeter is that its’ well, old – and has gone for a long while without major updates – especially when it comes to report generation.
Well, welcome to Jmeter 3! It still comes with that same, great, vintage 90s UI but now with a hoard a bug fixes, stability upgrades and – wait for it – native HTML report generation, wooo! Check out version 3’s documentation here:
Installation and Setup
So, let’s get down to it! You can find the latest build of Jmeter 3 here: https://jmeter.apache.org/download_jmeter.cgi
Steps to setting up Jmeter 3 locally are similar to the installation steps covered in my original blog post. Pre-installation requirements are the same:
- Java JDK (version 7 or later)
- Be sure your Java HOME local environment or path variables are set before execution.
Functionally, Jmeter 3 appears identical to older versions of the application but there are a lot of changes under the hood. I recommend unarchiving and installing Jmeter 3 in its own directory, separate from any previous version of Jmeter you may have previously installed.
Migrating your tests
If you’re following along with this tutorial and wish to create a new load test from scratch, please follow the test setup steps in the original post’s tutorial however, be sure to SKIP the 3rd party report and listener portion of the test setup (guess what, you won’t be needing those plugins anymore).
If you have an existing test you wish to simply fire up in Jmeter 3, your mileage will vary in this case. Some of the 3rd party listeners and other tools you may have used in your setup may be incompatible with the newer version of Jmeter. If you have any custom listeners embedded in your test I recommend doing the following:
- Open your original test in your older version of Jmeter
- Remove 3rd party listeners, samplers or elements from your test (right-click and select remove)
- Save the updated test as a new test
- Open the newly created test in Jmeter 3
From this point, you won’t really need any of your original report listeners configured in your test, however, for debugging purposes, I do recommend keeping a simple response listener in your test – one for successful API responses, another separate for failed responses – just to help with debugging any issues your test might run into.
In a few cases, I’ve found despite removing any 3rd party plugins that some tests have compatibility issues with Jmeter 3. Sadly, the easiest course of action is to rebuild the test from scratch. Such is life (sigh).

Such is life…
Executing Tests with Report Generation
Given you have your initial test configured for Jmeter 3, let’s start up the app and view it in the new UI (though it looks like the old UI). Once you start Jmeter froim the command line, you’ll see a message like this in your terminal:
================================================================================
Don't use GUI mode for load testing, only for Test creation and Test debugging !
For load testing, use NON GUI Mode & adapt Java Heap to your test requirements
================================================================================
You don’t say!? If you’re a long-time user of earlier version of Jmeter, you’re probably thinking, “Well, no duh!” right?
Open your load test in the UI and give it a look-over to make sure its configured the way you intend. It should be minimal simple thread group, your HTTP samplers, your results tree report and any CSV data resources you might need.

Your test may look something like this
Next, save your test and close Jmeter (we’re now done with the Jmeter UI).
Now, we are going to use Jmeter’s command line interface to execute the load test and generate the report for the test.
Do the following:
Open your CLI terminal and navigate to your Jmeter 3 bin directory. Execute the following command:
jmeter -n -t <test JMX file> -l <test log file> -e -o <Path to output folder>
Be sure to set the ‘test JMX file’ argument to the path where your load test’s .JMX file resides, relative to the Jmeter bin directory.
The test log file should be an arbitrary log file path/name that currently does not exist.
The output folder path is where your report will be written to. This must be an empty directory.
A couple of notes:
If you configured your test to run for a set period, just sit back and wait. The report will be generated in the output directory you provided once the test execution finishes.
If you configured it to run in perpetuity – you will need to formally stop the test before report generation will execute (simply killing your terminal session won’t help you here).
To stop your Jmeter test from the command line, simply open a new terminal window and enter one of the following commands:
Control + . – This stops Jmeter, halting any active listeners.
Control + , – This sends a shutdown command to Jmeter – it will wait until all active threads have finished their current tasks before closing shop (this is the recommended method to use unless you’re impatient
or there is an emergency – like, oh you forgot you pointed your test at production).

Are you really going to argue with Chuck?
Once your test has gracefully exited, navigate to the output folder you specified and open your newly minted report in your web browser of choice.
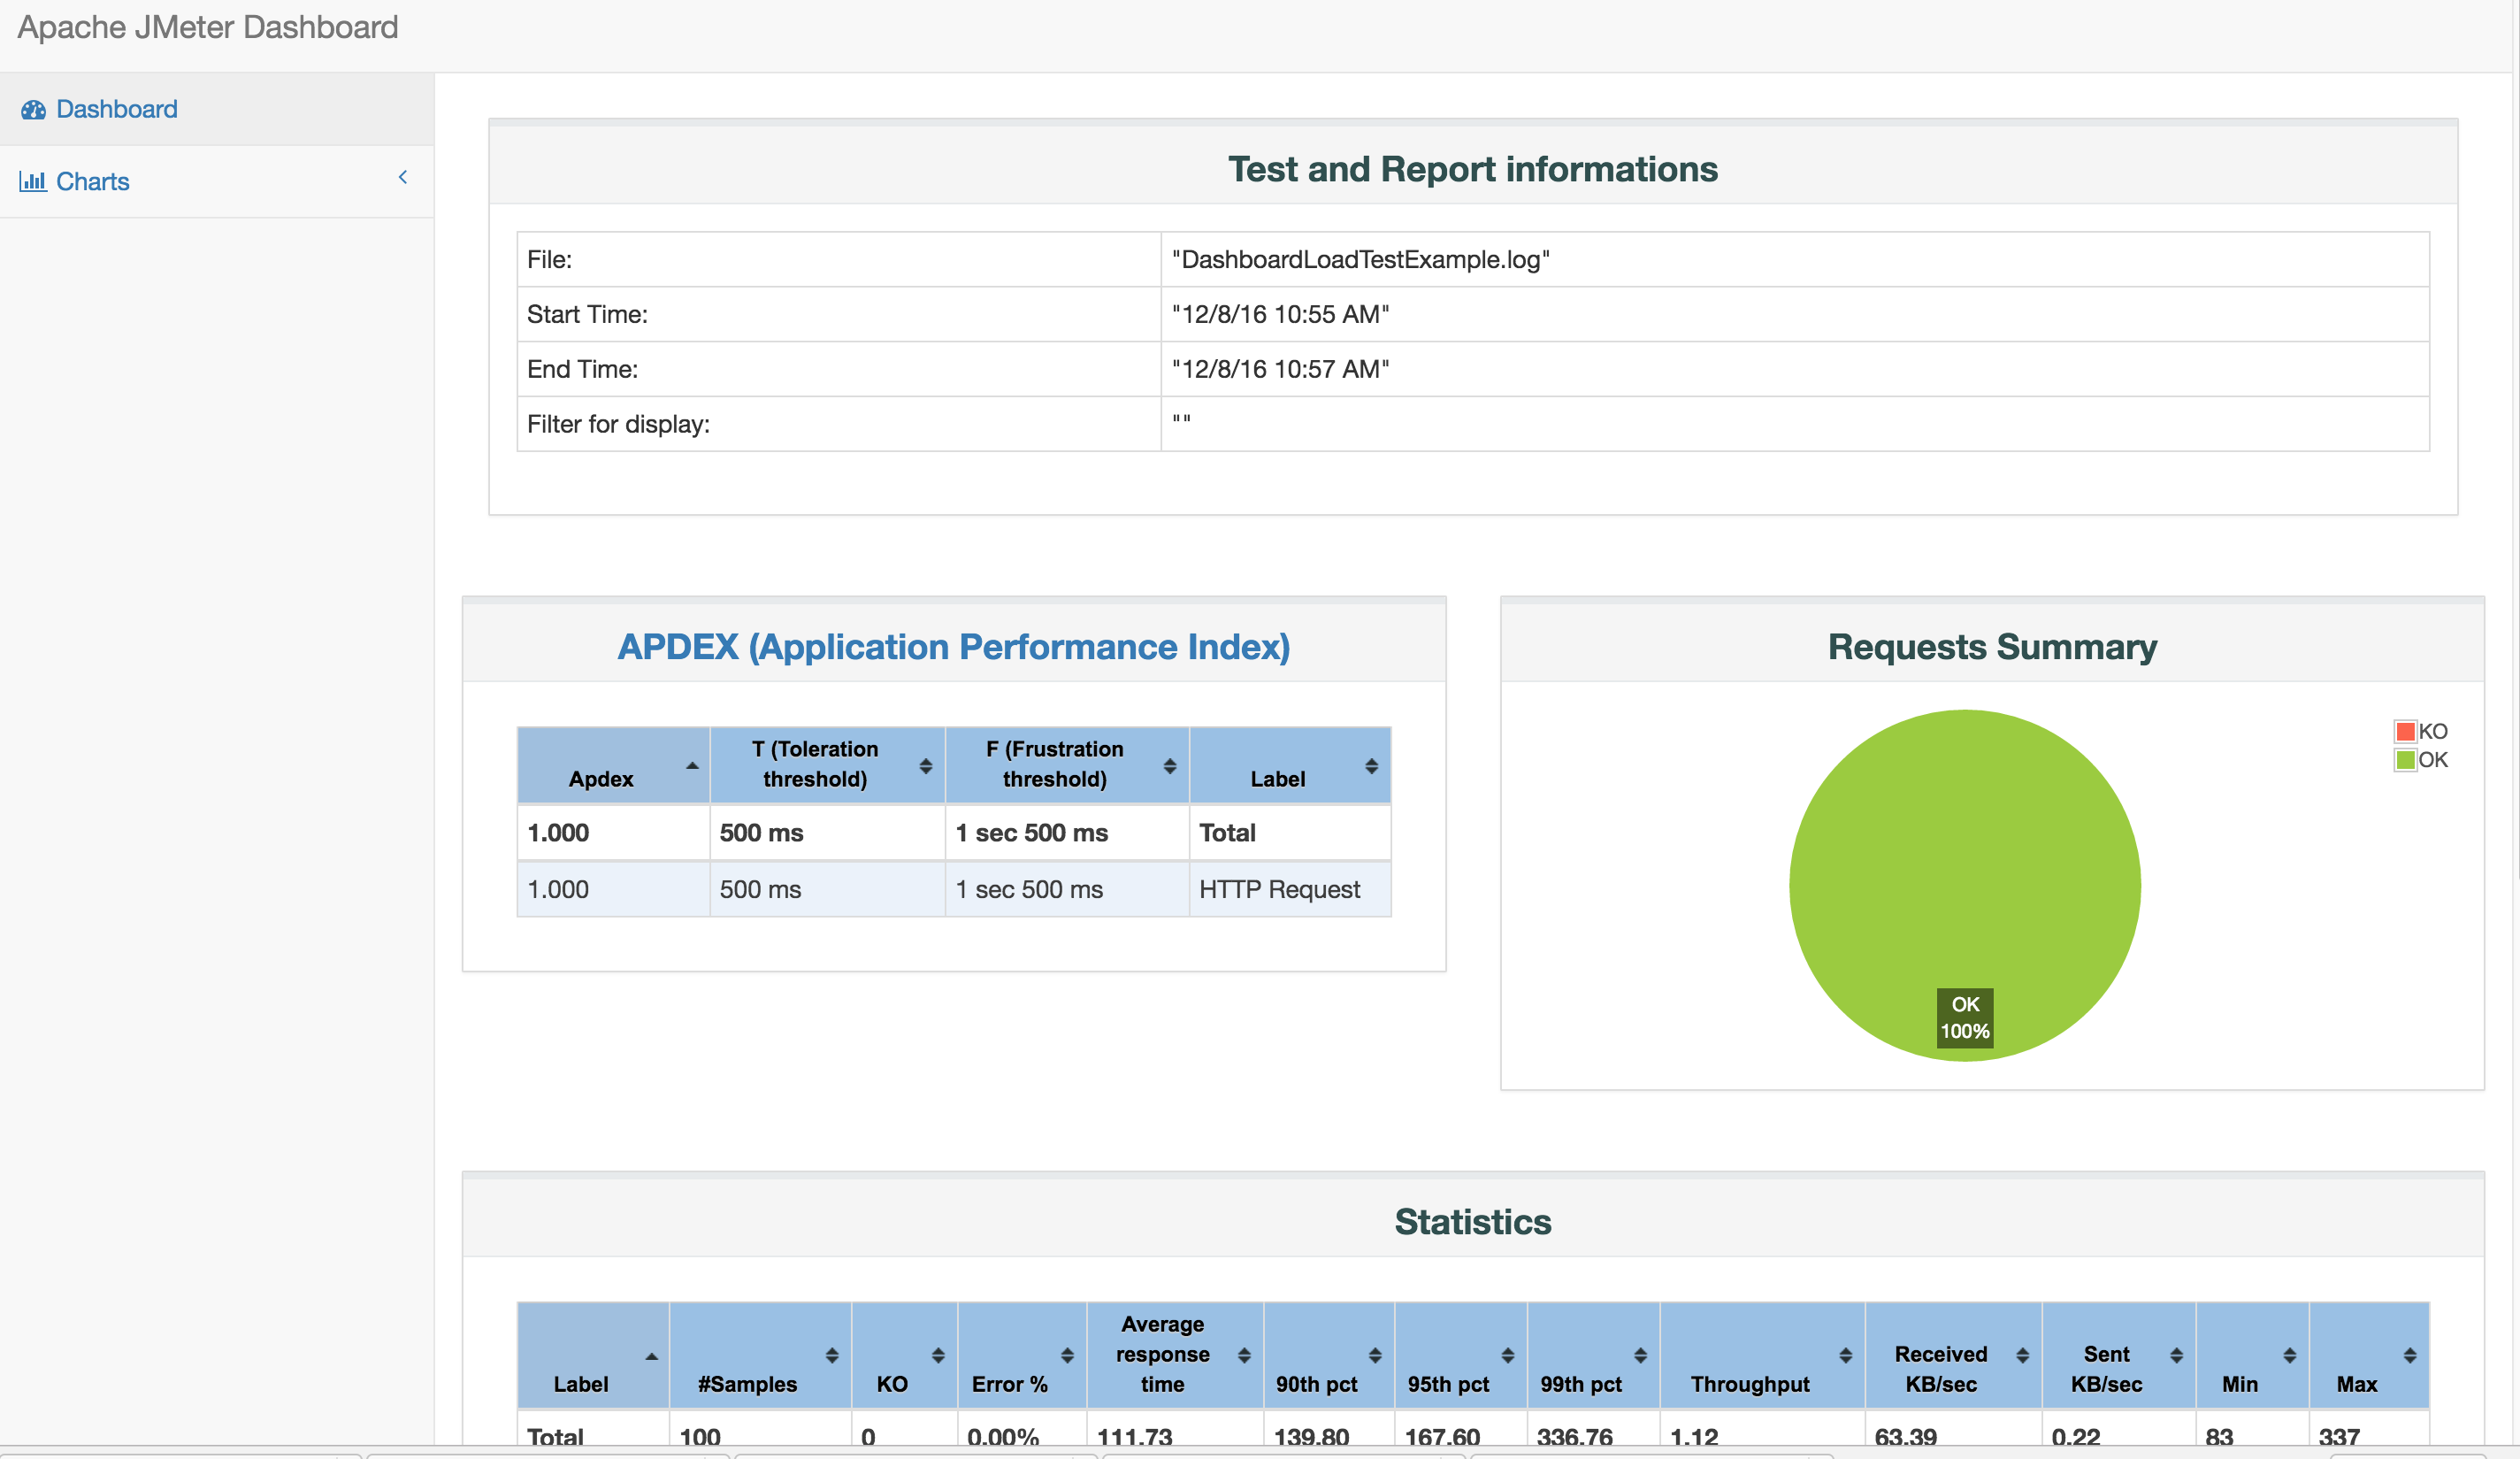
Jmeter 3 HTML report
Pretty sweet huh?

If you haven’t seen Jmeter’s dashboard report before, you’re probably thinking, “golly, there’s a lot of stuff here” – and there is. The dashboard report contains a pretty wide variety of data on your test execution. Enumerating through all of that here would be exhausting however – if you’re interested in all the gory details of Jmeter’s dashboard metrics, check out this in-depth explanation here:
https://jmeter.apache.org/usermanual/generating-dashboard.html
Show and Tell (mostly show)
So now you have this fancy load test report but hoarding all this metric goodness on your local development workstation is no fun for the rest of your team. But that’s OK because if you have access to a continuous integration build environment (ala – Jenkins), the rest of this blog post will walk you through taking your Jmeter test and throwing it into a Jenkins build that allows you to not only run your test remotely but also save and propagate your results to the rest of your agile team.
Make your test available
First things first, you’re going to need to take your Jmeter test, get it off your local machine and into some form of web-accessible delivery. If you have AWS access, you could place your .JMX files and resources into a bucket and be done with it. In our case, I recommend creating a private Github repository for your tests and committing your Jmeter working directory, tests and resource files to that repository. There’s a couple of reasons for this:
- It’s easy to access a given Github repository with Jenkins
- You can manage updates and versions of your tests just like source code
- You can manage variants of your load tests using Github’s branch management features
That said, before tossing your tests into Github’s gaping maw, here’s an important note regarding information security:
Depending on your type of load test, you may have some API or other service access keys stored in your test. You don’t want to check in API or other access keys into your repository (even if it is marked private). But don’t just take my word for it:
If you’ve already committed your tests to your repository and you still have some software keys in there and are thinking, “Oh boy… What now!?”, here’s a link to some handy notes on how to extract some sensitive values from your test or code using some handy features of Git:
https://gist.github.com/derzorngottes/3b57edc1f996dddcab25
Getting Up and Running with Jenkins
Jenkins is one of the most widely available CI build tools in use today. As such, we’re going to cover how to set up a Jenkins task to run your load tests. If you’re using some other build system (e.g. Team City) this walk-through won’t be as pertinent but essentially, the tasks will be the same.
Step 1: Get access to Jenkins:
Assuming you already have a Jenkins build server of some sort available to your organization – let’s log into it. If you don’t have access to Jenkins, talk to your friendly neighborhood dev ops engineer. Note, that for this walkthrough, you’re going to need some level of administrator access to set up everything we need to execute our tests.
Step 2: Create and Setup your Job with Parameters:
Do the following:
- From the Jenkins home page, choose a directory you wish to run your load test jobs from (or create one).
- Click the “New Item” link and then choose “Freestyle Project”
- Give your project a name and description
- Choose the “This project is parameterized” option – we’ll use parameters to allow you to configure your load test If needed.
- Select the “New string parameter” option and create a new parameter named, “thread”
- Set the default value to whatever you want your test’s default number of threads to be (e.g. 40).
- Create another string parameter and name it “ramp” – set its default value to the number of seconds you wish your test to take to ramp up to its maximum load.
-
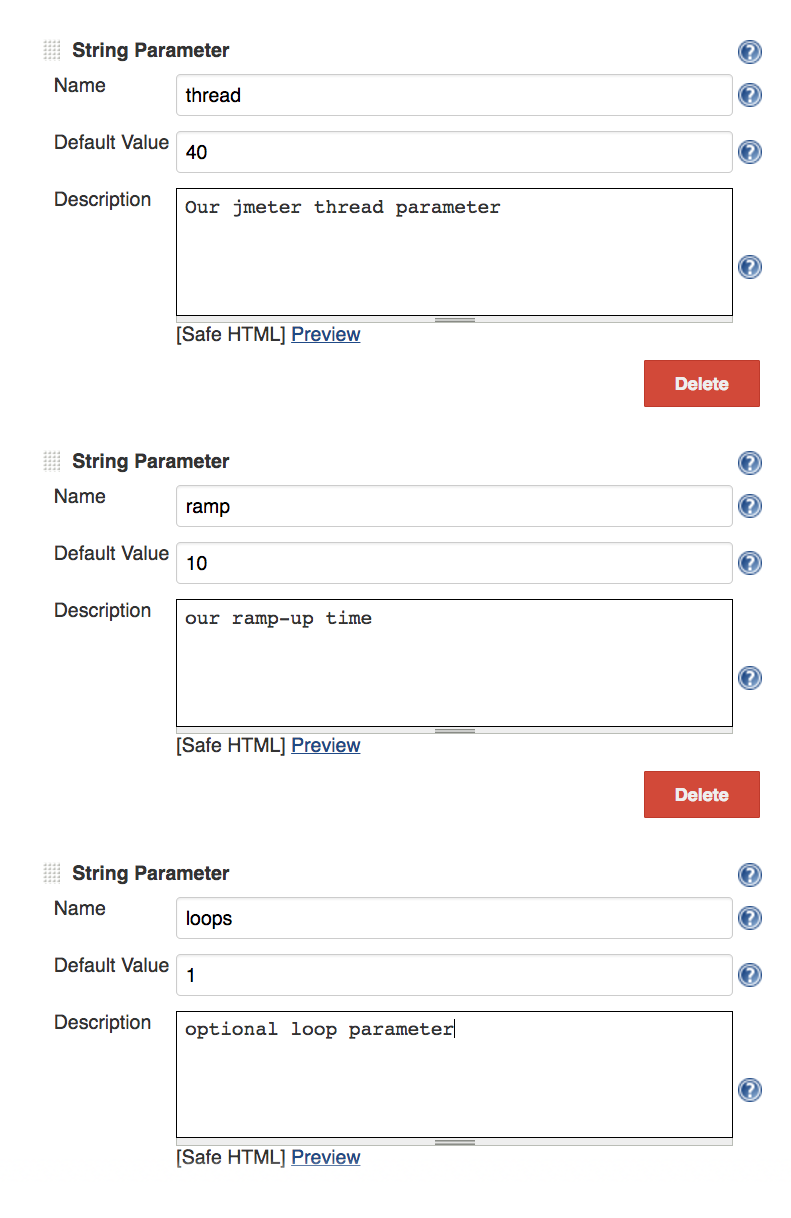
If your test is going to loop, create another string parameter named, “loops” and set its default, numeric value.
If you have an API key (or keys) you need for your test to execute, as mentioned above, and have already removed said keys from your test (substituting them for a placeholder value) you can create additional string parameters here (naming them key1, key2, etc.). You can then set your API key(s) to the default value field. Granted, you are propagating your API key here but this is a much better practice in terms of security than leaving them in a potentially publicly accessible repository as your Jenkins instance should be private and protected.

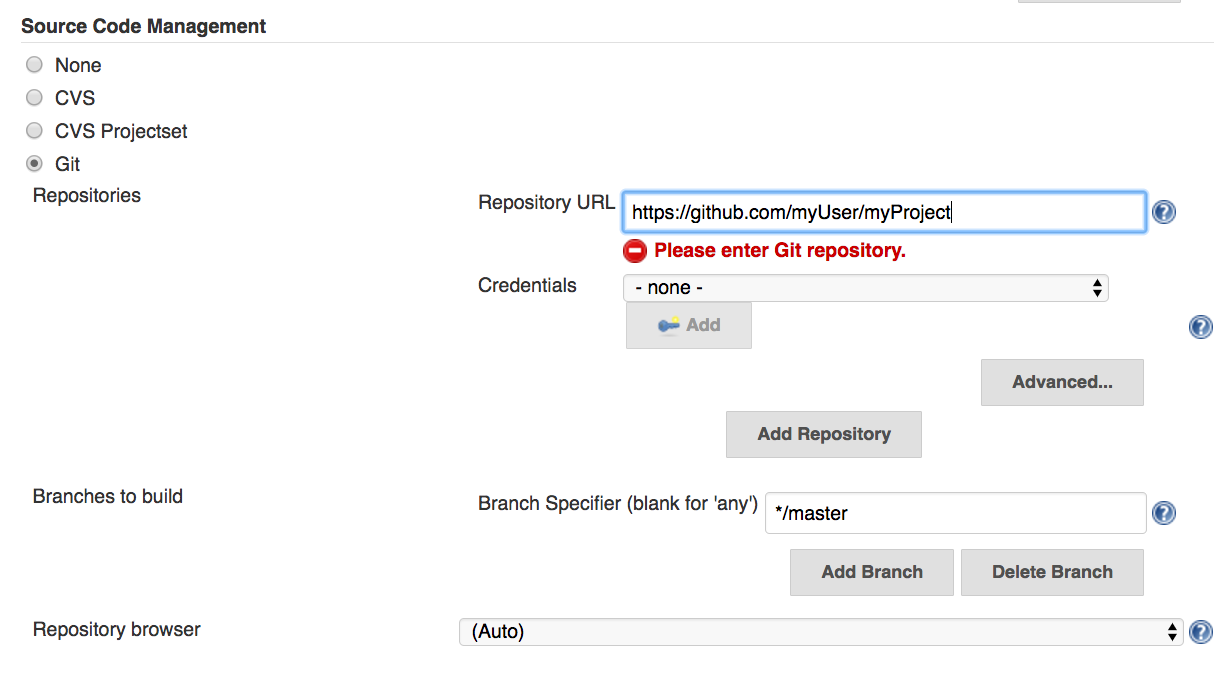
Step 3: Git Jenkins to Talk to Git:
While still in the Jenkins job configuration screen, under the Source Code Management section, select “Git” and enter your repository’s URL alias into the Repository URL field.
If this is your first time doing this, Jenkins expects a specific format for your Github URL strings. It should look something like this:
https://github.com:<your main repository name>/<your project name>
If you’re using a publicly accessible Github repository, skip the next step, enter your preferred branch name (or */master if you don’t need a specific branch).
Next, select the appropriate credentials option from the relative drop down menu to allow Jenkins to properly introduce itself to your Github repo (if you’re having trouble with this, ask your dev ops engineer or Jenkins server admin for help – and maybe do something nice for them while you’re at it like get them a thank you card or some cookies or something, because at this point, you’d be out of luck without them, right?).
Step 5: Build Settings:
You can kick off your tests manually however, it’s probably better to set up timer or other method to handle this for you. Try the following:
Under the Build Triggers heading, check the Build periodically option
Enter your time range you wish the build to trigger at (this will be in Cron notation – which is tricky if you’re seeing this for the first time).
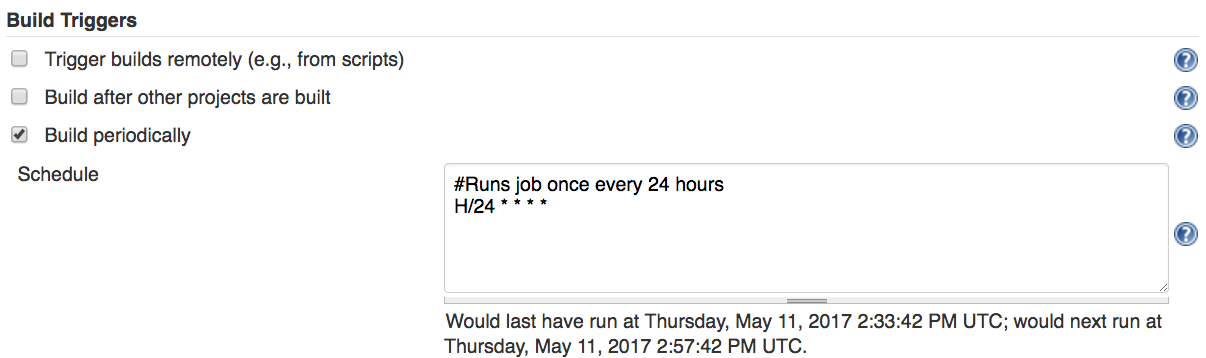
This article does a decent job explain Cron’s formatting: http://www.nncron.ru/help/EN/working/cron-format.htm
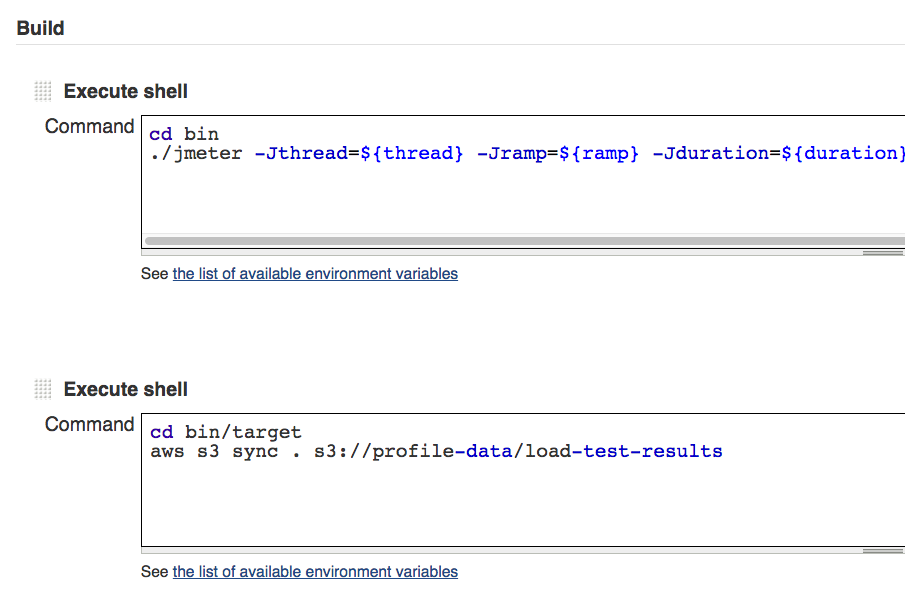
Now, click on the Add build step option and from the dropdown menu, select ‘Execute shell’.
Here, we will define the command we will use to execute the Jmeter test once Jenkins pulls the test resources from Github. This will be like the shell command we used to run Jmeter locally as described above.
Syncing to Amazon Web Services
Now we need to make sure we’re saving our generated report somewhere so the rest of our team can review it. Jenkins has a Jmeter performance plugin that can archive our results. Also, we could just have Jenkins archive the output directory Jmeter generates the report in (though handing all the recursive directories it will build might be a pain).
Given you have an AWS account, you have the options to sync your reports to an AWS bucket and host them like a static web page. This method would be beneficial if you need to expose your load test results to team members or other parties that do not or should not have access to your build systems (e.g. product manager, support team members, etc.).
If you don’t have access to AWS, aren’t sure you have access to AWS or may have issues with your build server communicating to AWS, once again, now is a fine time to make friends with (*cough* bribe *cough*) your friendly neighborhood dev ops engineer.
Let’s say you’ve taken care of that and you and your dev ops guru are best buddies now. Next, you’ll need to further configure your Jenkins job by adding another Execute shell build step. Make sure this one is ordered sequentially after your Jmeter test execution step.
In the Execution shell, simply add a command to change to the output directory your report will be in (defined in your test execution command) and use the AWS sync command to send your HTML report to AWS:
cd bin/target
 aws s3 sync . s3://mybucketroot/mybucketname
Save your Jenkins job. You’re done (with Jenkins at least).
Now, in the above step, we are assuming you have a bucket already created in AWS where you can sync your data to. You’re also going to need access to modify how the bucket works in terms of its permissions.
Making Your Test Results Readable from the Web:
By default, your AWS bucket is out there on the web, you can read from it, write from it, but your other team members will have trouble reading the HTML report from that location. We need to configure the bucket so that it will display its contents like a static web page. Here’s how:
Log into your AWS account and access your specified bucket.
Click on the bucket and select the Properties option
Click the Static website hosting panel
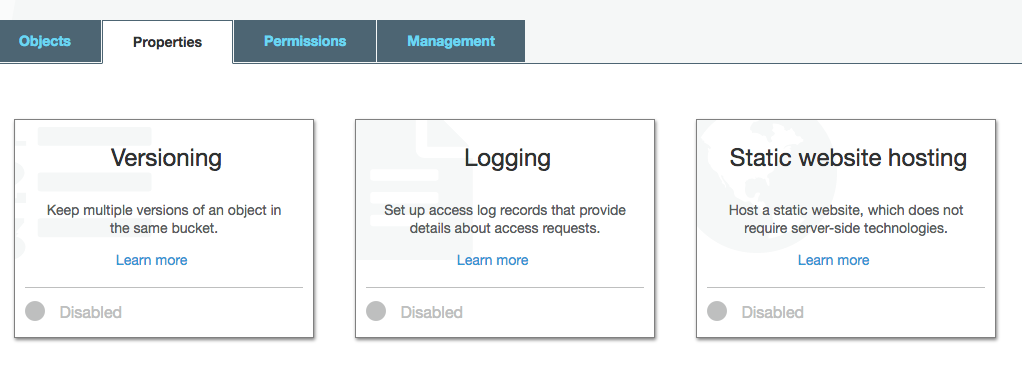
Enable the static hosting option
Specify your index.html file location (this should be the relative path to the main HTML file for your uploaded report).
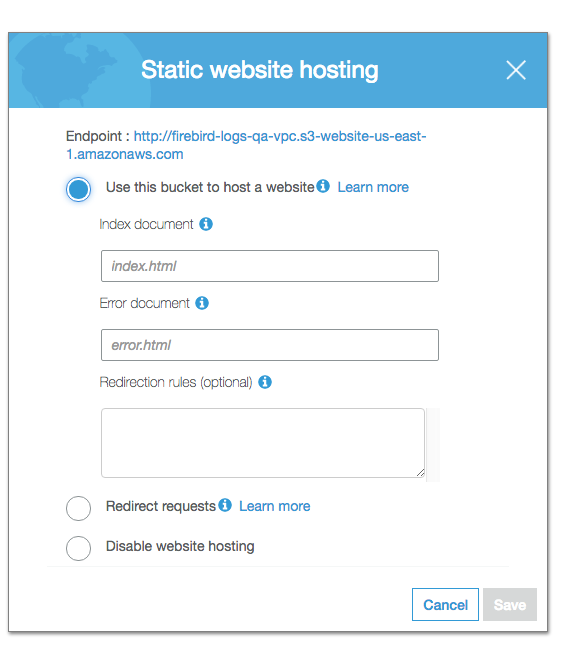
Save your changes and boom – now you’re done.
Save and run your job. If your account permissions are all set up correctly, your test should execute and the test results will be uploaded to the specified AWS bucket.
From here, simply access your AWS bucket using the following styled web link:
https://s3.amazonaws.com/myBucketRoot/myBucketName
 Your test results should now be viewable just as if they were a static web page by anyone on your team.
Wrapping it Up:
Now that you have your load tests residing in a Github repository, feel free to leverage Github’s branching features to allow you to manage multiple iterations of your load tests:
Commit different variations of the same branch to new branches
Use Jenkin’s copy feature to copy your existing job, and just point it to your different branches to allow you to execute multiple test types.
Use Jmeter’s UI locally to copy/edit your existing tests to make additional iterations. Save these to your repo and commit them just like you would any other coding project.
Again, use Jenkin’s copy feature to create variations of your test run jobs – this time, just edit your shell command to execute your desired .JMX test file per a given execution.
Thanks for reading and I hope this give you further ideas and insight into how you can leverage Jmeter to further improve your software projects through load testing.