The Old Way vs. The Reality of Your Customers
For years, the gold standard for benchmarking web performance, particularly for Google’s Core Web Vitals (CWV), has been a mobile device baseline—specifically, a throttled connection and CPU designed to simulate a Moto G4. This approach was established with good intentions: to ensure websites are accessible to users on older, lower-end devices and slower networks. It was a one-size-fits-all solution for a global audience.
However, the world has changed. The devices your customers use today are a far cry from the Moto G of years past. Relying on this outdated benchmark device is no longer an accurate measure of your user experience and, more importantly, it can lead to a poor return on investment (ROI) for your performance optimization efforts in the web layer.
This document will walk you through why a shift is necessary and present a new, data-driven benchmarking strategy based on the reality of your user traffic.
The Problem with the old Benchmark
The Core Web Vitals we focus on—Largest Contentful Paint (LCP), Interaction to Next Paint (INP), and Cumulative Layout Shift (CLS)—are all heavily influenced by a device’s hardware and network. The Moto G benchmark, while a useful reference, presents three critical problems for e-commerce businesses:
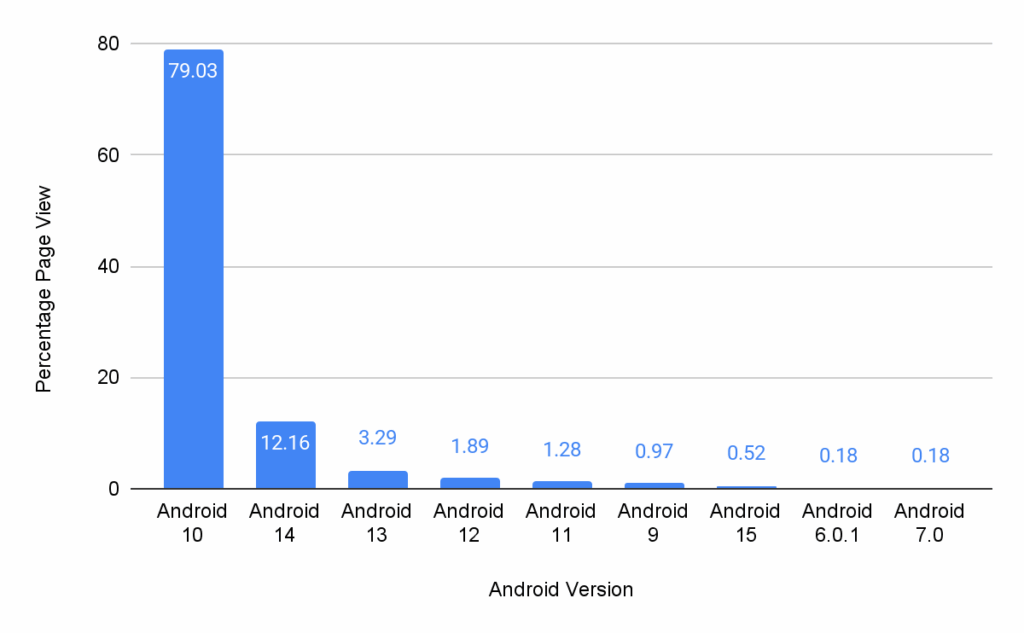
- The Hardware Mismatch: The Moto G4 was released in 2016, running on Android 6.0.1 (Marshmallow). Modern traffic data, however, tells a very different story. Our internal data from the Bazaarvoice Hosted Display component, which powers ratings and reviews on thousands of e-commerce sites, shows that the oldest version of iOS we see reaching our services is on an iPhone X, while the oldest Android OS is Android 10. Optimizing for a device running an OS that is multiple generations behind a significant portion of your user base is a fundamental mismatch.
- The Network Gap: The Moto G benchmark simulates a slow 3G/4G network connection. Today’s reality is that the world is rapidly adopting faster networks. By the end of 2024, global 4G network coverage reached 90% of the population, and 5G mid-band population coverage was at 40% [1]. These modern networks, combined with the faster CPUs of current devices, drastically reduce the time needed for critical tasks like DNS lookups and SSL handshakes, which heavily influence your Time to First Byte (TTFB) and, consequently, your LCP.
- The Negative ROI: The Moto G benchmark represents a minuscule, and frankly, a declining portion of your audience. The cost and effort of optimizing for the technical limitations of these devices—such as slow CPU and memory processing of HTTP/2 responses—simply do not provide a meaningful ROI. The Moto G itself is no longer in production, further cementing its irrelevance as a modern performance target.
Infographics – Market trends from 2024
Here is a look at some of the latest mobile market trends from 2024:
The Bazaarvoice Way (A Data-Driven Alternative)
At Bazaarvoice, our performance optimization strategy is driven by our clients’ real-world traffic data, not a static global benchmark. Our data reveals a powerful truth about your customers:
- 75%+ of all traffic to our Hosted Display component comes from mobile devices. This is a metric that is validated by global e-commerce trends, with multiple industry reports confirming that over 70% of e-commerce traffic is now mobile-driven [2, 3]. This highlights the critical importance of mobile performance.
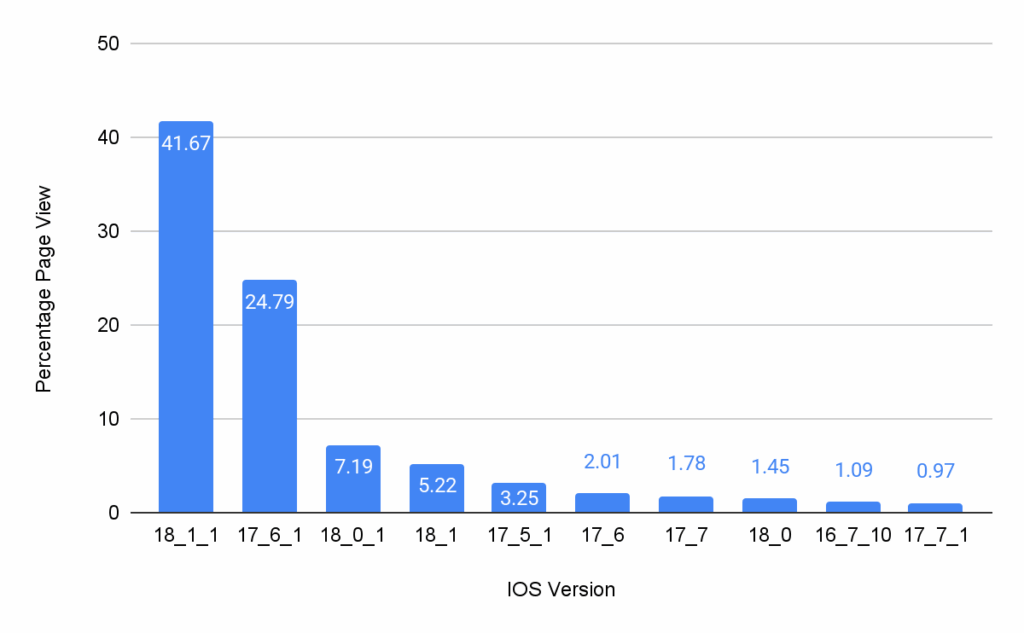
- The most-used devices are far more powerful than the Moto G. For example, we see that 41% of all traffic comes from iOS devices, with a significant concentration on recent versions. We also see that 21% of traffic comes from Android 10+ devices, with Android 10 itself generating a substantial amount of traffic at 15%. This mirrors broader market trends, especially in high-income regions, where iOS and newer Android devices dominate e-commerce traffic [4, 5].
This data allows us to propose a new, intelligent benchmarking strategy that delivers better user experience and a higher ROI.
Infographics – Device capacity comparison
This infographic illustrates the hardware and network gap between the old and new mobile devices:
The New Benchmarking Strategy
Instead of optimizing for an obsolete device, we recommend a two-pronged approach:
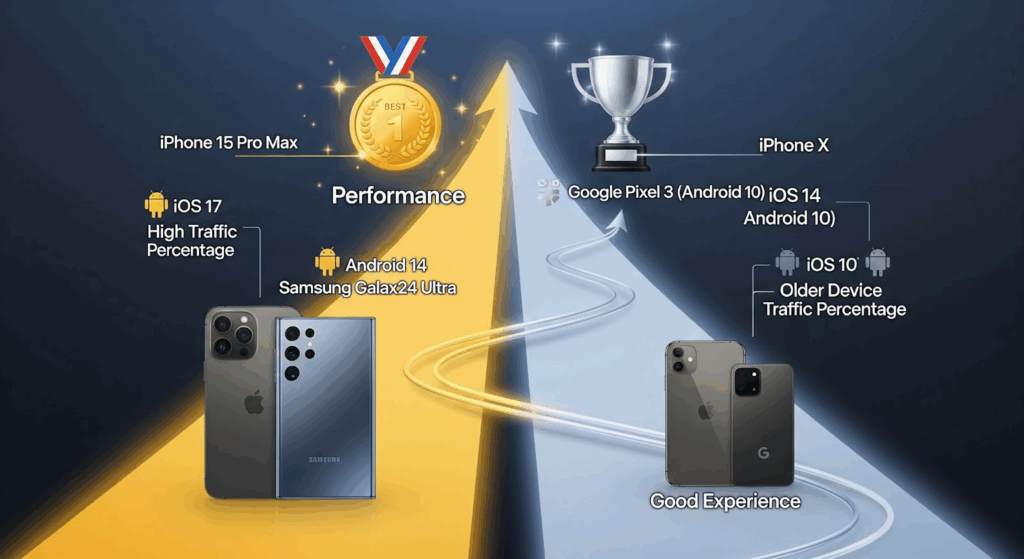
- The “Golden Path” Benchmark: Optimize your web services and UI components for the devices your customers use most. In our case, this would mean ensuring exceptional performance on the newest iOS and Android devices, as they represent the majority of your traffic.
- The “Long Tail” Benchmark: Use the oldest high-traffic devices in your dataset (e.g., iPhone X, Android 10) as your baseline to ensure a good experience for the widest possible audience. This approach focuses on the reality of your user base and prevents a small, but still relevant, group from having a poor experience.
By using this approach, you can take full advantage of the improved capabilities of modern devices. Faster CPUs and higher RAM on newer phones allow for quicker processing of complex JavaScript and UI rendering, leading to better LCP and INP values. This means your ratings and reviews content can appear faster, enhancing consumer trust and driving conversions without the compromises required by a legacy benchmark.
Infographics – Suggested benchmarking approaches
Data from BFCM 2024 traffic
Black Friday and Cyber Monday (BFCM) represent the peak traffic period for eCommerce, significantly boosting sales across all consumer segments. BFCM 2024 witnessed unprecedented mobile traffic, with industry reports indicating that mobile devices accounted for over 70% of all e-commerce traffic during this period. This underscores the critical importance of mobile-first optimization strategies.
Data of iOS versions during the BFCM 2024
Here’s a look at iOS version data, showing how customers using Bazaarvoice clients check out Ratings & Reviews and other related stuff from us.

Data of Android versions during the BFCM 2024
This data details Android OS versions used by customers accessing Bazaarvoice Ratings & Reviews, and other related content.

The Bazaarvoice Baseline: A Long-Tail Approach
Given this data-driven reality, Bazaarvoice is officially adopting a new, more comprehensive baseline for measuring and publishing Core Web Vitals (CWV) performance for our Hosted Display component. This strategic shift is driven by a deep understanding of user behavior and the diverse range of devices used to access our clients’ sites. Our new standard will be meticulously based on the oldest high-traffic device, which robustly represents the “long-tail” of your customer base—those users who might not have the latest flagship smartphones or the most powerful internet connections.
By setting this critical benchmark on a device like the iPhone X or an Android 10 phone, we achieve several key objectives. Firstly, we ensure that our performance optimizations are robust enough to provide a truly great and consistent experience for a significant and often underserved portion of your users. This approach directly addresses the real-world conditions many customers face, preventing a fragmented experience where only those with top-tier devices enjoy optimal performance. Secondly, and critically, this also means that all newer, more powerful devices will naturally exceed this rigorous benchmark, delivering an even faster, smoother, and more delightful experience to the vast majority of your audience. This tiered benefit ensures that while we elevate the experience for all, the most powerful devices continue to perform at their peak.
This strategy allows us to provide a transparent, objective, and highly actionable measure of performance that directly correlates with the actual user experience your customers are having, rather than a theoretical or idealized one based solely on cutting-edge hardware. It moves beyond abstract metrics to focus on tangible improvements that impact real people. By focusing on the foundational experience for the “long-tail,” we establish a rising tide that lifts all boats, guaranteeing a superior and more equitable browsing experience across the entire spectrum of your audience. This commitment to real-world performance underscores Bazaarvoice’s dedication to optimizing the user journey for every customer, irrespective of their device’s age or capabilities.
CWV metrics with new Baseline devices
Below are the CWV metrics for the Hosted Display application version as on Aug 13, 2025 and tested with different devices using the LTE network for the devices.
It includes the following fields:
- Mobile Device: Specifies the type of mobile device used for testing (e.g., Google Pixel, iPhone X).
- CWV Metrics: Indicates the specific Core Web Vital metric being measured (e.g., LCP – Largest Contentful Paint, INP – Interaction to Next Paint, CLS – Cumulative Layout Shift, TBT – Total Blocking Time).
- First View (in seconds): Shows the performance metric for the initial page load.
- Repeat View (in seconds): Shows the performance metric for subsequent page loads.
Below is the CWV metrics color coding to benchmark performance:

The table’s purpose is to demonstrate the performance of the Hosted Display application on different devices under specific network conditions, providing data for a new benchmarking strategy based on real-world traffic
| Mobile Device | CWV Metrics | First View (in seconds) | Repeat View (in seconds) |
| Google Pixel (Low end device by BV traffic) | LCP | 2.5 | 1.7 |
| INP | NA | NA | |
| CLS | 0 | 0 | |
| TBT | 0.131 | 00.113 | |
| Google Pixel 4XL (High end device by BV traffic) | LCP | 1.6 | 00.9 |
| INP | NA | NA | |
| CLS | 0 | 0 | |
| TBT | 0.016 | 0 | |
| iPhone X (Low end device by BV traffic) | LCP | 1.29 | 0.69 |
| INP | NA | NA | |
| CLS | 0.006 | 0.006 | |
| TBT | 0 | 0 | |
| iPhone 15 (High end device by BV traffic) | LCP | 1.31 | 0.66 |
| INP | NA | NA | |
| CLS | 0.006 | 0.006 | |
| TBT | 0 | 0 |
Taking Control of Your E-commerce Performance
The era of a single, universal device benchmark is over. The global market has shifted, and so should your performance strategy. Research from sources like IDC and Opensignal confirm that users are upgrading to more powerful devices with access to faster networks at a rapid pace [6, 7].
Your performance optimization efforts should be an investment in the experience of your actual customers, not an abstract user from years past. By using your own traffic data to create a custom benchmarking strategy, you can ensure that every millisecond of optimization translates into a better user experience, higher engagement, and a more robust ROI for your business.
Citations:
- Bazaarvoice Hosted Display CWV Performance Testing Methodology: Bazaarvoice Hosted Display CWV Performance Testing Methodology
- GSMA Intelligence. (2024). The Mobile Economy 2024. Retrieved from https://www.gsma.com/solutions-and-impact/connectivity-for-good/mobile-economy/the-mobile-economy-2024/
- Dynamic Yield. (2025). Device usage statistics for eCommerce. Retrieved from https://marketing.dynamicyield.com/benchmarks/device-usage/
- Oyelabs. (2025). 2025 Mobile Commerce: Key Statistics and Trends to Follow. Retrieved from https://oyelabs.com/mobile-commerce-key-statistics-and-trends-to-follow/
- MobiLoud. (2025). Android vs iOS Market Share: Most Popular Mobile OS in 2024. Retrieved from https://www.mobiloud.com/blog/android-vs-ios-market-share
- Backlinko. (2025). iPhone vs. Android User & Revenue Statistics (2025). Retrieved from https://backlinko.com/iphone-vs-android-statistics
- IDC. (2024). Worldwide Smartphone Market Forecast to Grow 6.2% in 2024. Retrieved from https://my.idc.com/getdoc.jsp?containerId=prUS52757624
- Opensignal. (2024). Global Network Excellence Index. Retrieved from https://www.opensignal.com/global-network-excellence-index


